
This is a LONG POST, Not specifically about LIC Housing finance but about the ENTIRE Housing Finance Niche it operates in. It aims to provide a very good understanding of LIC Housing finance’s competition and Industry level nuances.
First, we’ll be looking at some common Sense Sectoral metrics, starting with :
- Total Housing Loan Market Size and Growth
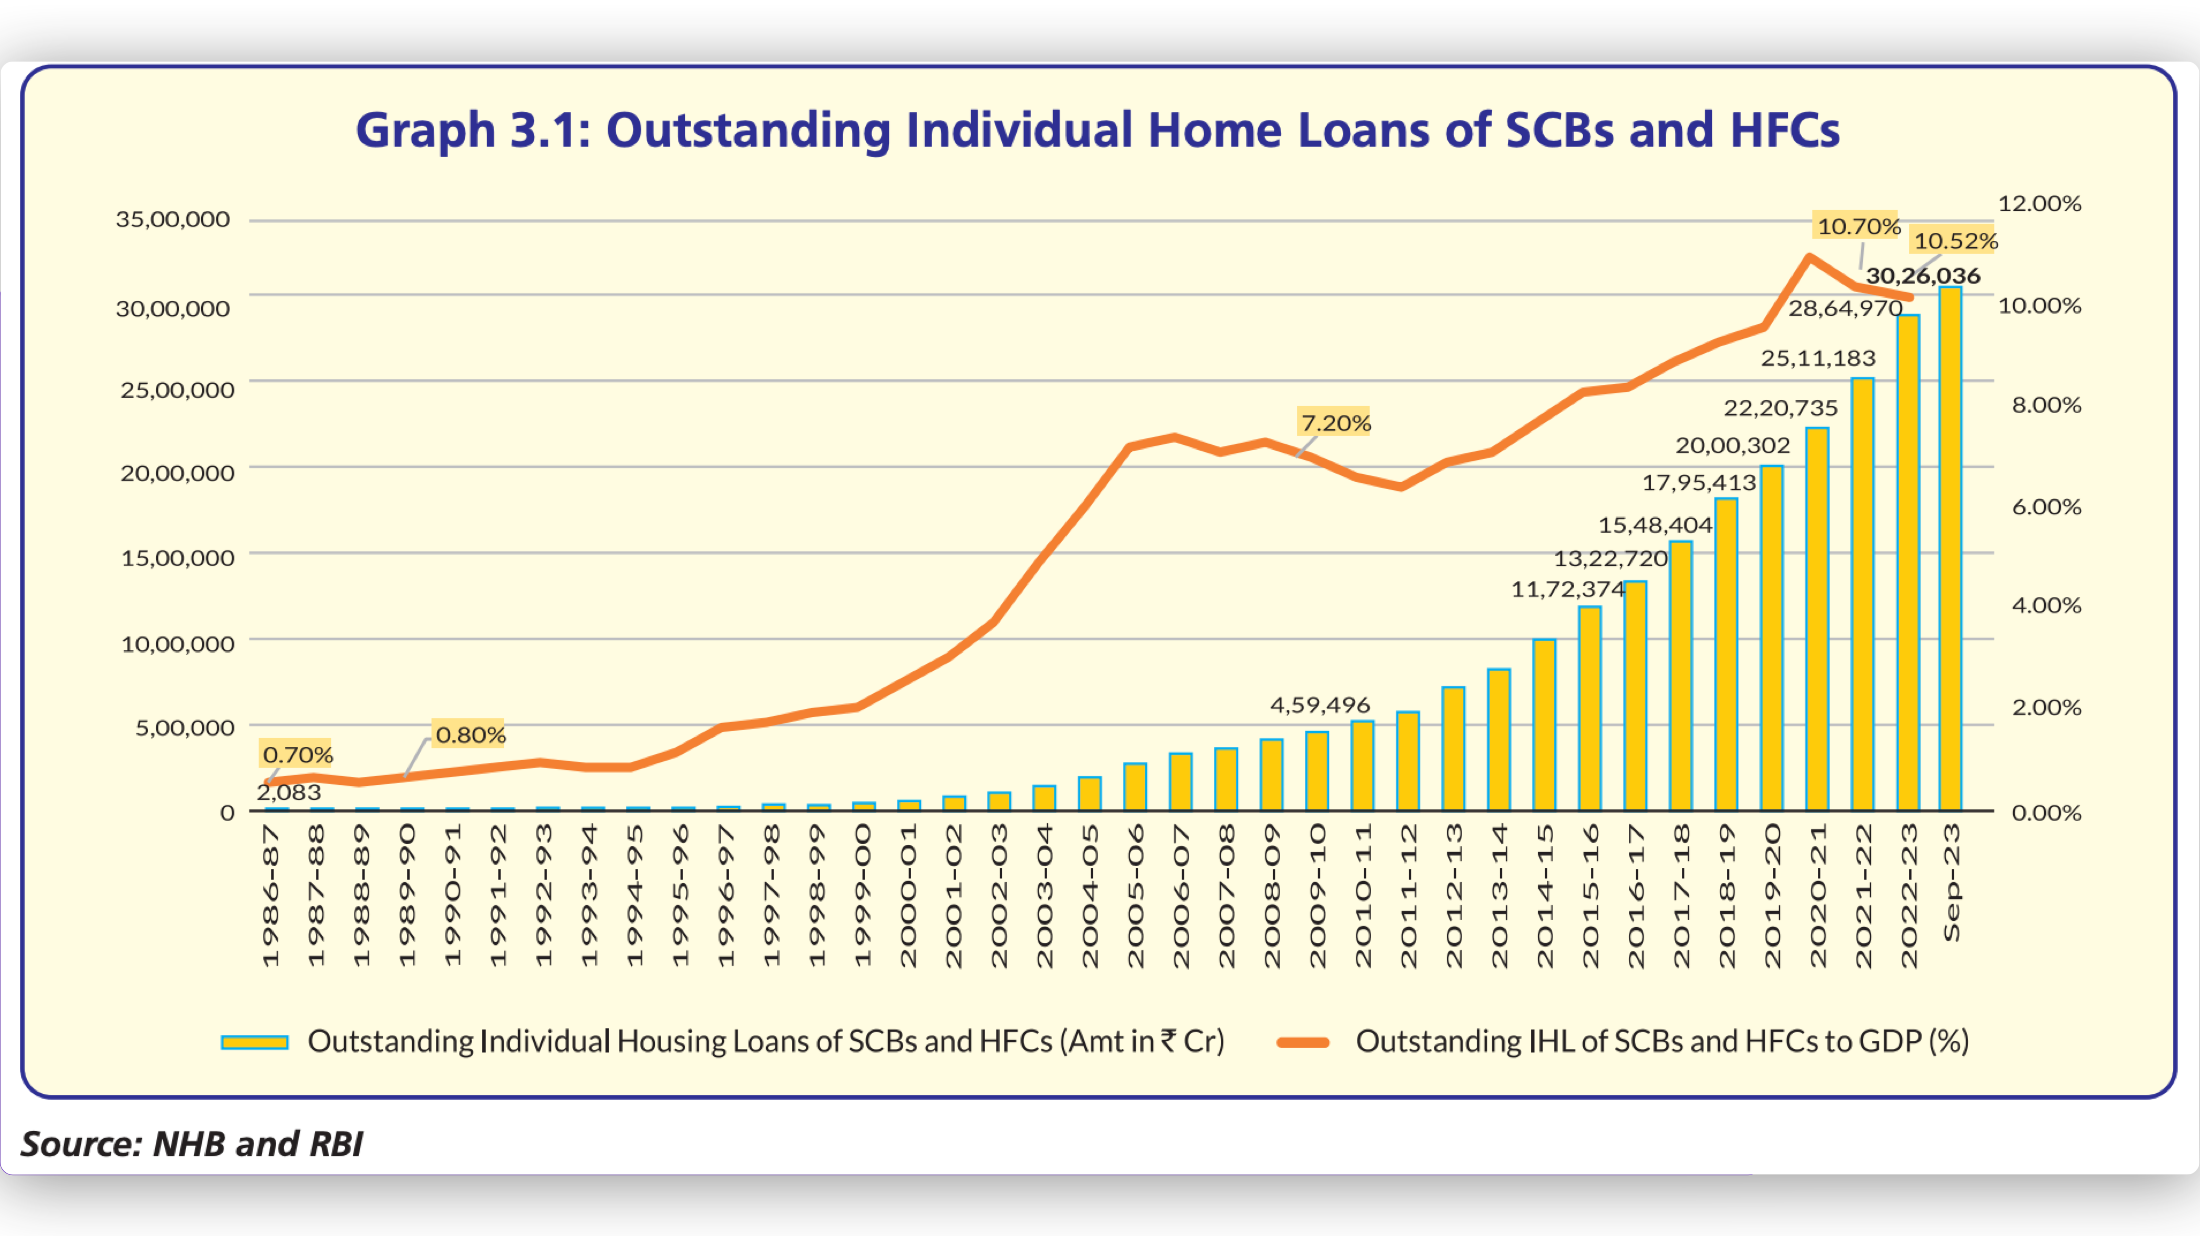
The chart below shows Outstanding Individual Home Loans (IHLs) and the ratio IHLs / GDP (%) a.k.a Mortgages to GDP Ratio, which reflects the improving (but still low) penetration of Home Loans in India.
If you look at the Home loans (hereafter: HLs ) as a percentage of Total Loans outstanding, you’ll notice that it has consistently increased over the given time frame.
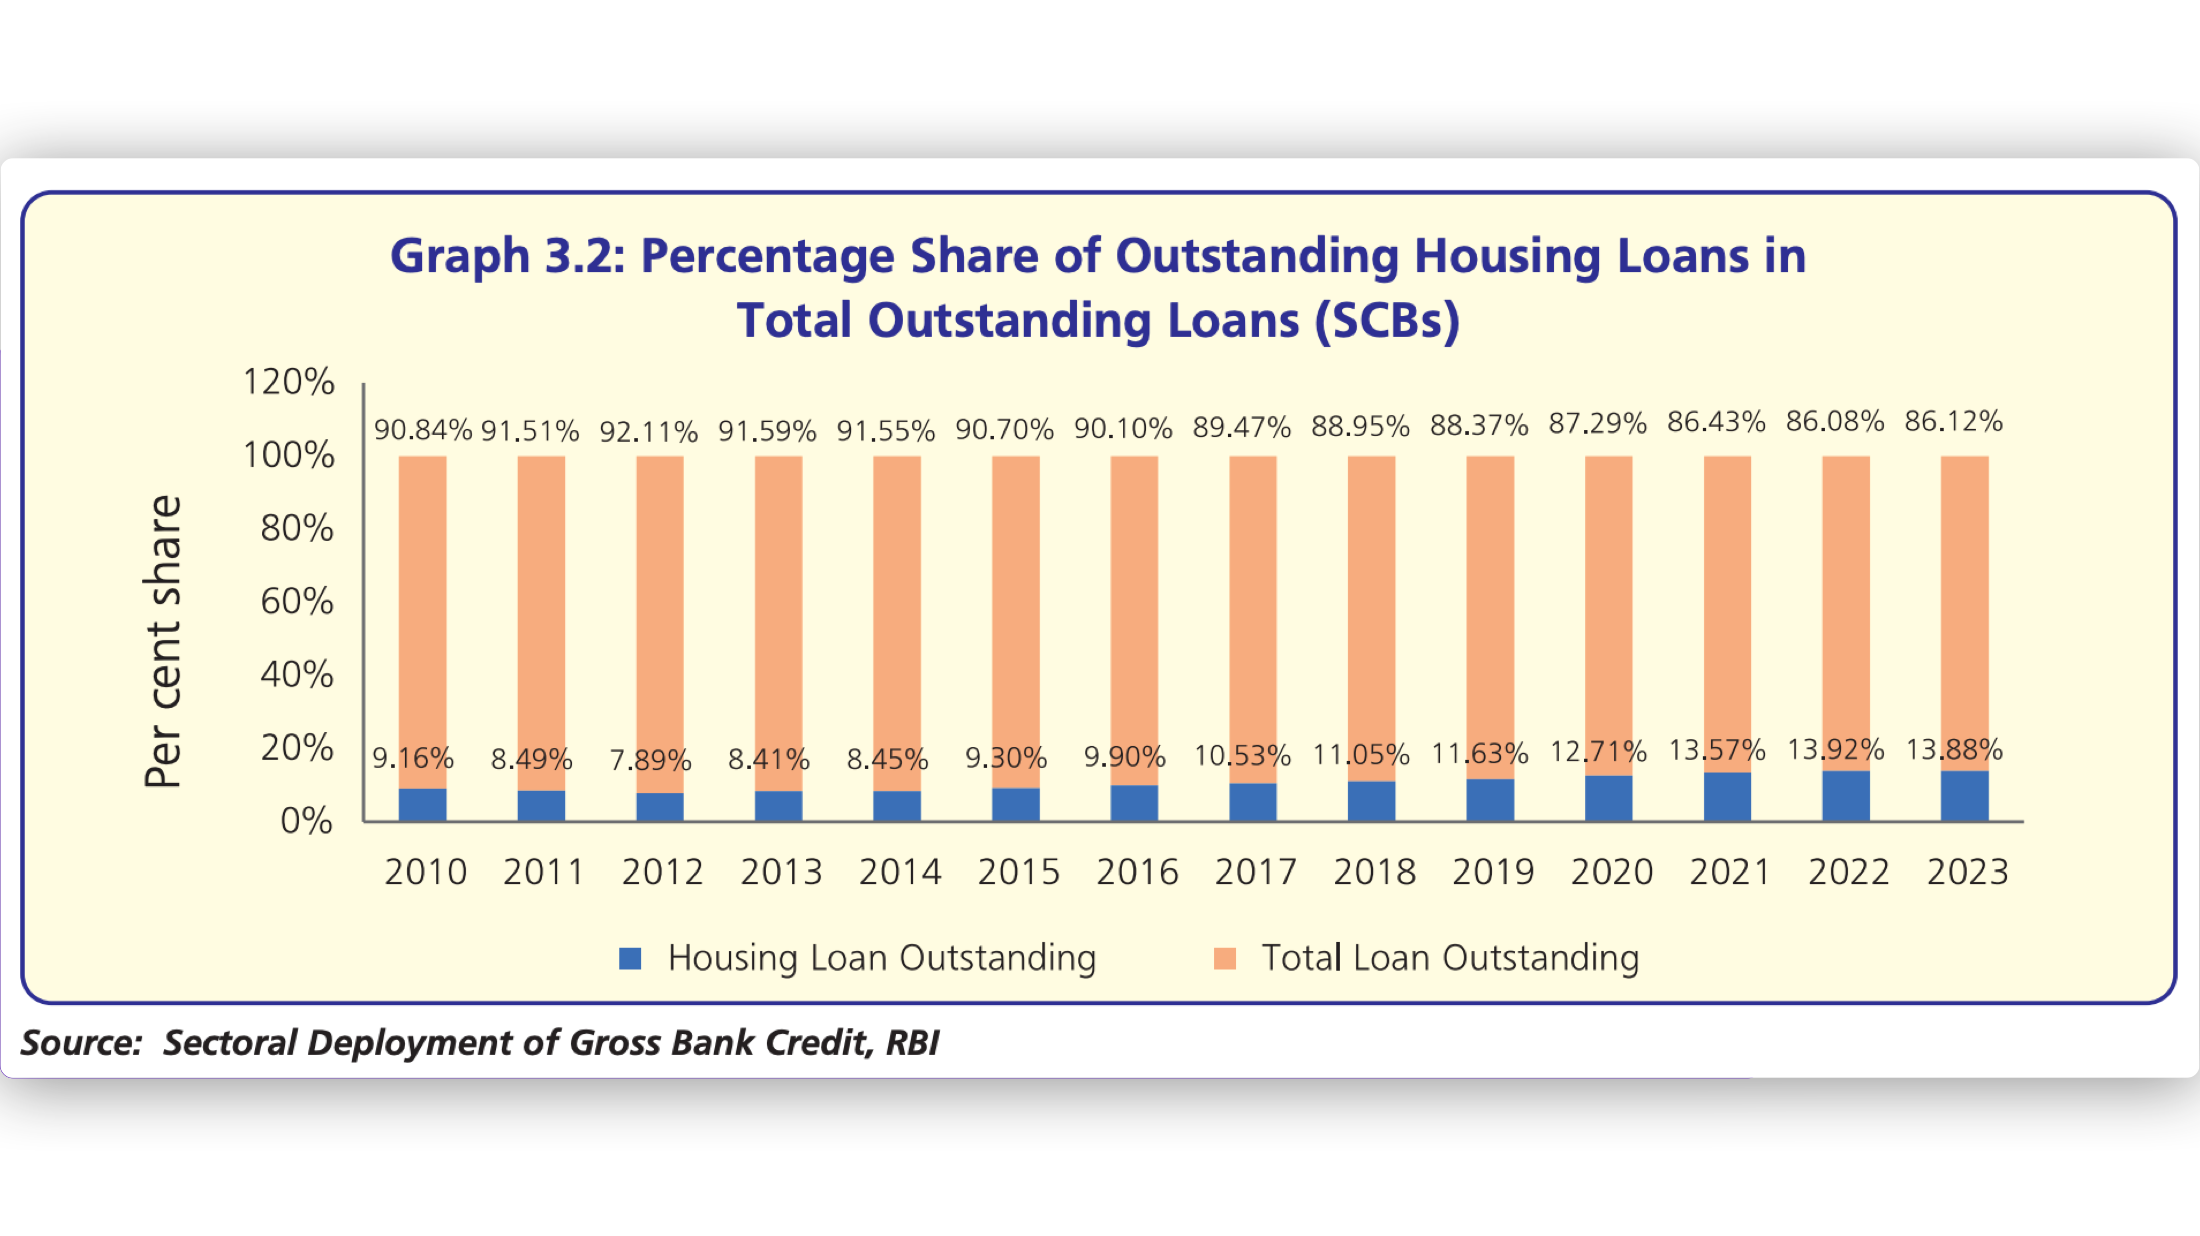
The above trend indicates that Credit directed towards Home loans has increased at a faster rate & more consistently versus the systemic Credit Growth.
That’s great but as the Mortgage to GDP Ratio indicates, we have a long way to Go ![]()
![]() ! AND THAT is the opportunity.
! AND THAT is the opportunity.
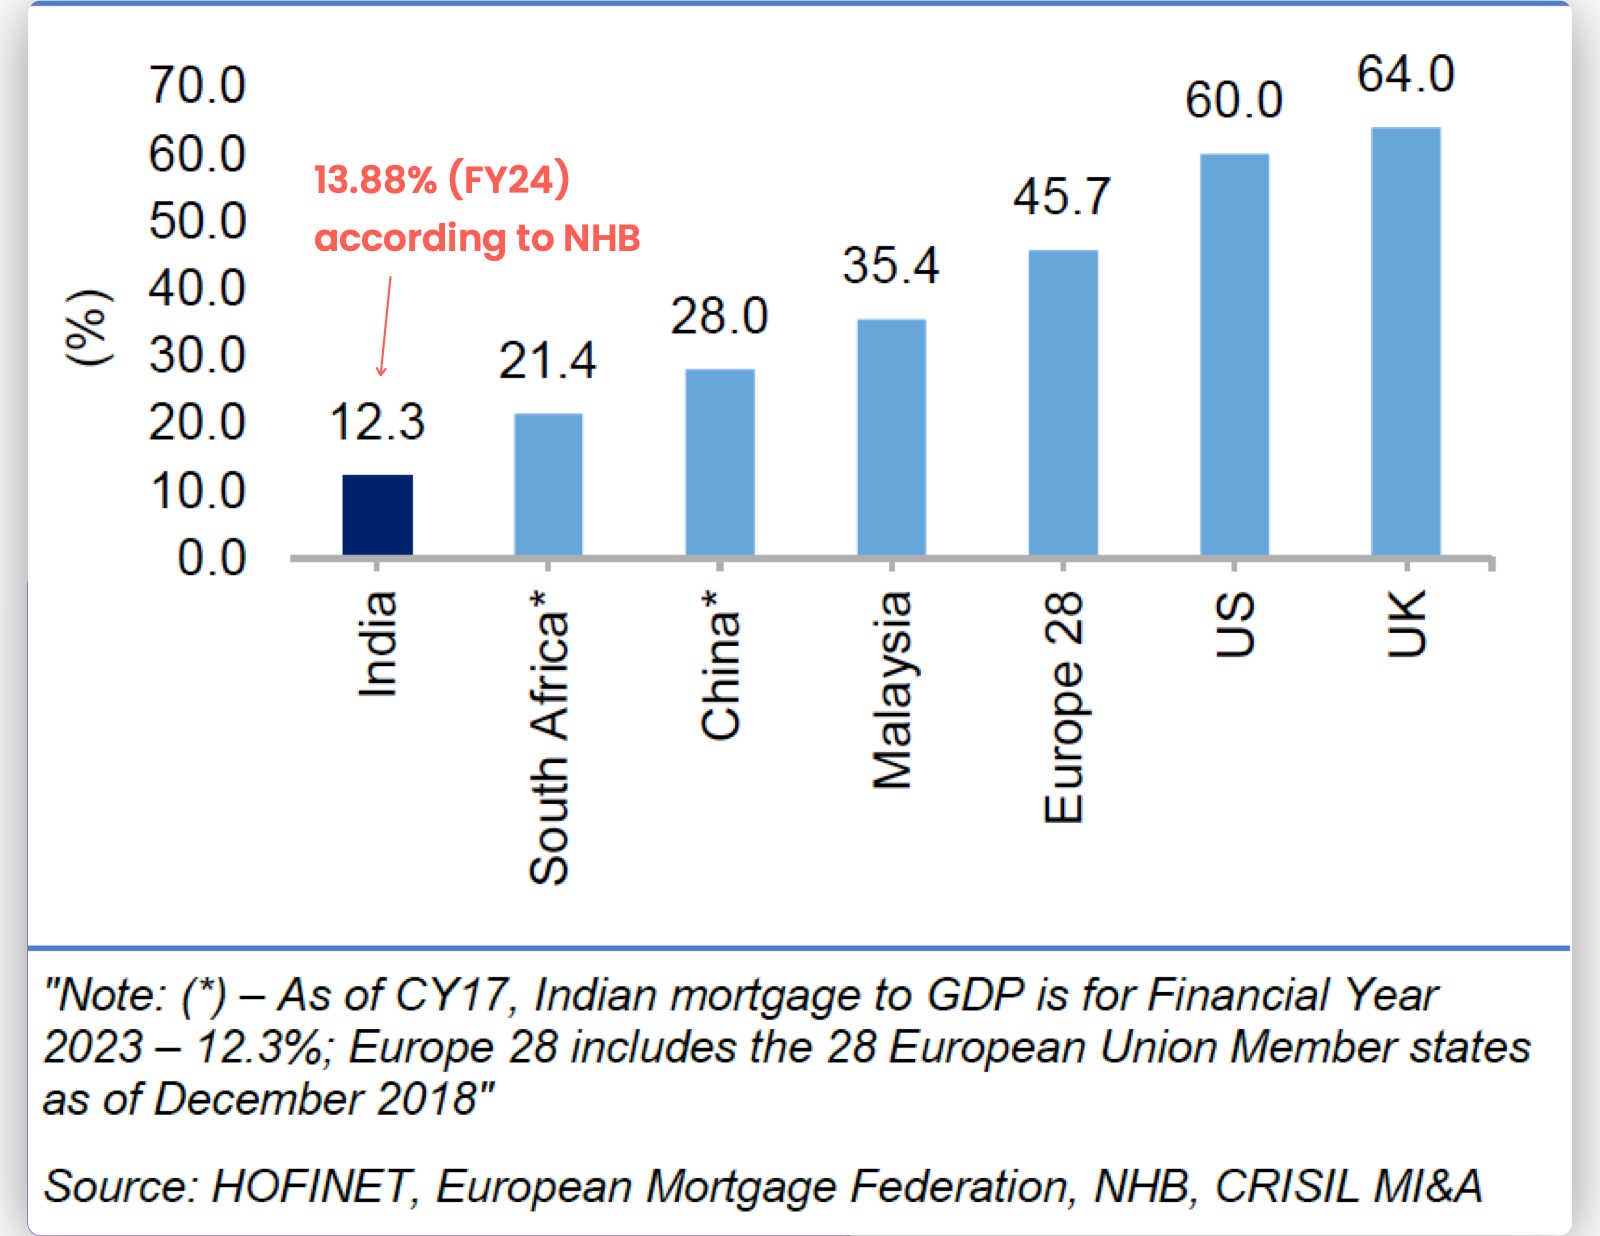
NOTE: Mortgage to GDP Ratio may vary depending source of data and how its been calculated. (12-14% would be a good estimate)
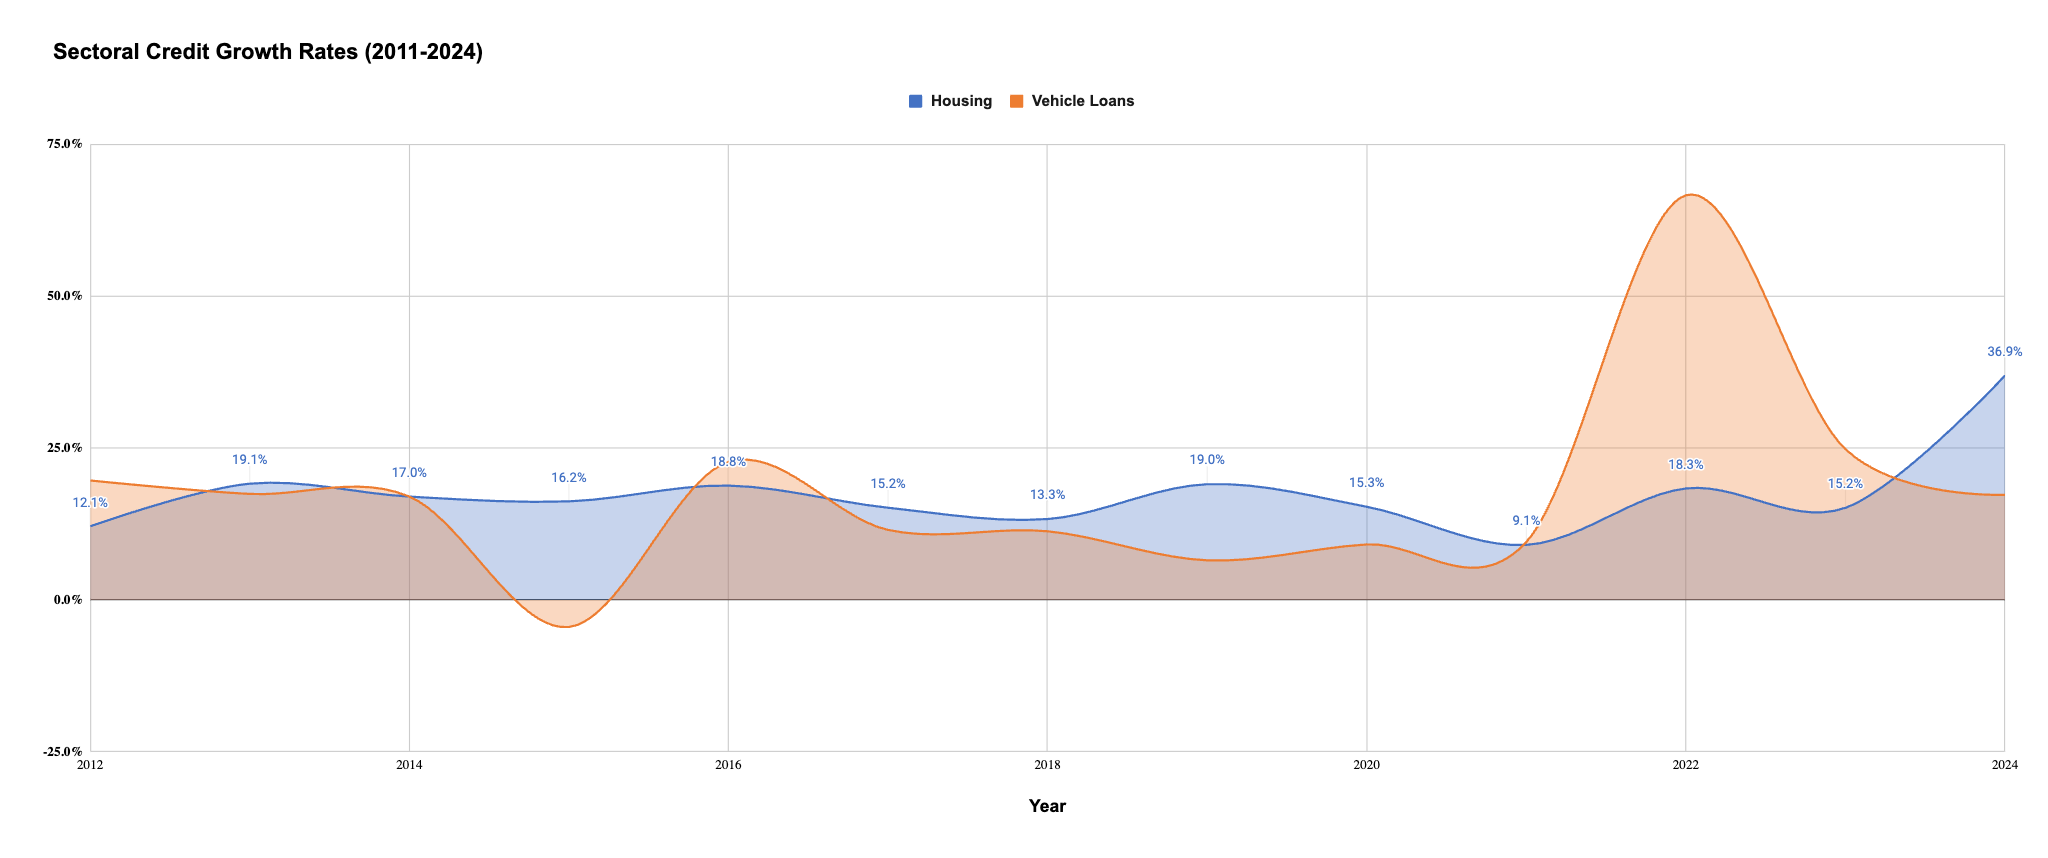
The fact is that Home loans have enjoyed one of the most consistent growth rates (~14%) among all the Major lending segments - Gold, Vehicle, MSME, Industry etc.
Source: RBI | First Principles Investing Research
As of March 2024, Outstanding Home loans stand at 30,48,346 Cr. (30 Lac Cr) and the Growth has been even more robust in FY24 despite higher Interest rates.
so the so-called “Runway for Growth” is well-paved and well-lit for take-off.
The Question is who (Banks/NBFCs/HFCs) is going to benefit the most from this trend?!
To Learn more, Let’s introduce the Players of the Game.
- The Playing Field :
There are 2 major players in the Housing Finance Market - Banks & Housing Finance Companies (HFCs) and their share has fluctuated widely since 1986 ![]()
![]()
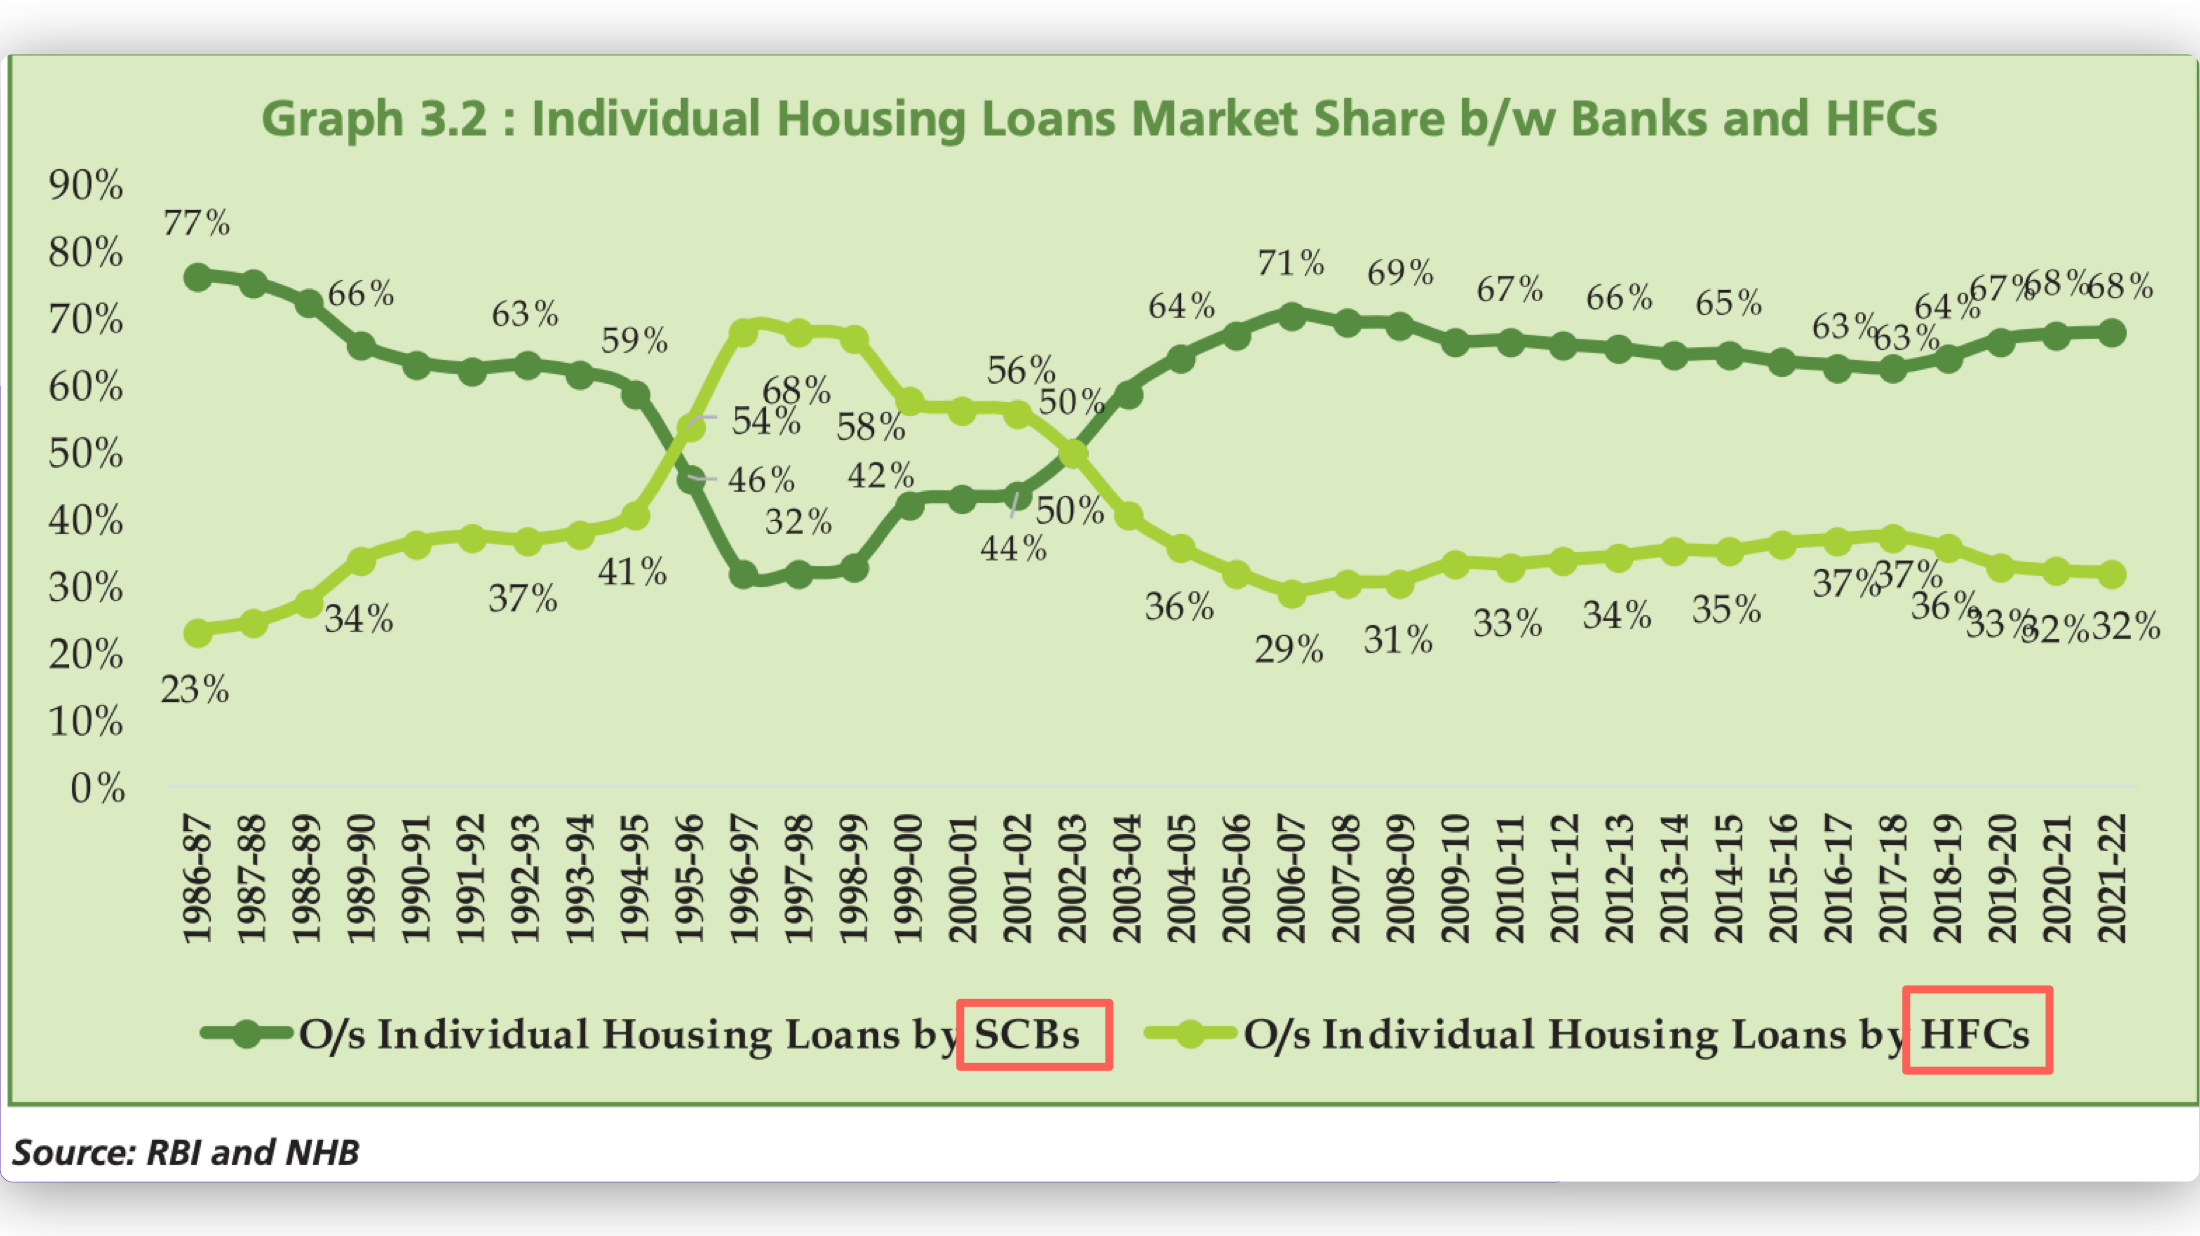
HFC Market share peaked in 2017-18’ at 37% and has been falling consistently down to ~32-33% as of 2024 (Not shown in the Graph below)
Why?
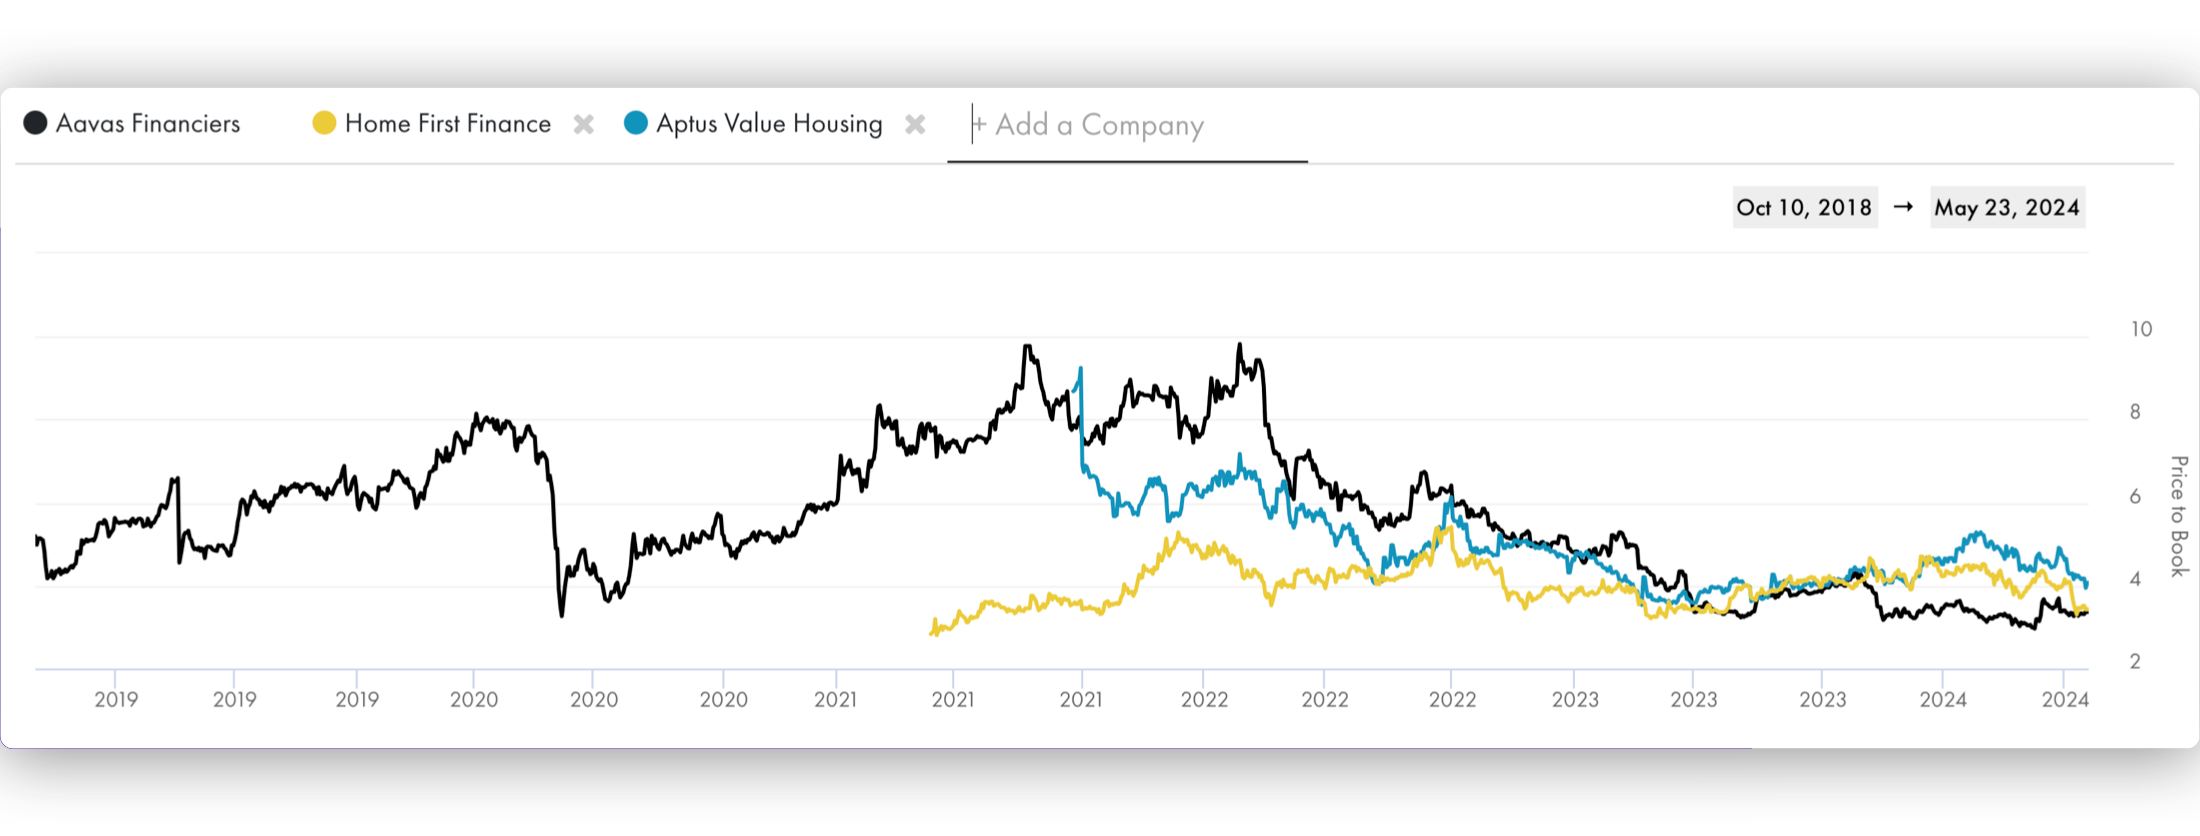
If you remember, back in 2017-18’ HFCs - HFCs were all the rage, precisely because they were growing fast! (Notice the P/Bx expansion ~2018 ![]() )
)
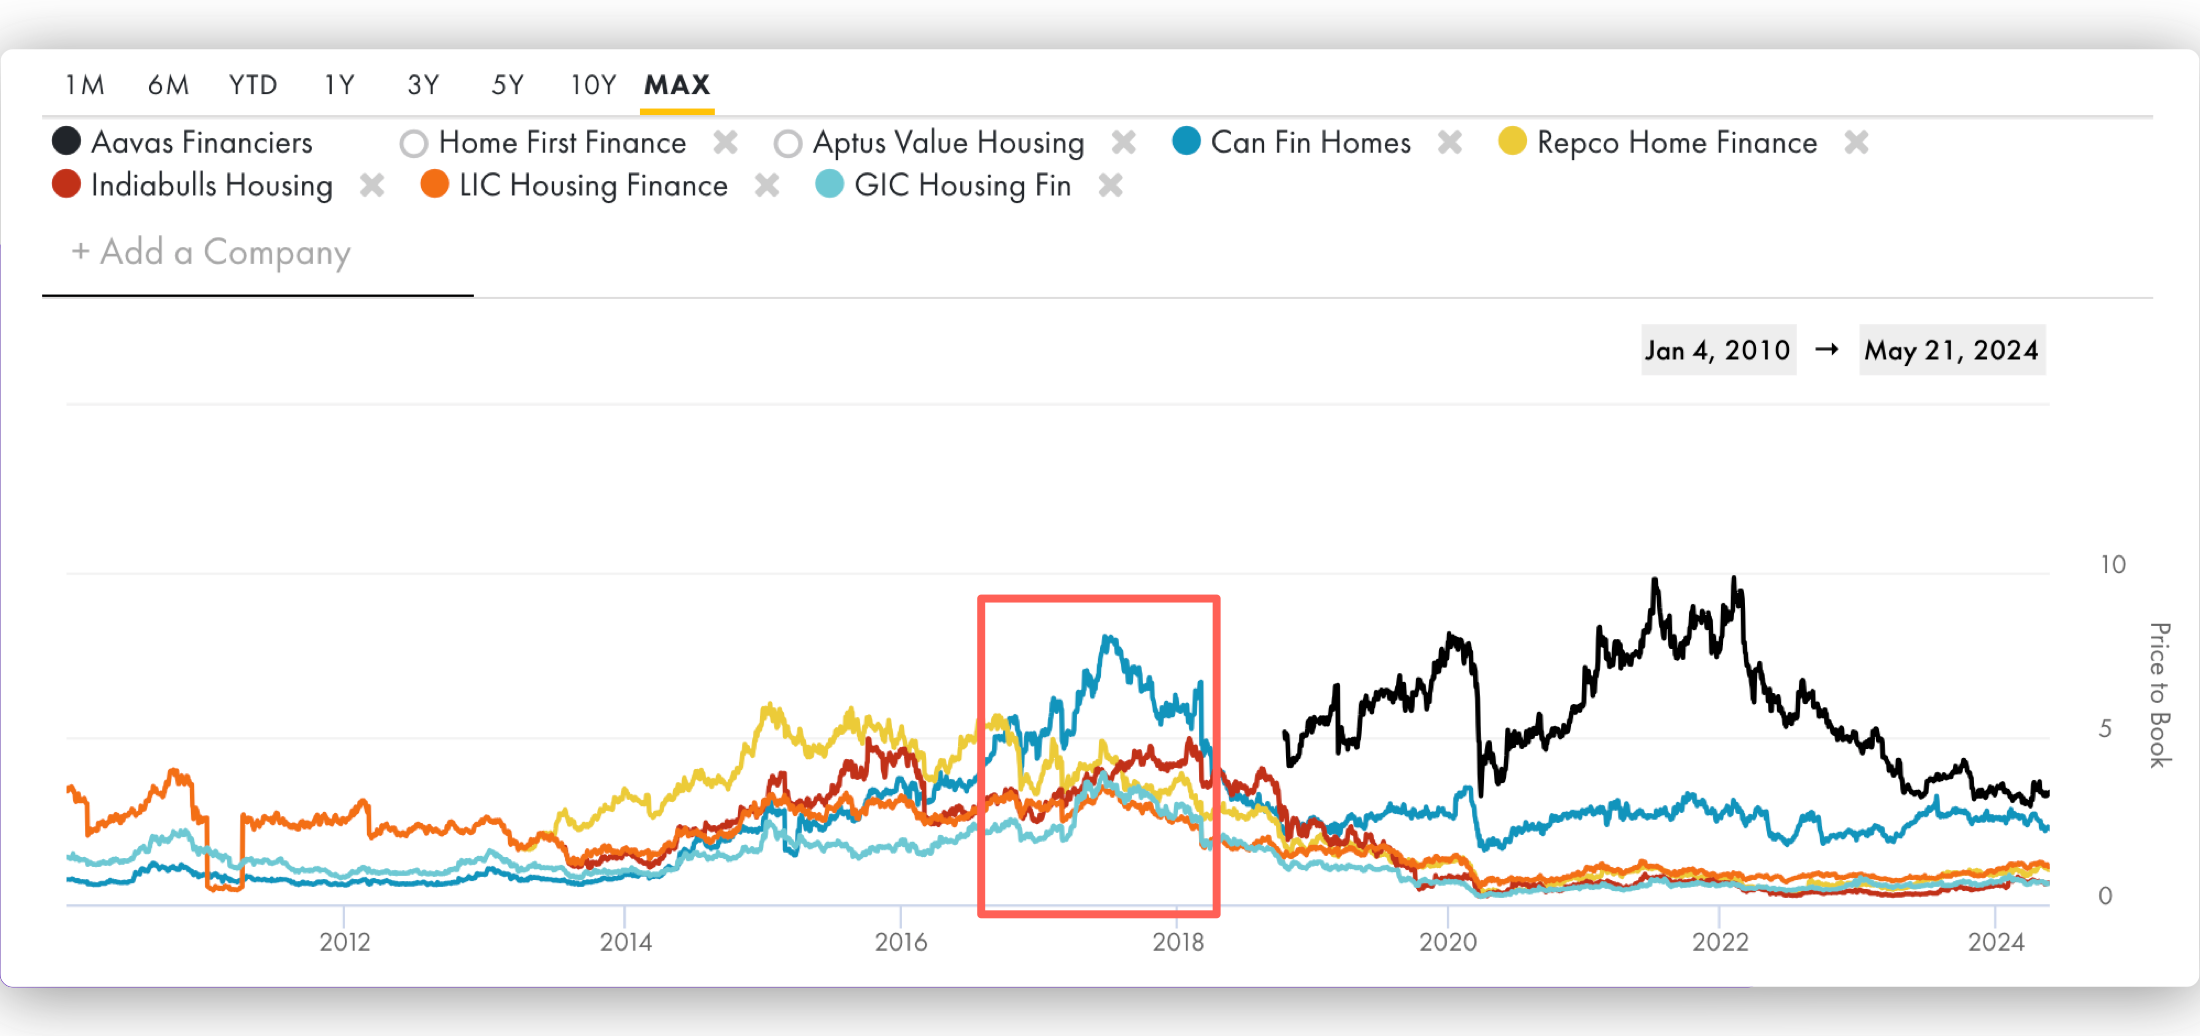
Source: Price to Book Value | Tijori Finance | First Principles Investing
In a period when the overall Banking System was suffering from unresolved NPAs, HFCs provided the comfort of Low NPAs, high growth and high ROEs. A combination that the ‘market’ rewarded with steep Valuations.
Then we had an oops moment with IL&FS, following which DHFL fraud was revealed. Seeing such large-scale failures, the Government handed over the regulatory powers for Housing Finance companies to RBI which were previously with NHB - National Housing Bank.
RBI felt that Banks were better suited for satisfying India’s housing aspiration.
After all, with lower cost of funds and increasing reach , Banks offer(ed) a better value proposition to most home buyers.
It also made changes to NPA classification norms which negatively impacted most HFCs, resulting in higher NPA!
But there’s another nuance to the housing loan market**,** which demarcates the territory Banks can dominate within the Housing loan market versus where they do not.
Enter : ![]() The Ticket Size:gun:
The Ticket Size:gun:
Growth in an HFCs/Banks portfolio is a function of Volume & Value
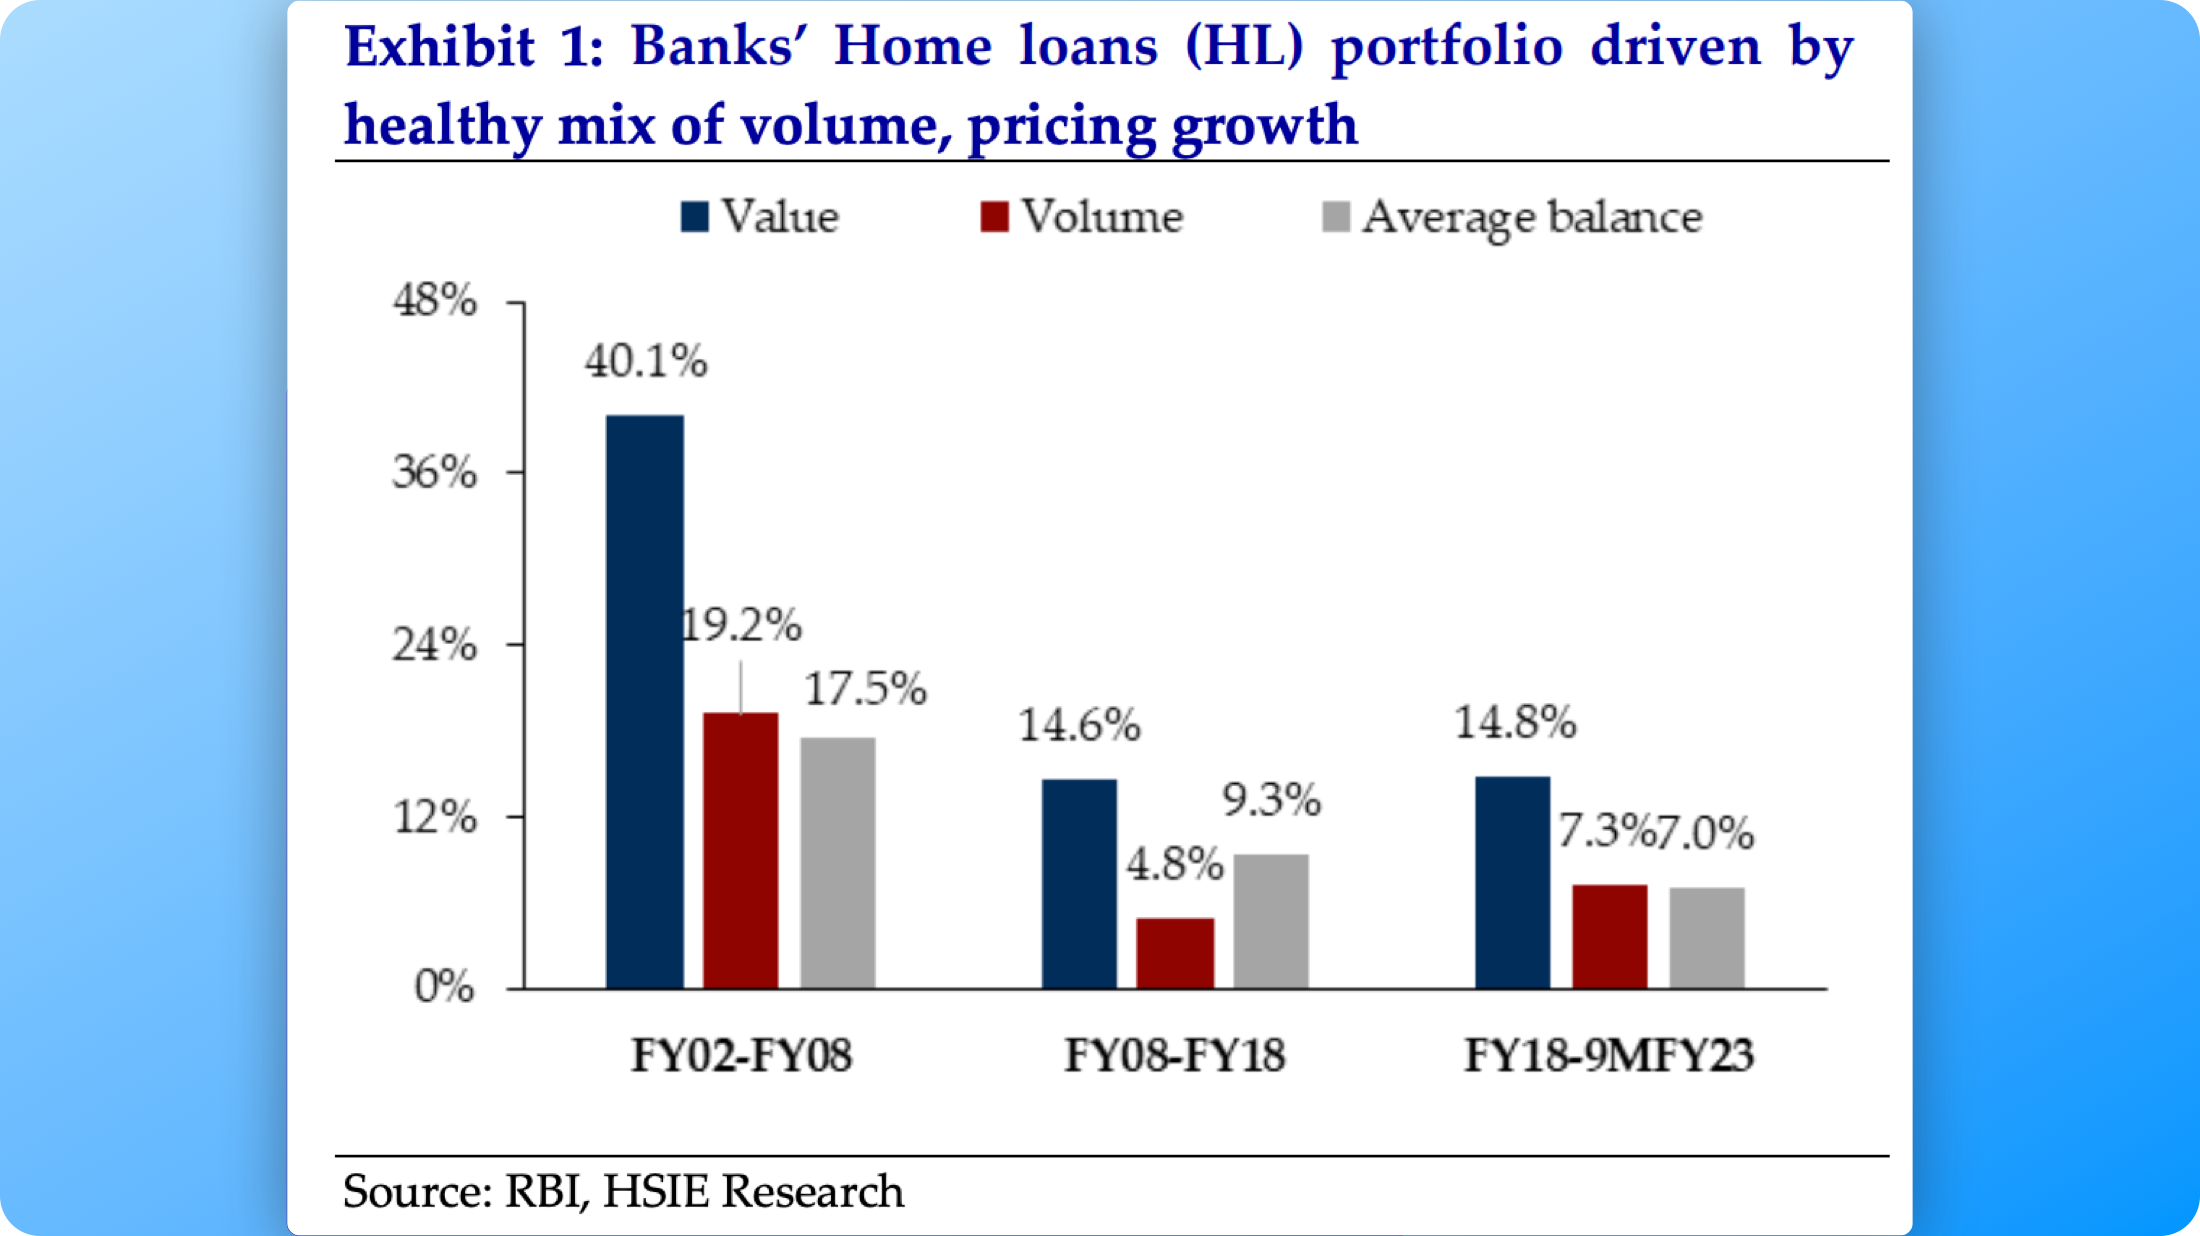
NOTE: The above data pertains to only Banks.
Volume is simply the number of loans disbursed and Value is the Avg. Ticket Size (ATS)
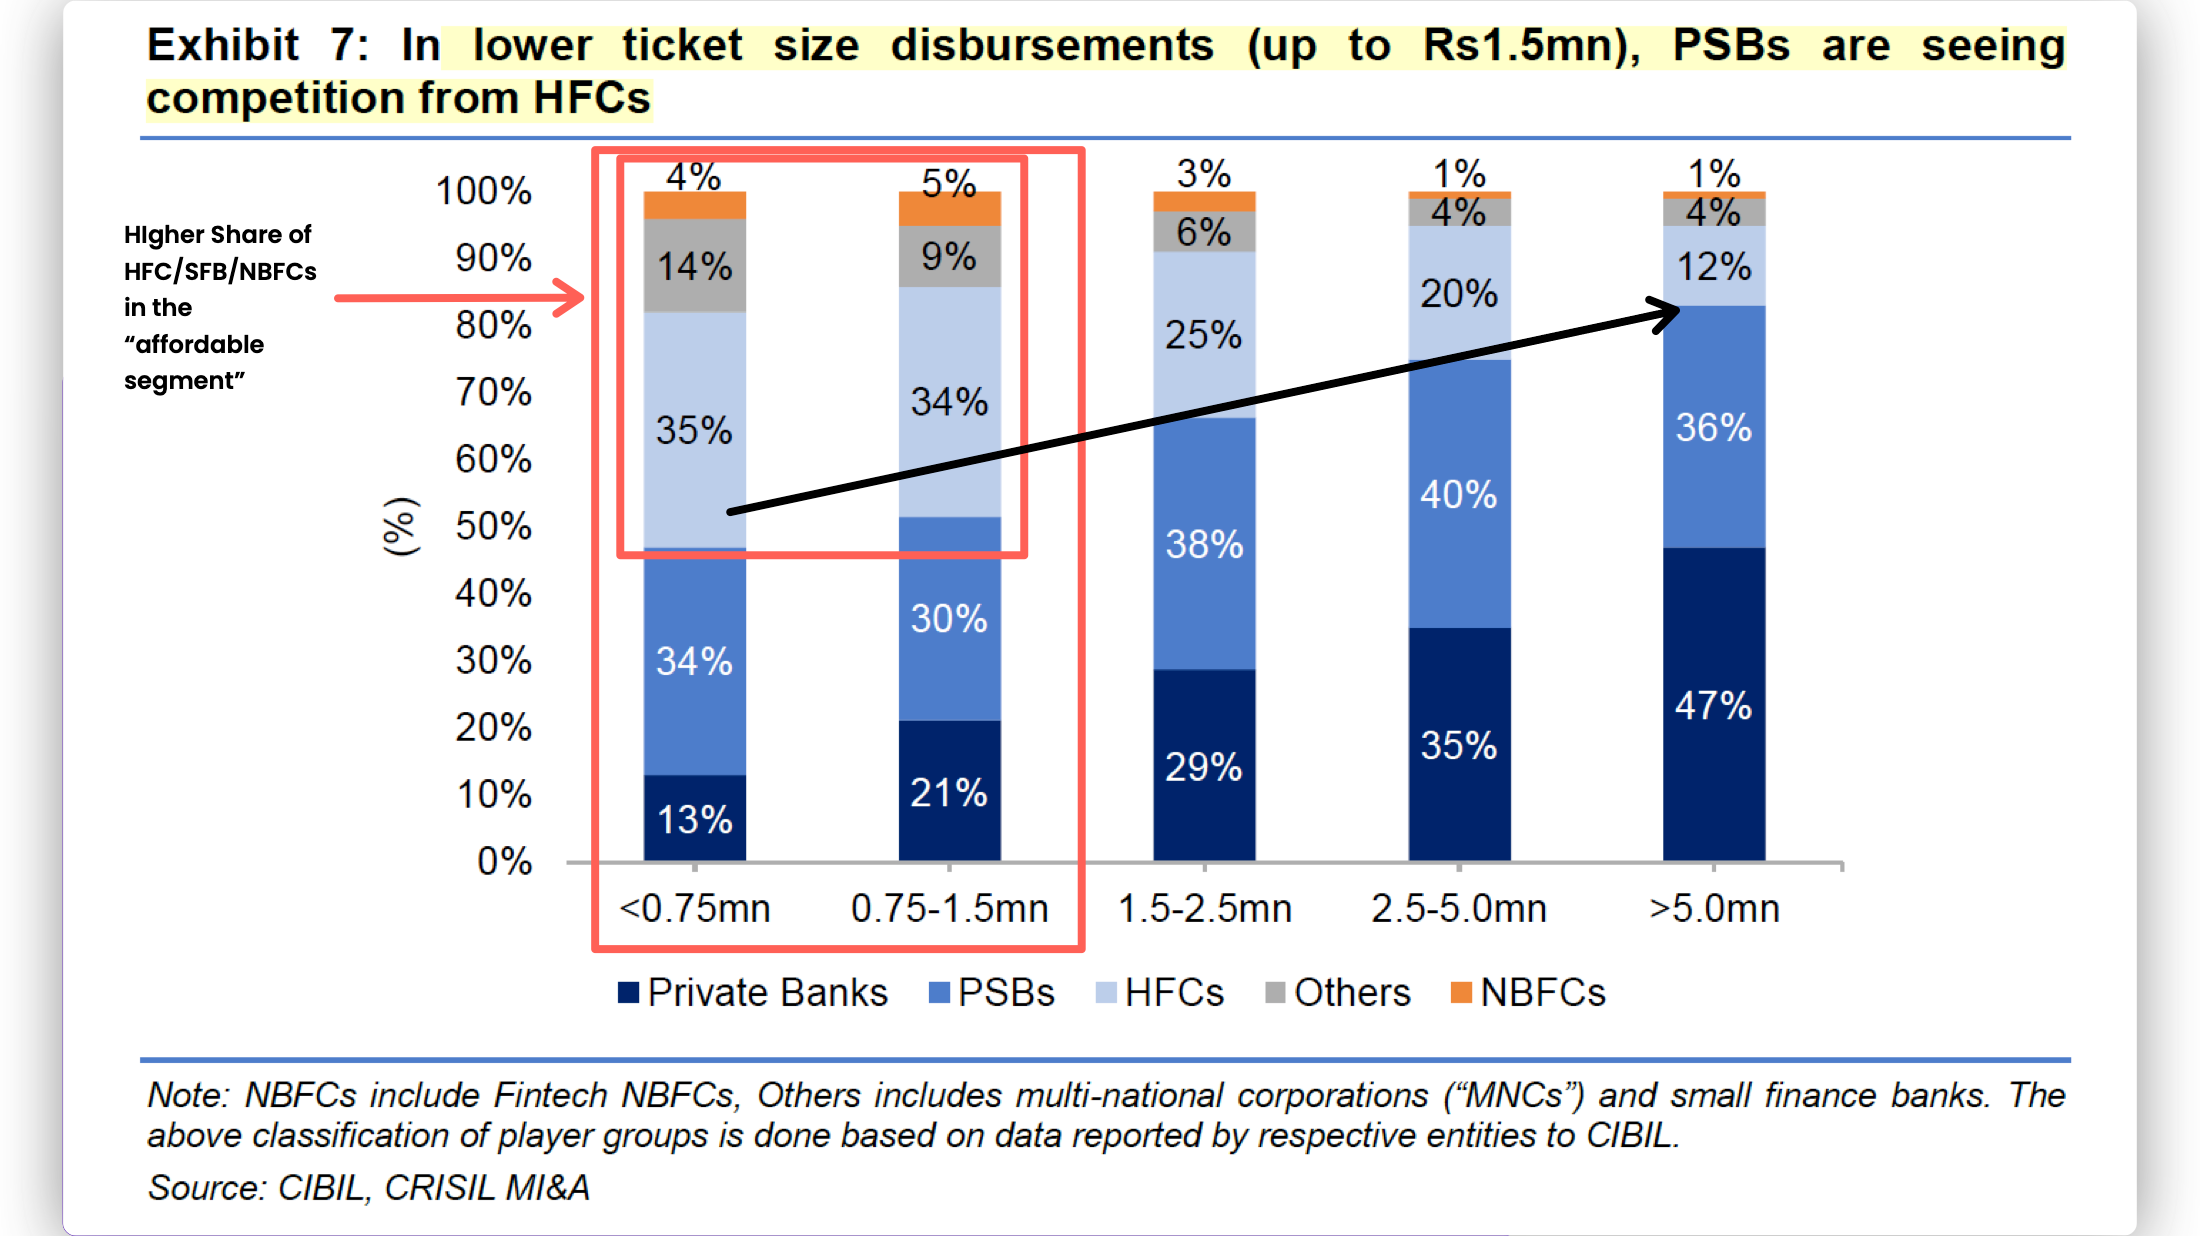
Not surprisingly, the volume of lower-ticket Home loans is higher but in value terms, it is much lower.
For Example, In FY23, around 42% of the loans disbursed (in numbers) were under 15 Lacs but in value terms, they consisted of only 15%.
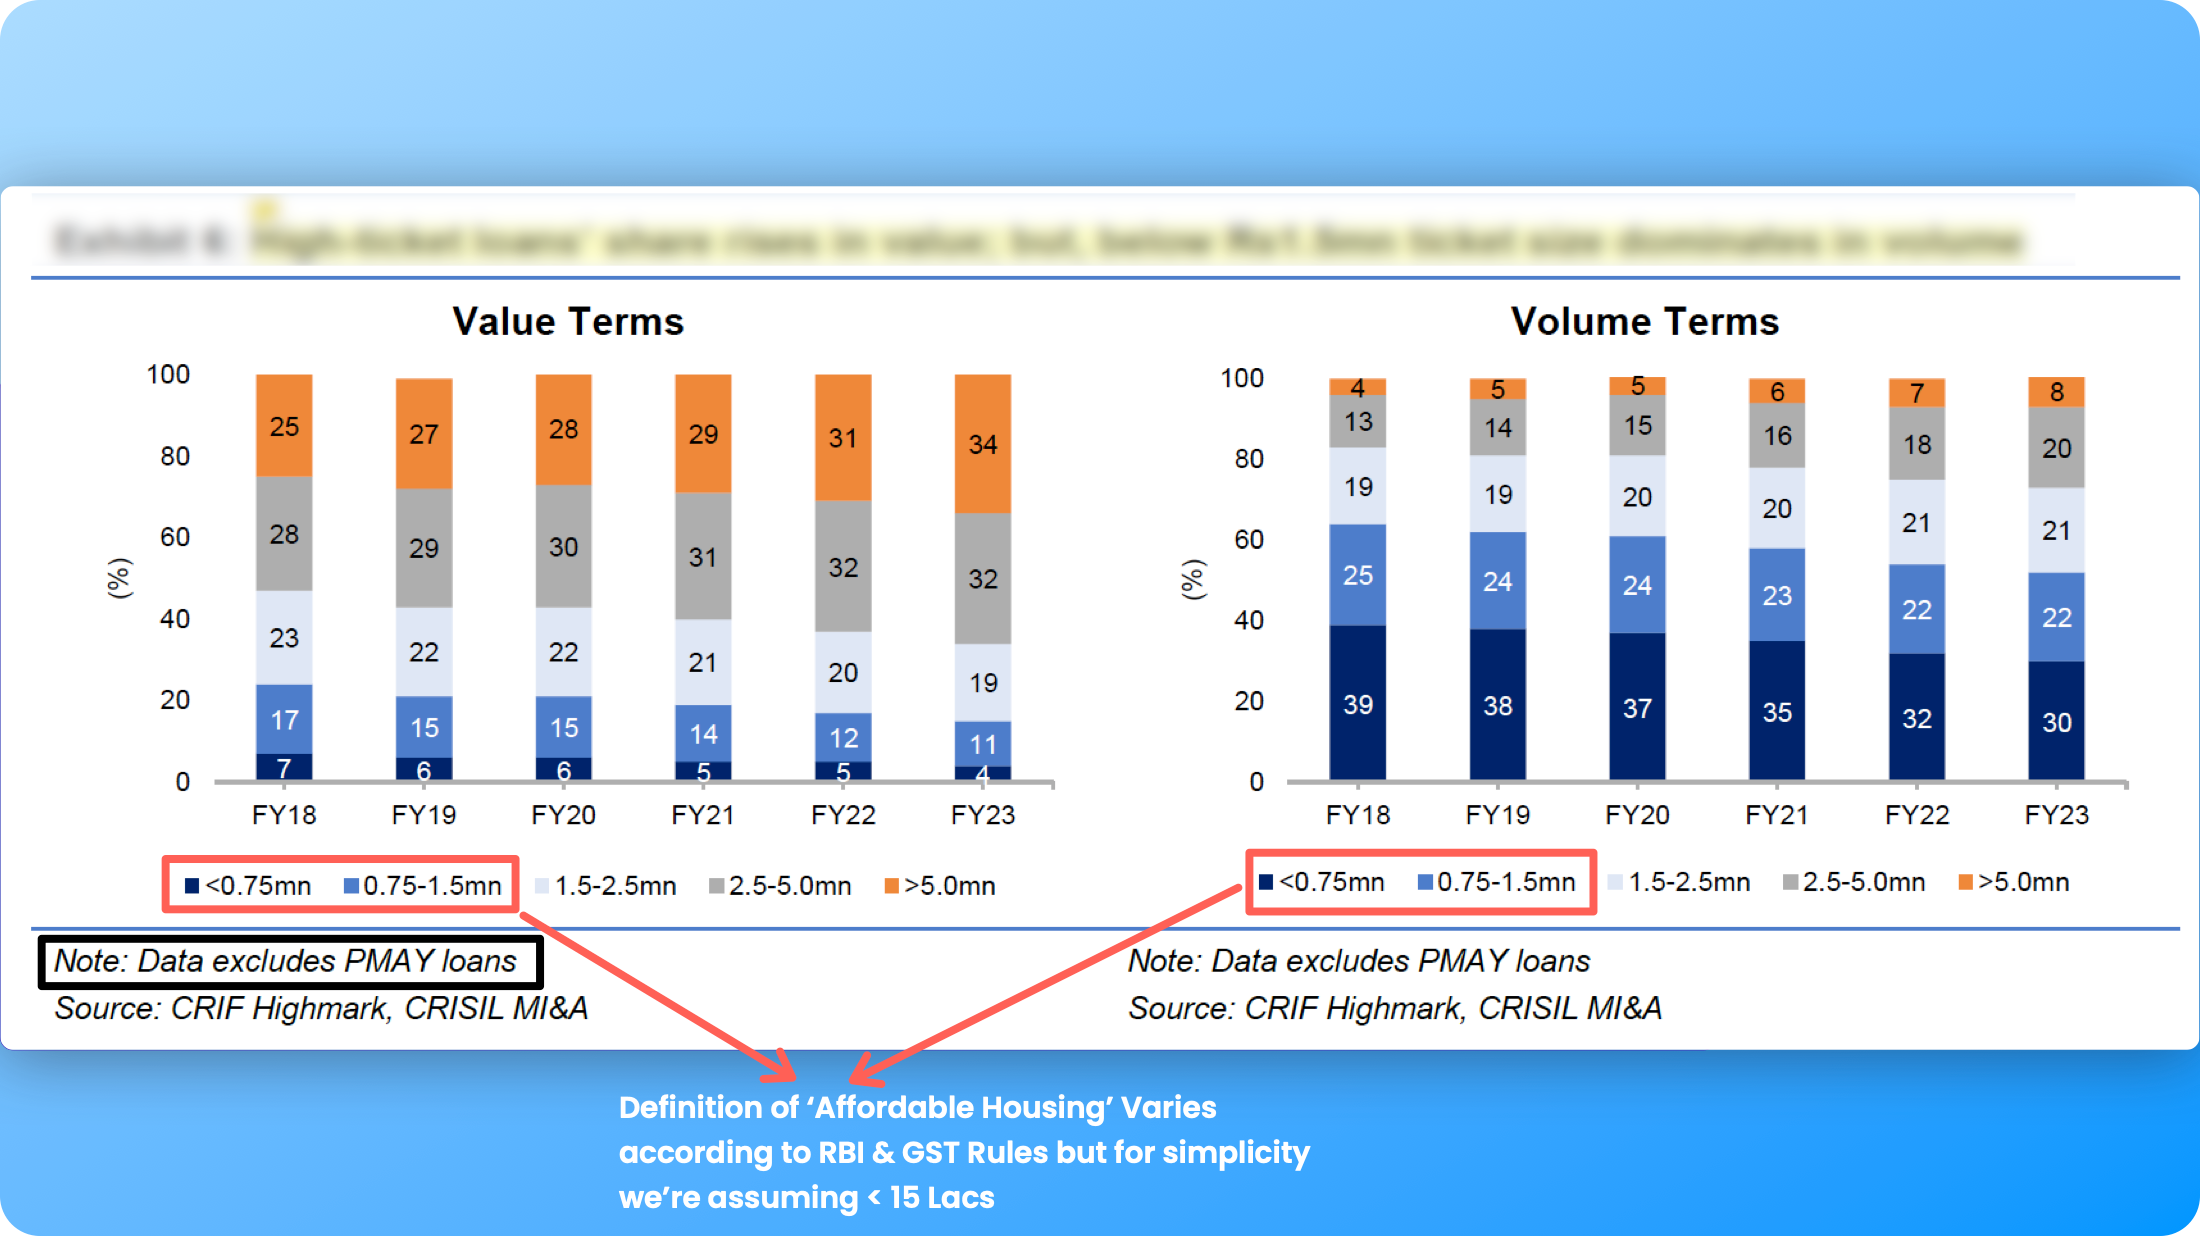
And not surprisingly, While Banks are dominant in the higher value / lower volume segment, Affordable HFCs dominate the “affordable housing” segment.
This is a result of a peculiar problem HFCs face.
Although the “TAM” in the Housing Loan market is large, HFC growth is constrained by this ‘Glass ceiling’ set by ATS.
To Grow they must (or have to) grow their ATS but if their ATS becomes large enough, banks are waiting to eat their lunch (Remember: Banks can offer lower interest rates)

Even HFCs can be further segmented as Larger HFCs and Smaller ones - Affordable HFCs.
Sandwiched between the Banks & Affordable HFCs, are the Larger HFCs , which are getting sliced by Banks on the Top End and by AHFCs on the bottom end.
That’s precisely why you’ll notice that while Home Loans continue to grow at a robust pace, Larger HFCs growth has moderated (CanFin, Indiabulls, LIC Housing, PNB Housing Finance).
This is NOT the only reason for Slower growth experienced by Larger HFCs. In some cases, Fraud and Gross Mismanagement is another .
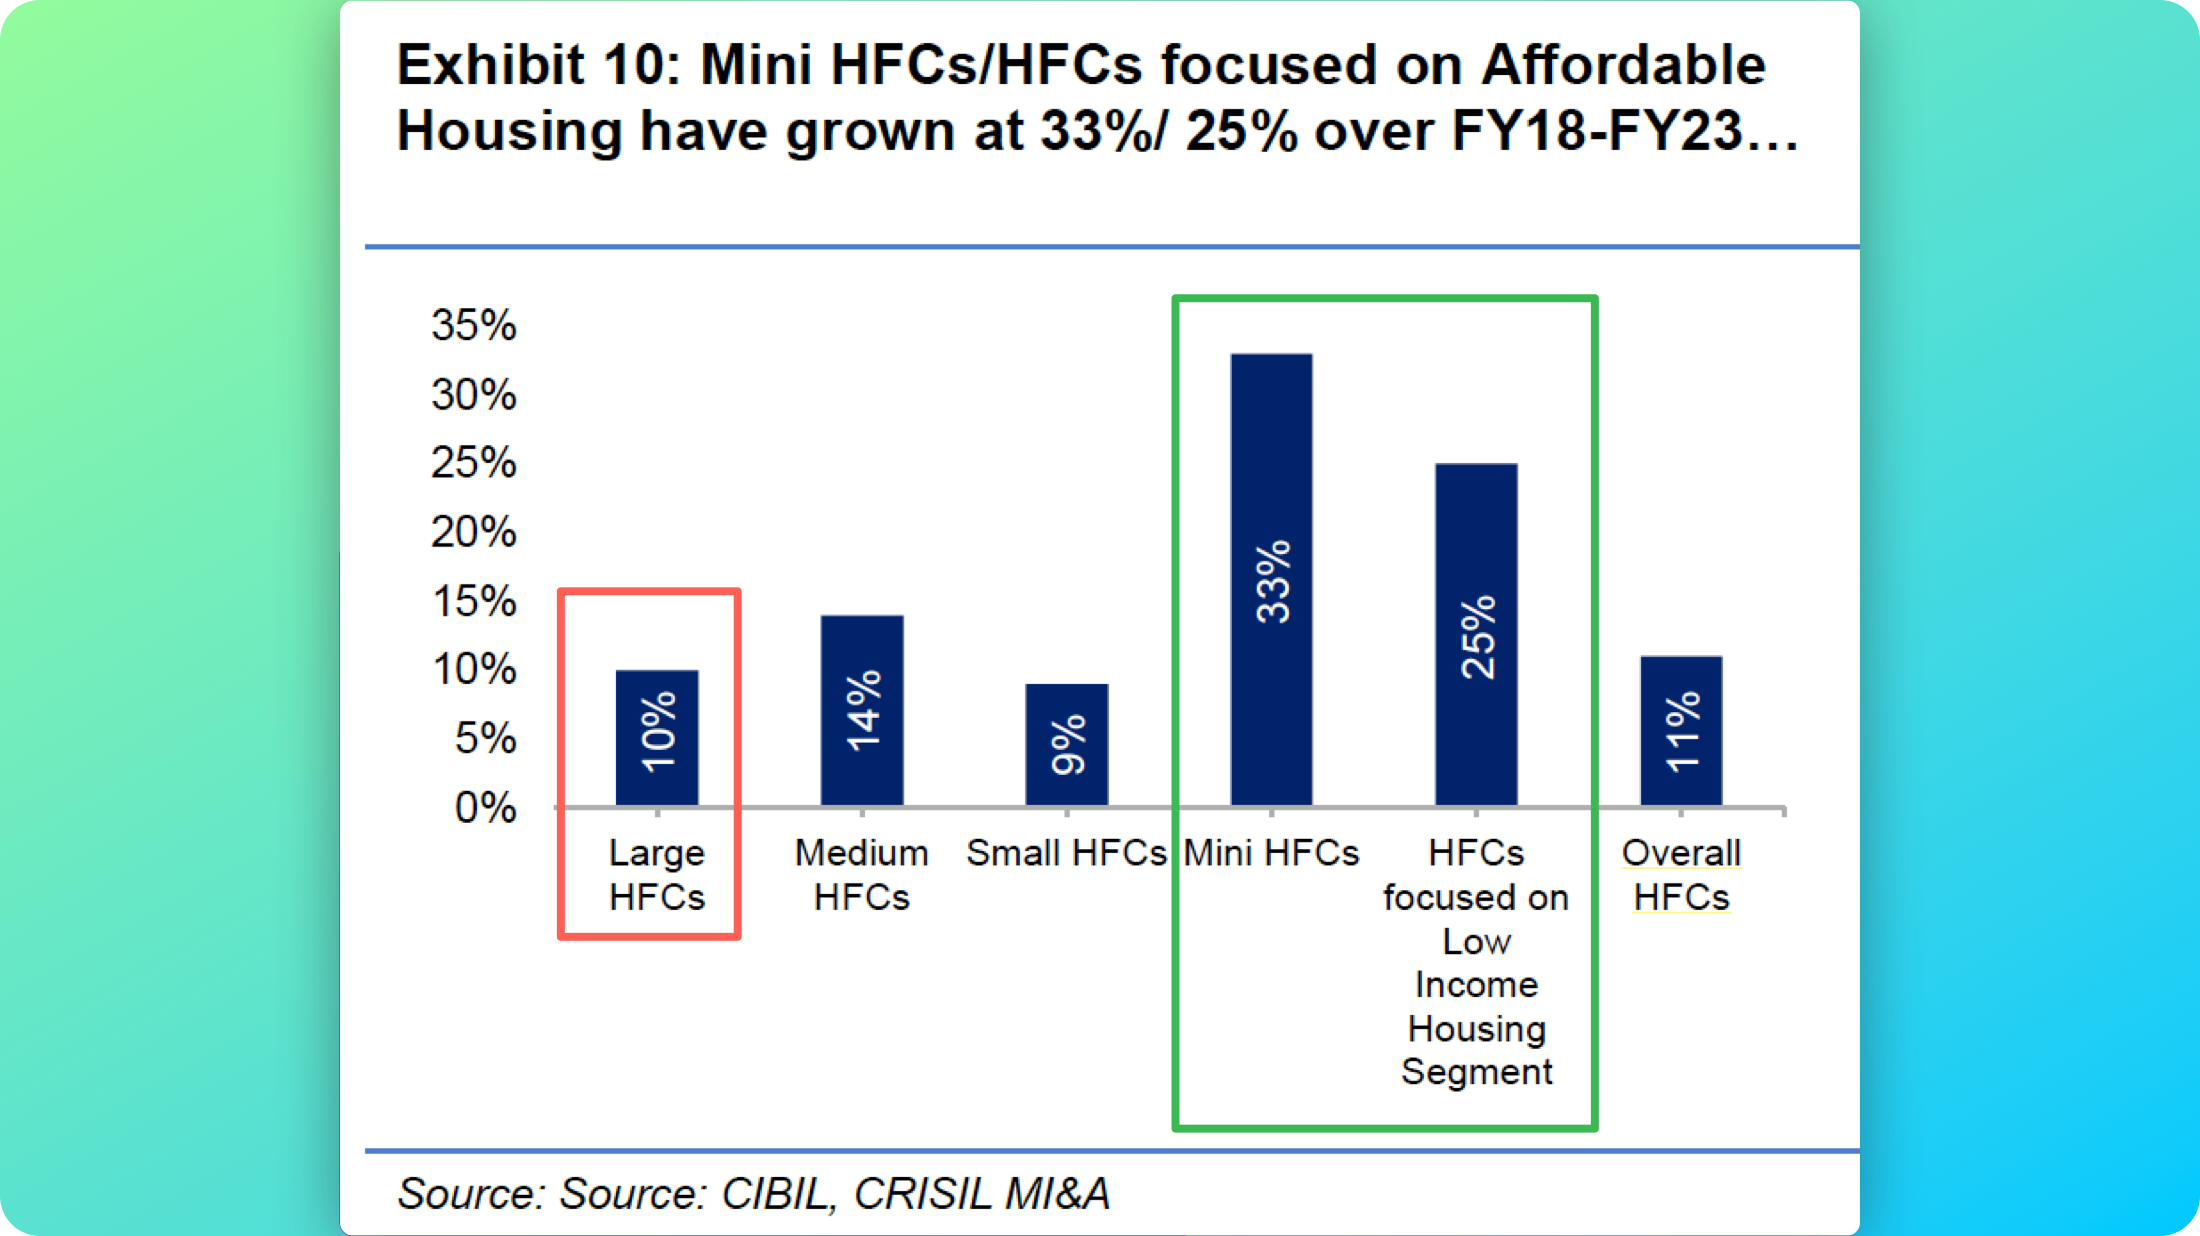
Amidst all this fighting for a place in India’s robust Home Loan Market, Smaller HFCs i.e - those focusing on ‘Affordable housing’ have emerged as a source of high growth albeit with higher risk (we’ll learn more soon)
But I do NOT discriminate based on Size! And that’s why with the above context we’re going to do a quantitative analysis of 15 Listed players in the Indian Home Loan Market.
A Quantitive Analysis of 15 Listed Housing Finance Companies in India
First, let me introduce the contenders :
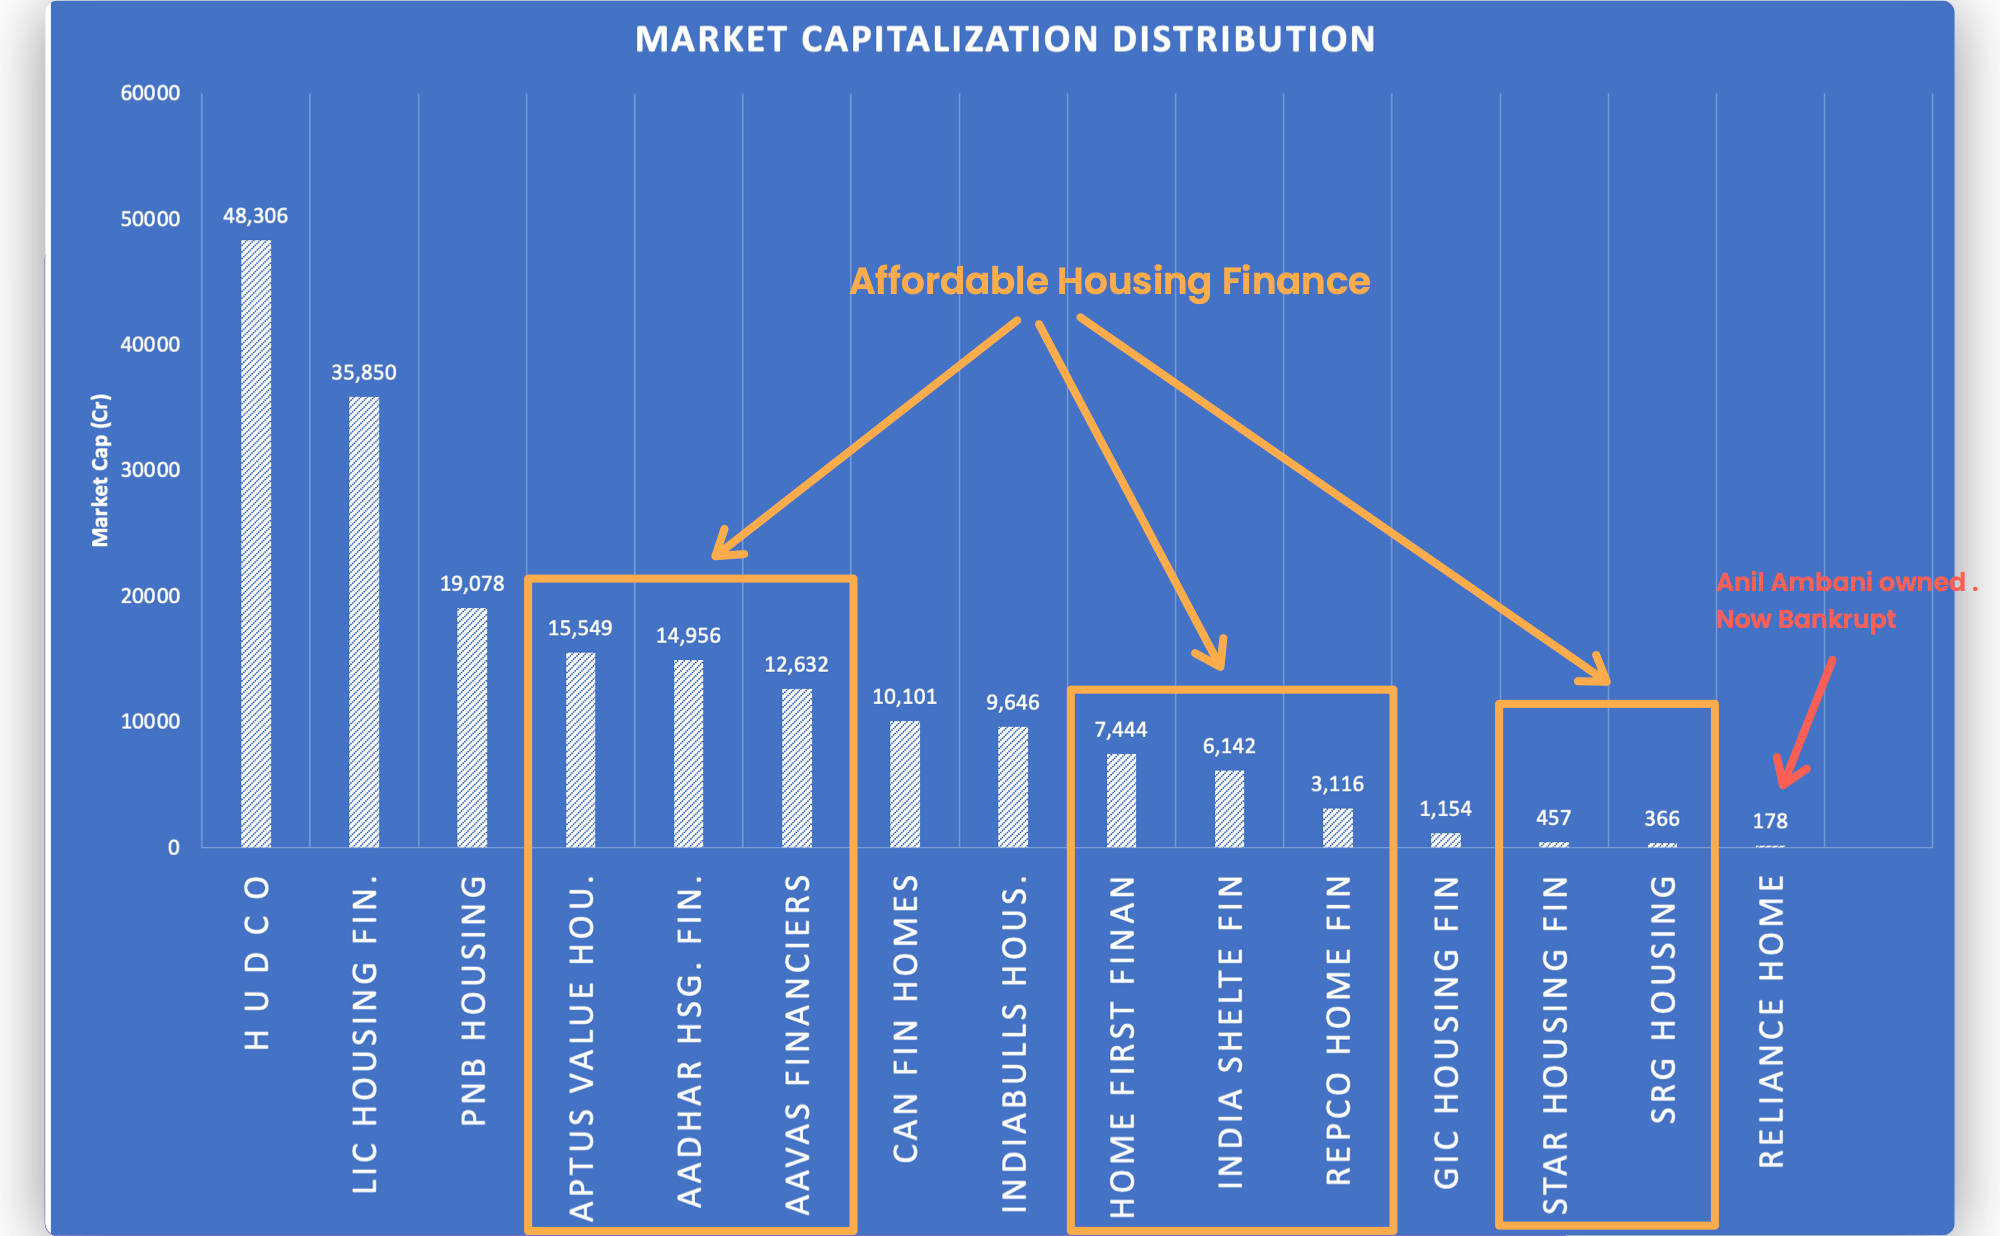
Of the 15 HFCs shown above, 8 operate in the Affordable HL segment , out of which Aadhar Housing Finance and India Shelter Finance are recently listed.
And the remaining are larger players as measured by ATS - Avg. Ticket Size.
Next, let’s see how they have fared across cycles in terms of Asset Quality.
- Gross Non-Performing Assets (%)
While it is true that Housing and Gold are possibly the safest lending segments given the presence of valuable collateral, and that Write-offs (actual losses) are a very small percentage of GNPA, the market ascribes valuation multiples (P/Bx) based on the lenders’ ability to maintain Good asset Quality (amongst other factors such as Growth & ROE)
“Good” is defined by what the best players can achieve “over cycles”
We can broadly categorise the Listed HFCs in our pool into 3 NPA buckets as shown below.
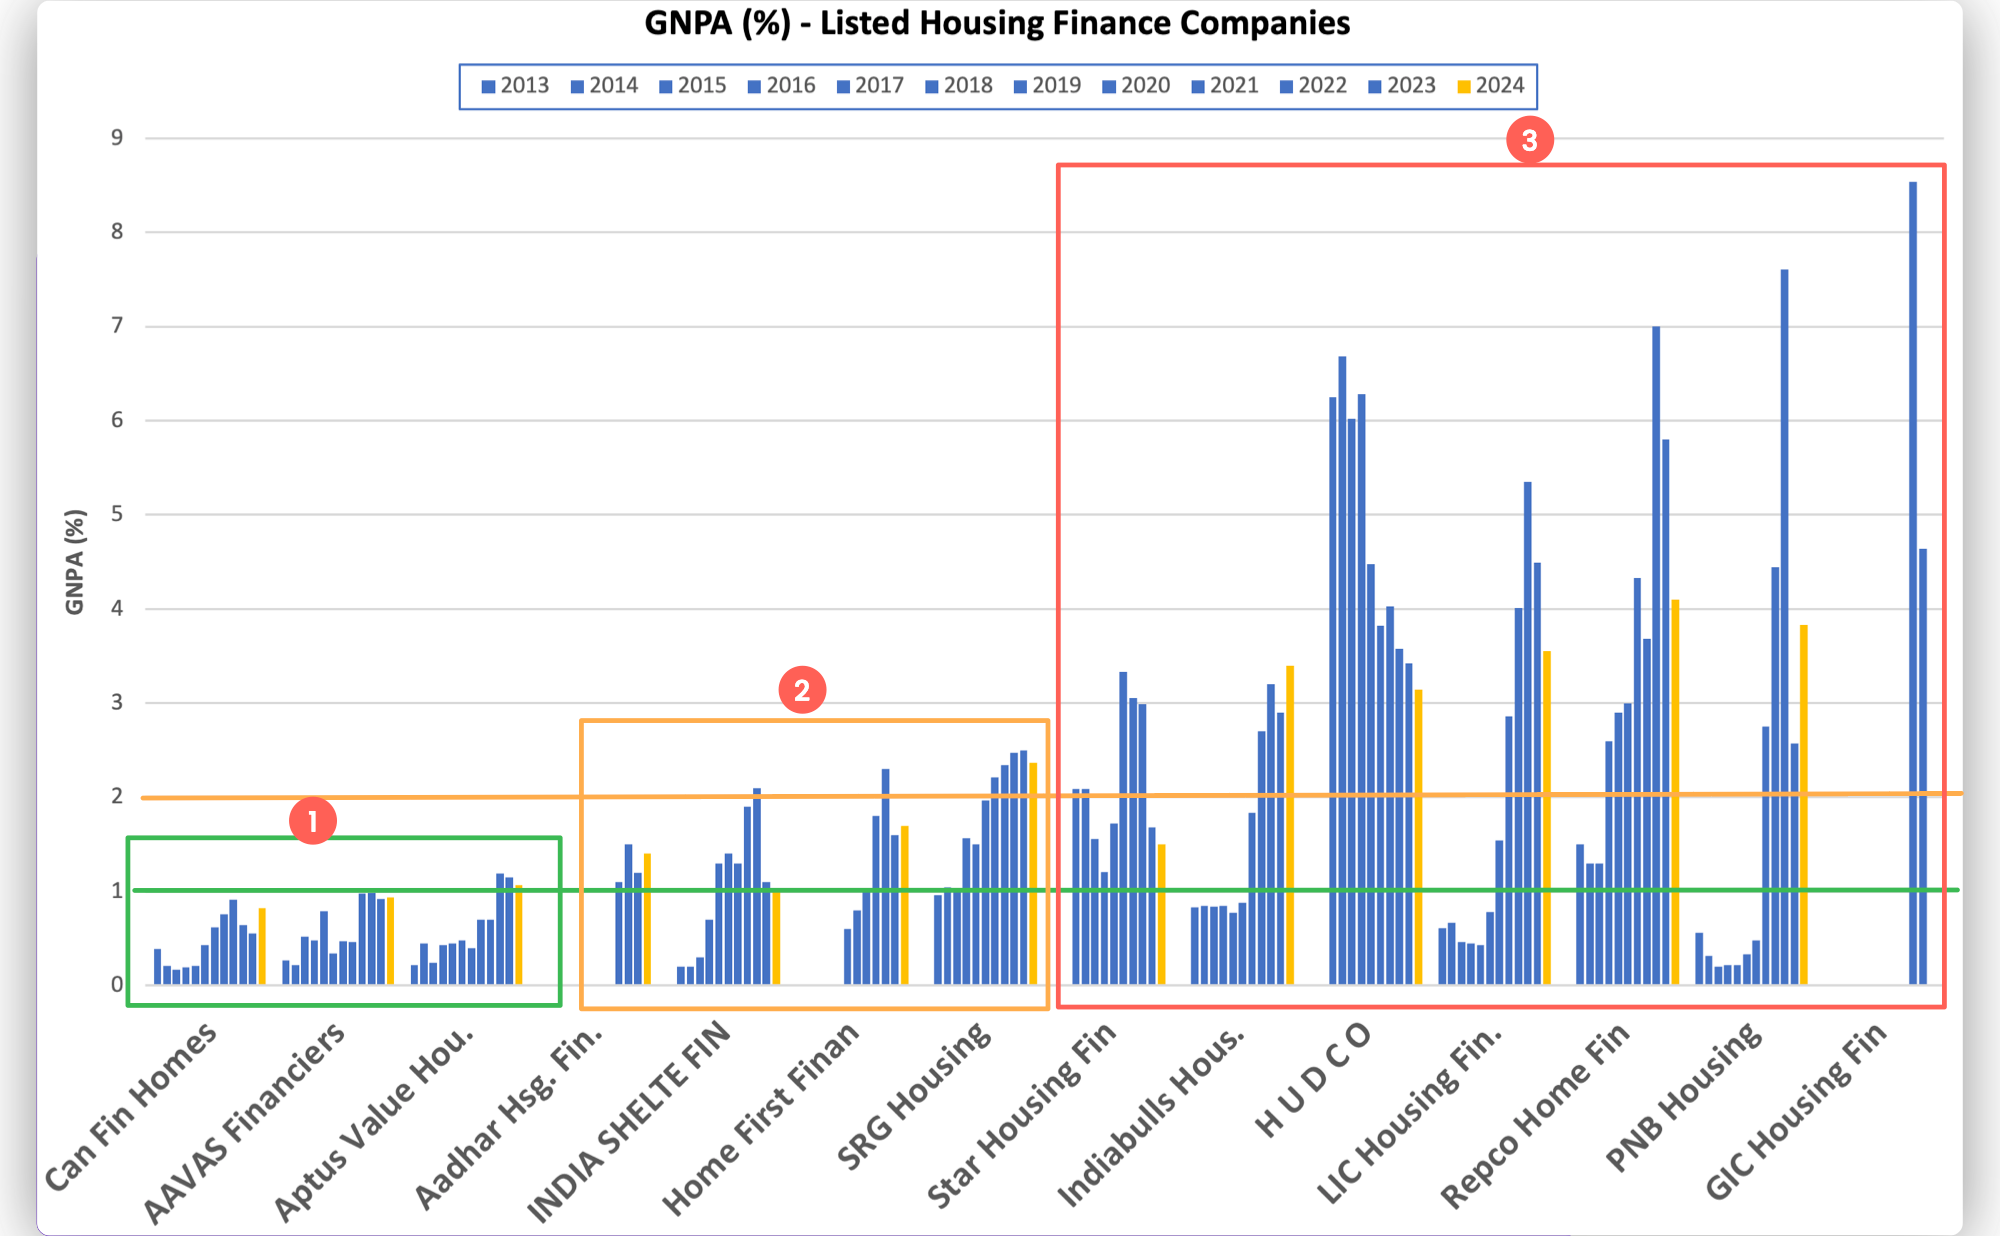
The A Players consist of - Can Fin, Aavas Financiers, and Aptus
The B Players - Aadhar, India Shelter finance, Home First & SRG Housing.
And The remaining lot - C Players.
But NPA ratios are not the only way the market values Lending Institutions. The directional change, the absolute levels vs peers and the extent to which they impact ROE is what matters.
- Return On Equity (%)
8/14 HFCs have managed to expand their ROE over the preceding year.
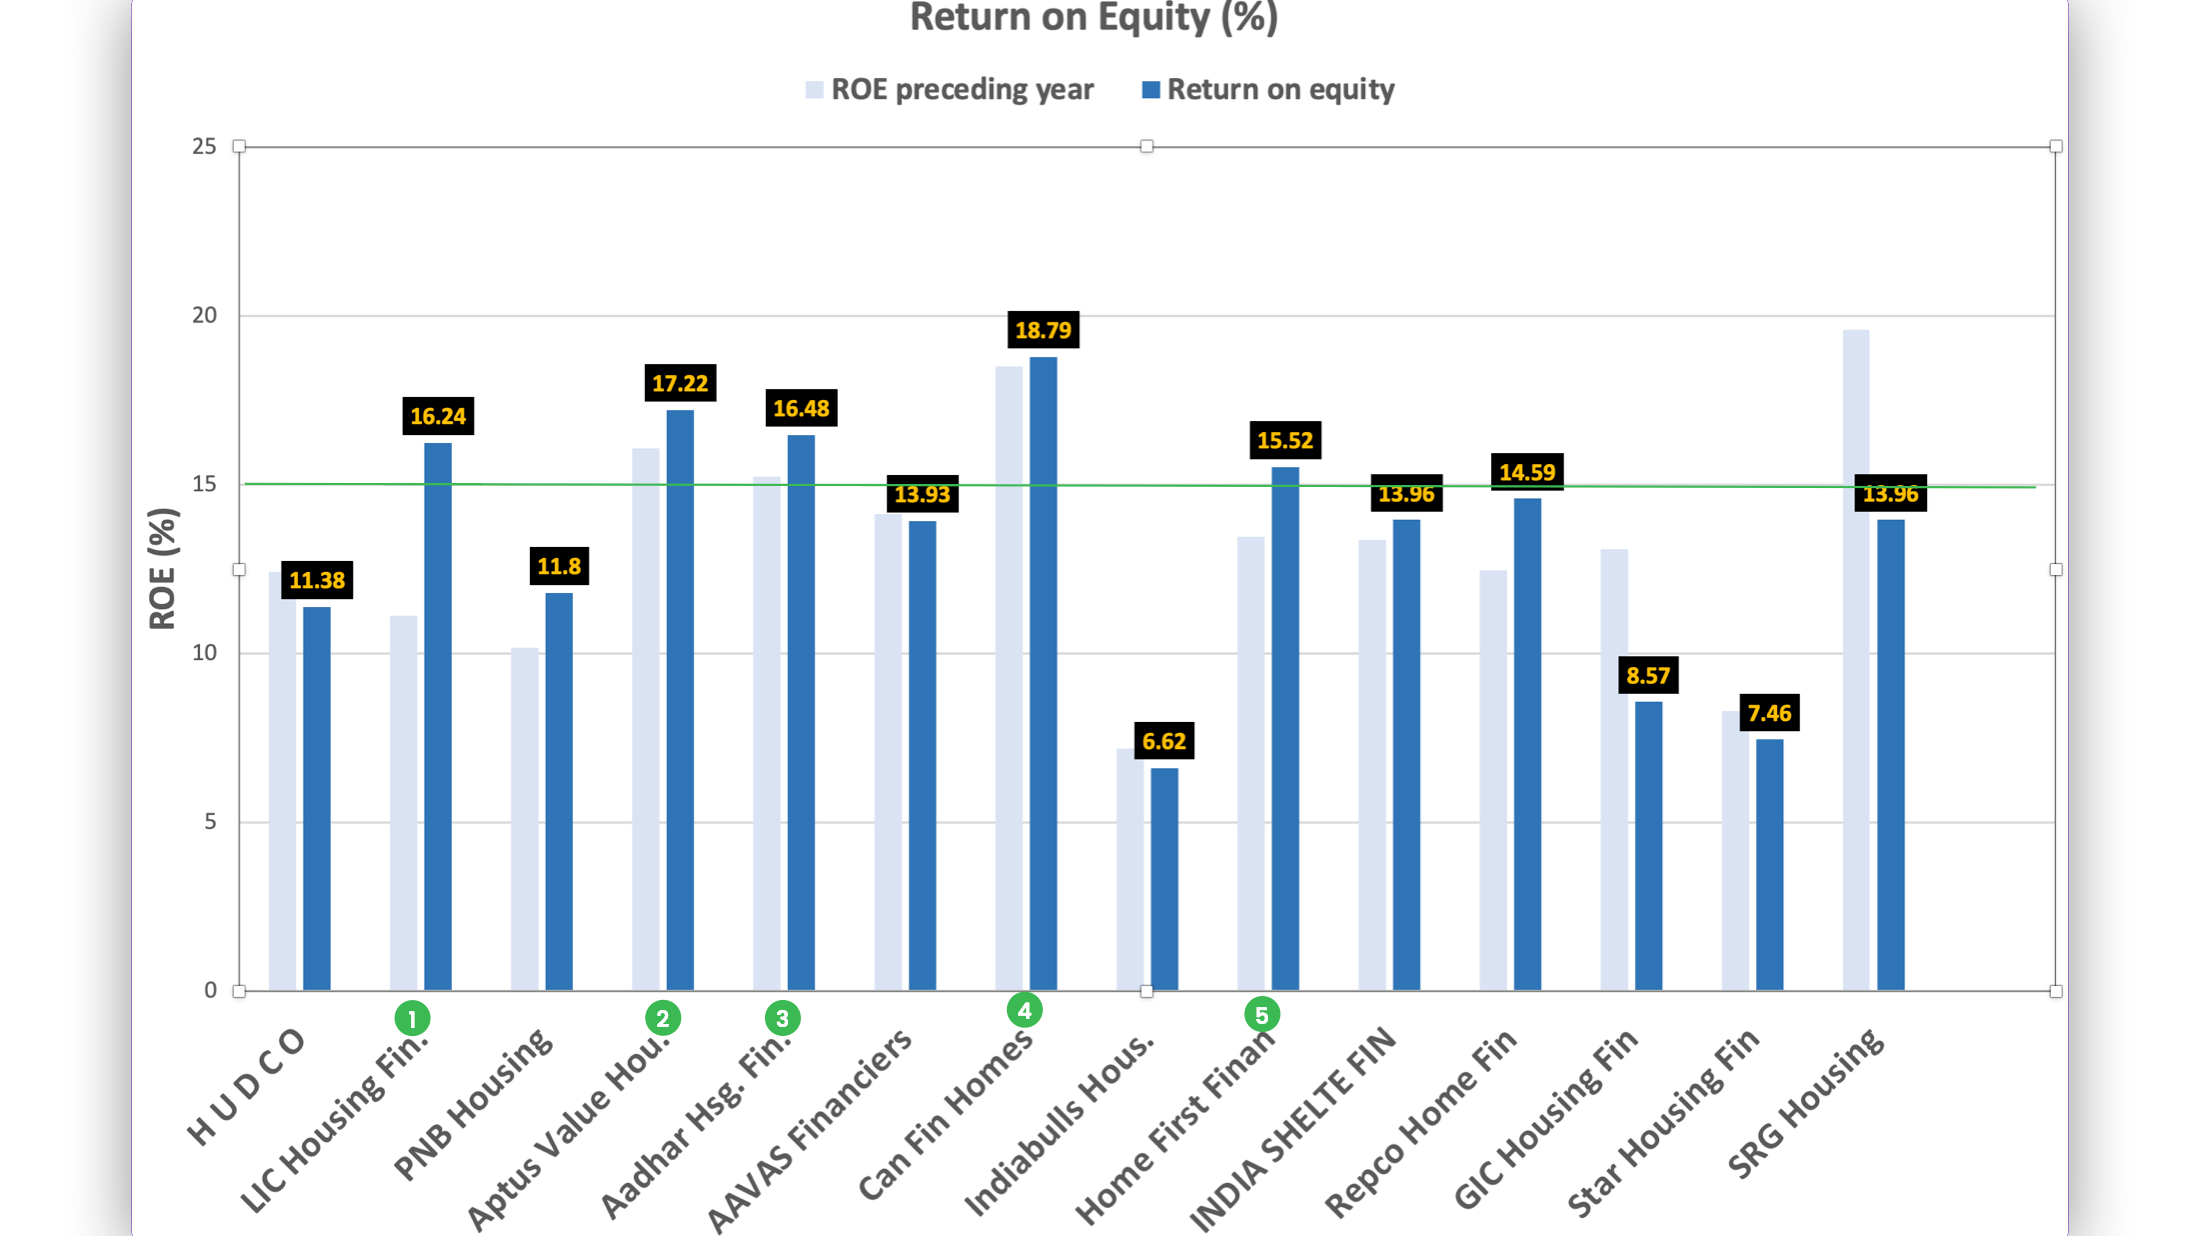
but only 5/14 have remained over 15% in FY23/FY24.
The A Players (by GNPA) also enjoyed 15% + ROE.
The Exception was Aavas Financiers. In fact, Aavas has never hit an ROE of 15% since it got listed in October 2018 but despite that has enjoyed steep valuations for most of its trading history, mainly because of High consistent growth and Pristine Asset Quality.
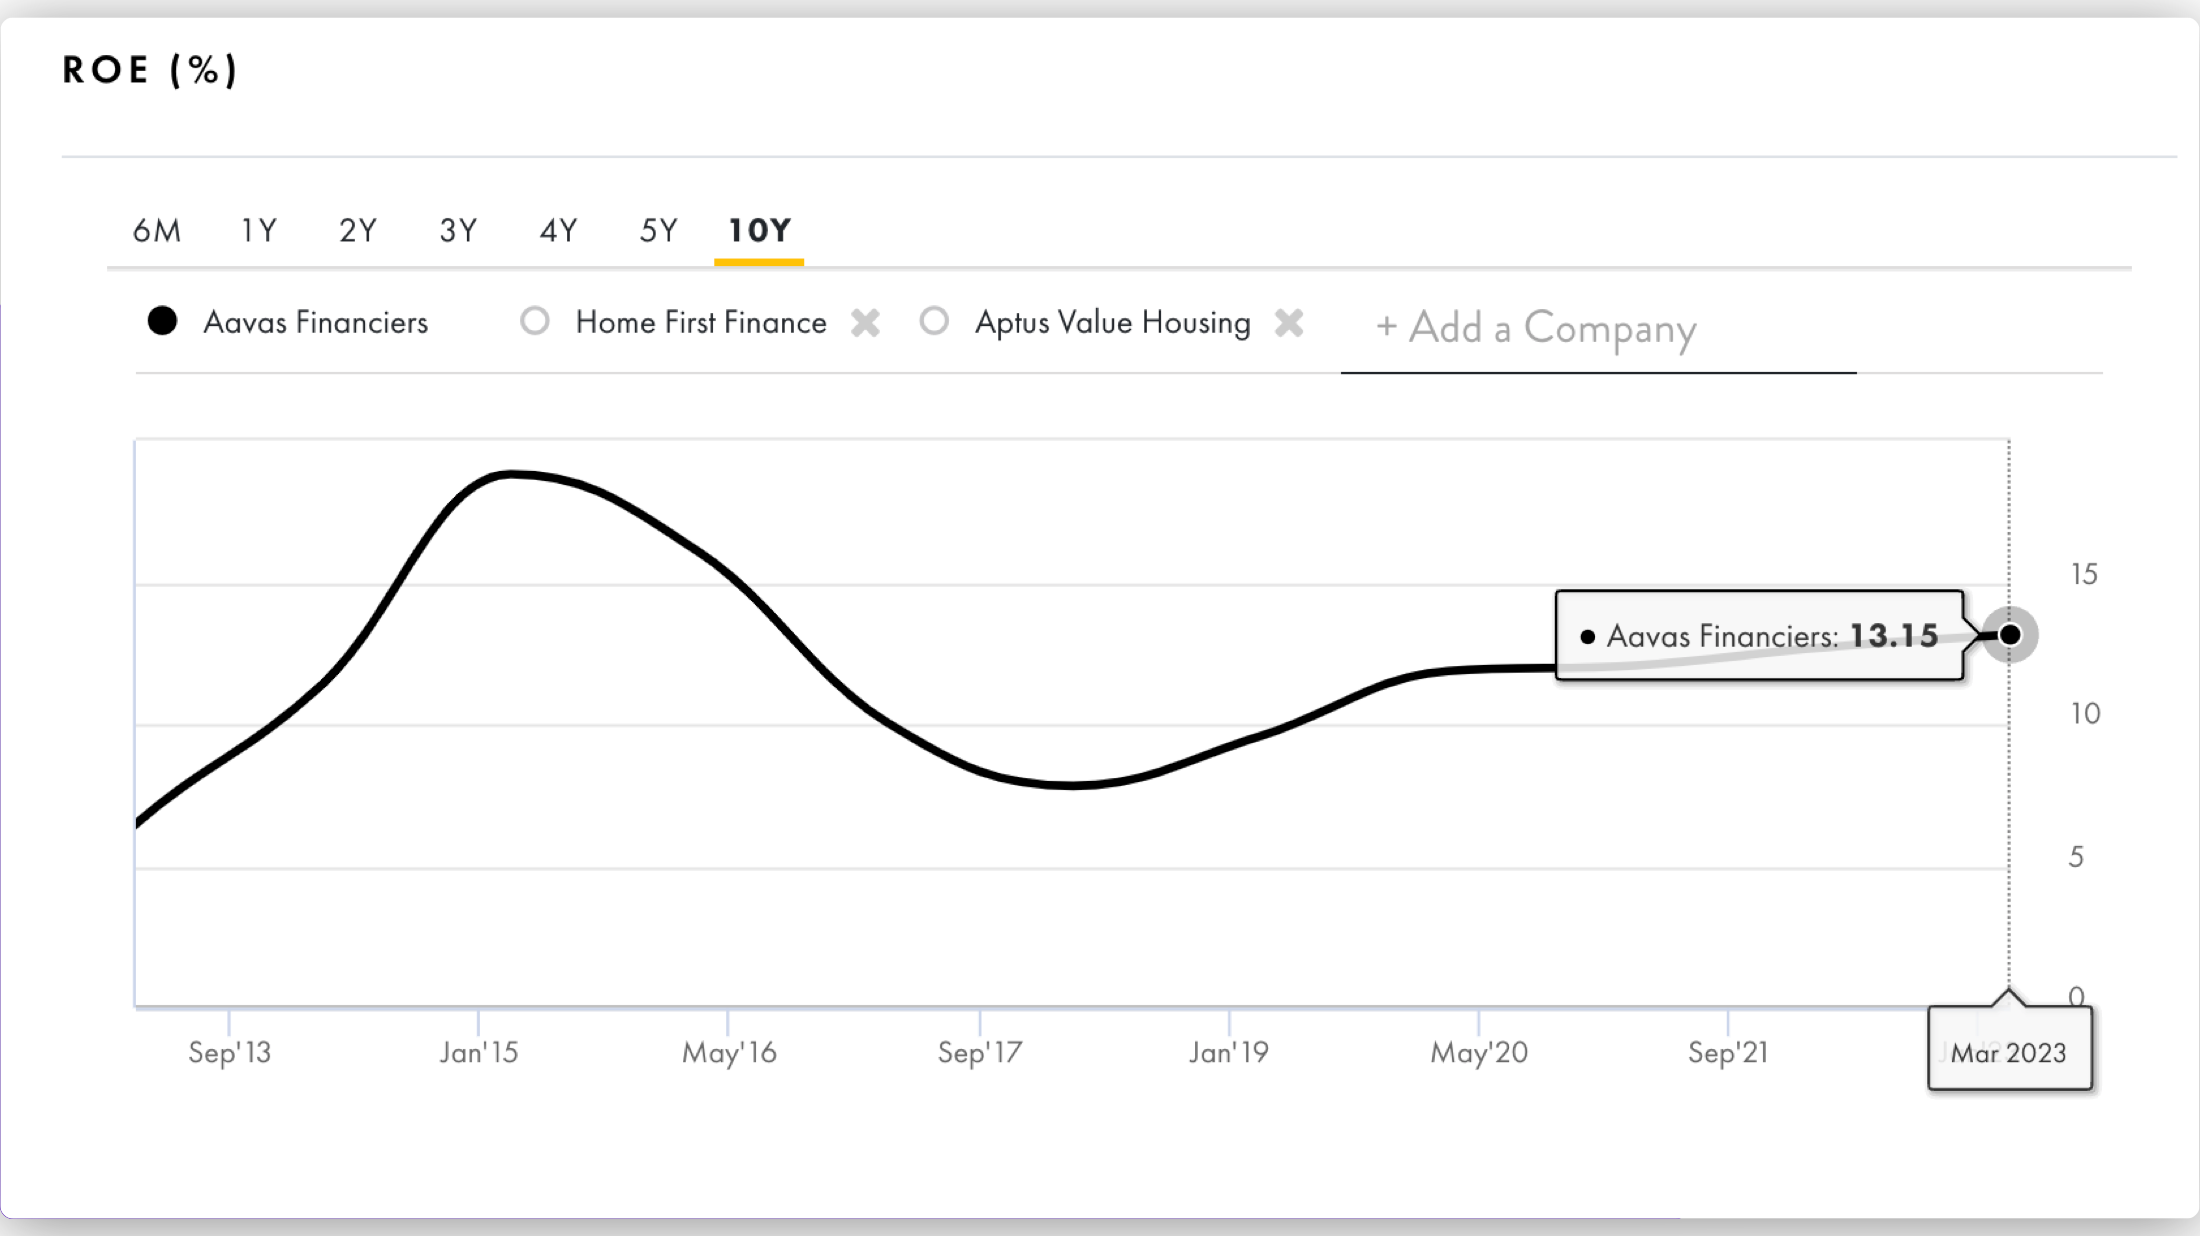
Currently, however, because of a combination of factors (Top Management Exit, PE Firms exiting, lower disbursement growth etc) Aavas currently trades at a valuation that is cheaper than it was during the crash of March 2020.
Which raises an interesting question !
Should we conduct an ‘Aavas Financiers - Deep Dive’?
- Yes
- No
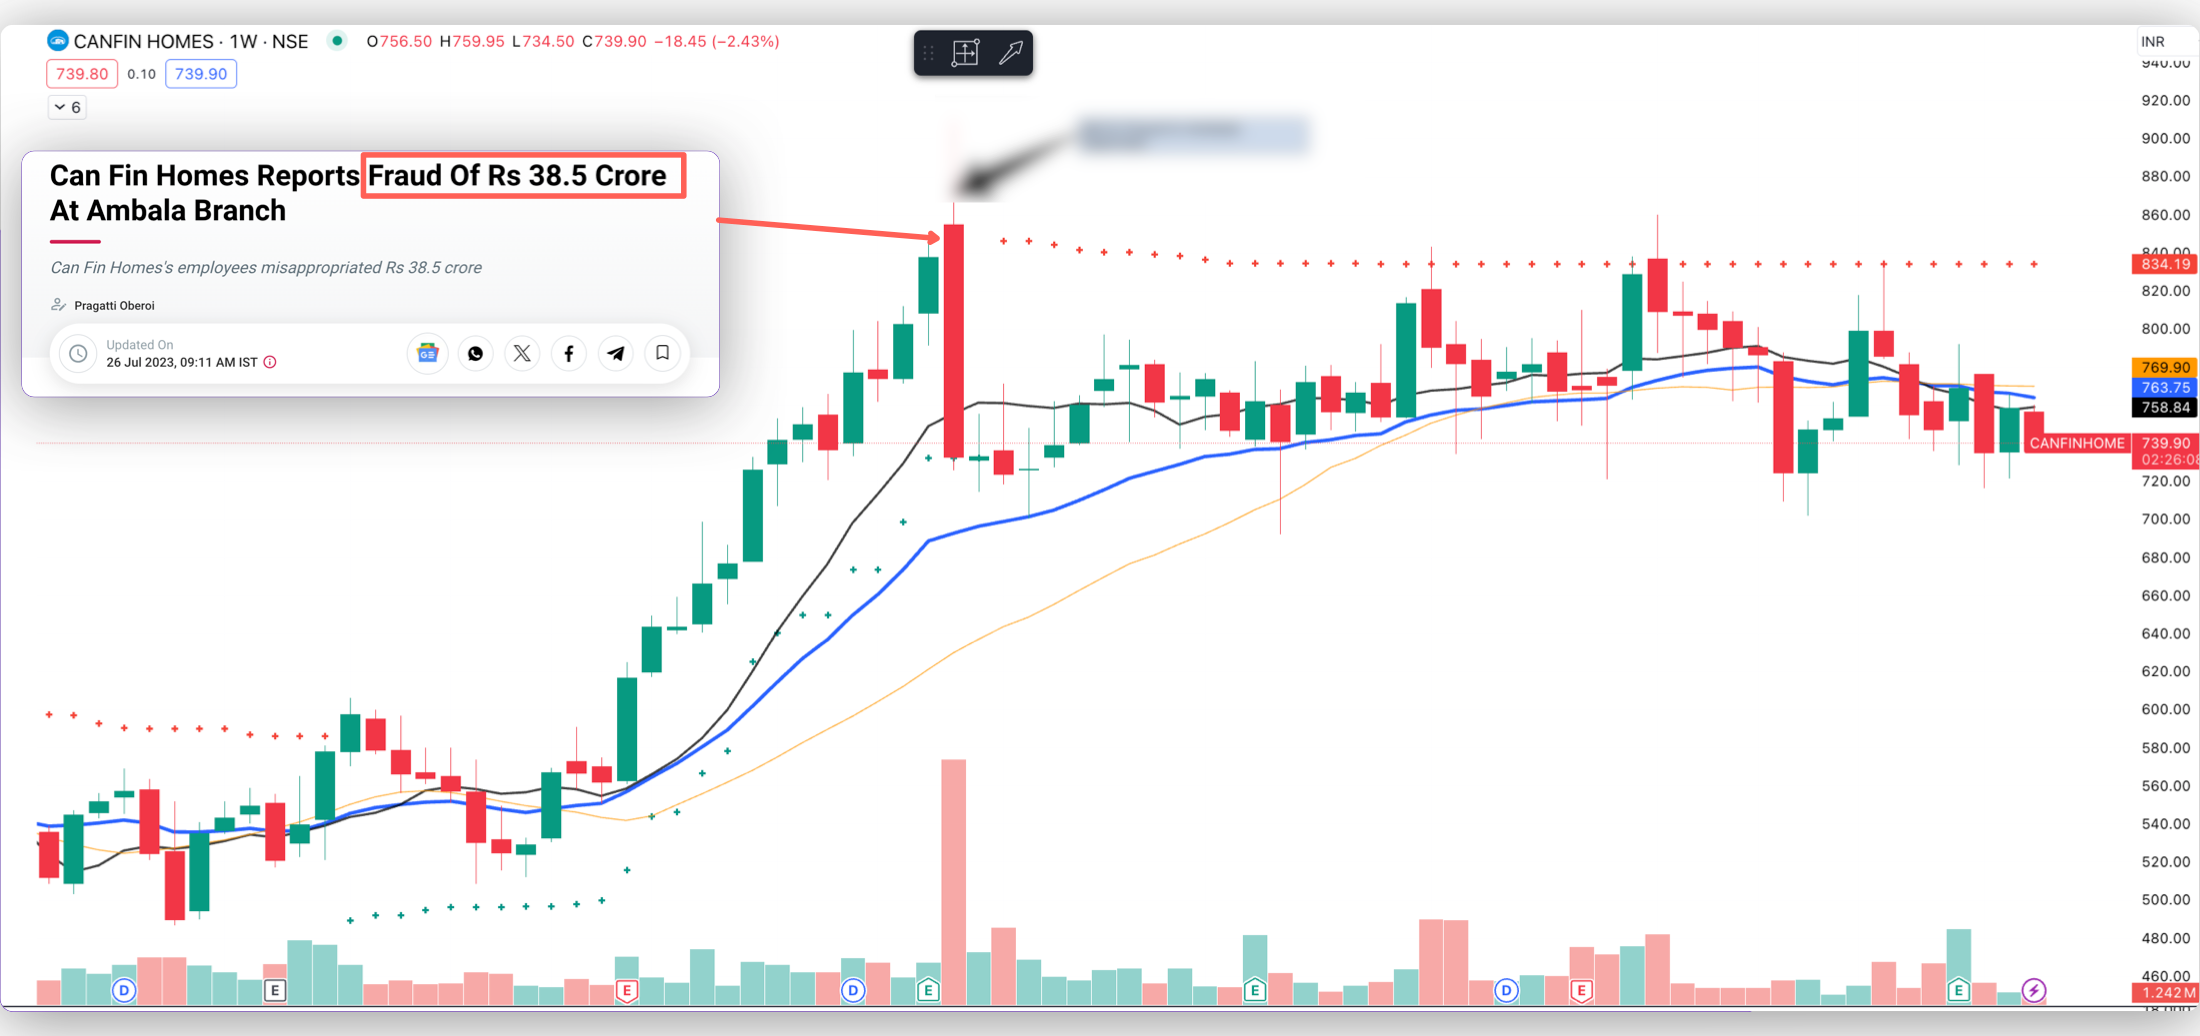
Can Fin Homes is another player with Stellar GNPA history. It also has the highest ROE among the pack. However, the problems plaguing CanFin are twofold :
A. Growth - With an ATS of ~25 Lacs, it is competing with Banks and other Large HFCs - LIC Housing, PNB Housing, Bajaj Housing etc.
B. CEO change and Weak Governance - There was an incidence of Fraud in Ambala about 1 year back, post which the stock crashed and has been trading in a range since then. P/B went from 3.1X (July 23’) to 2.3X today.
As for Delta in ROE, which in my view can be an important predictor of generating Alpha , here’s the table.
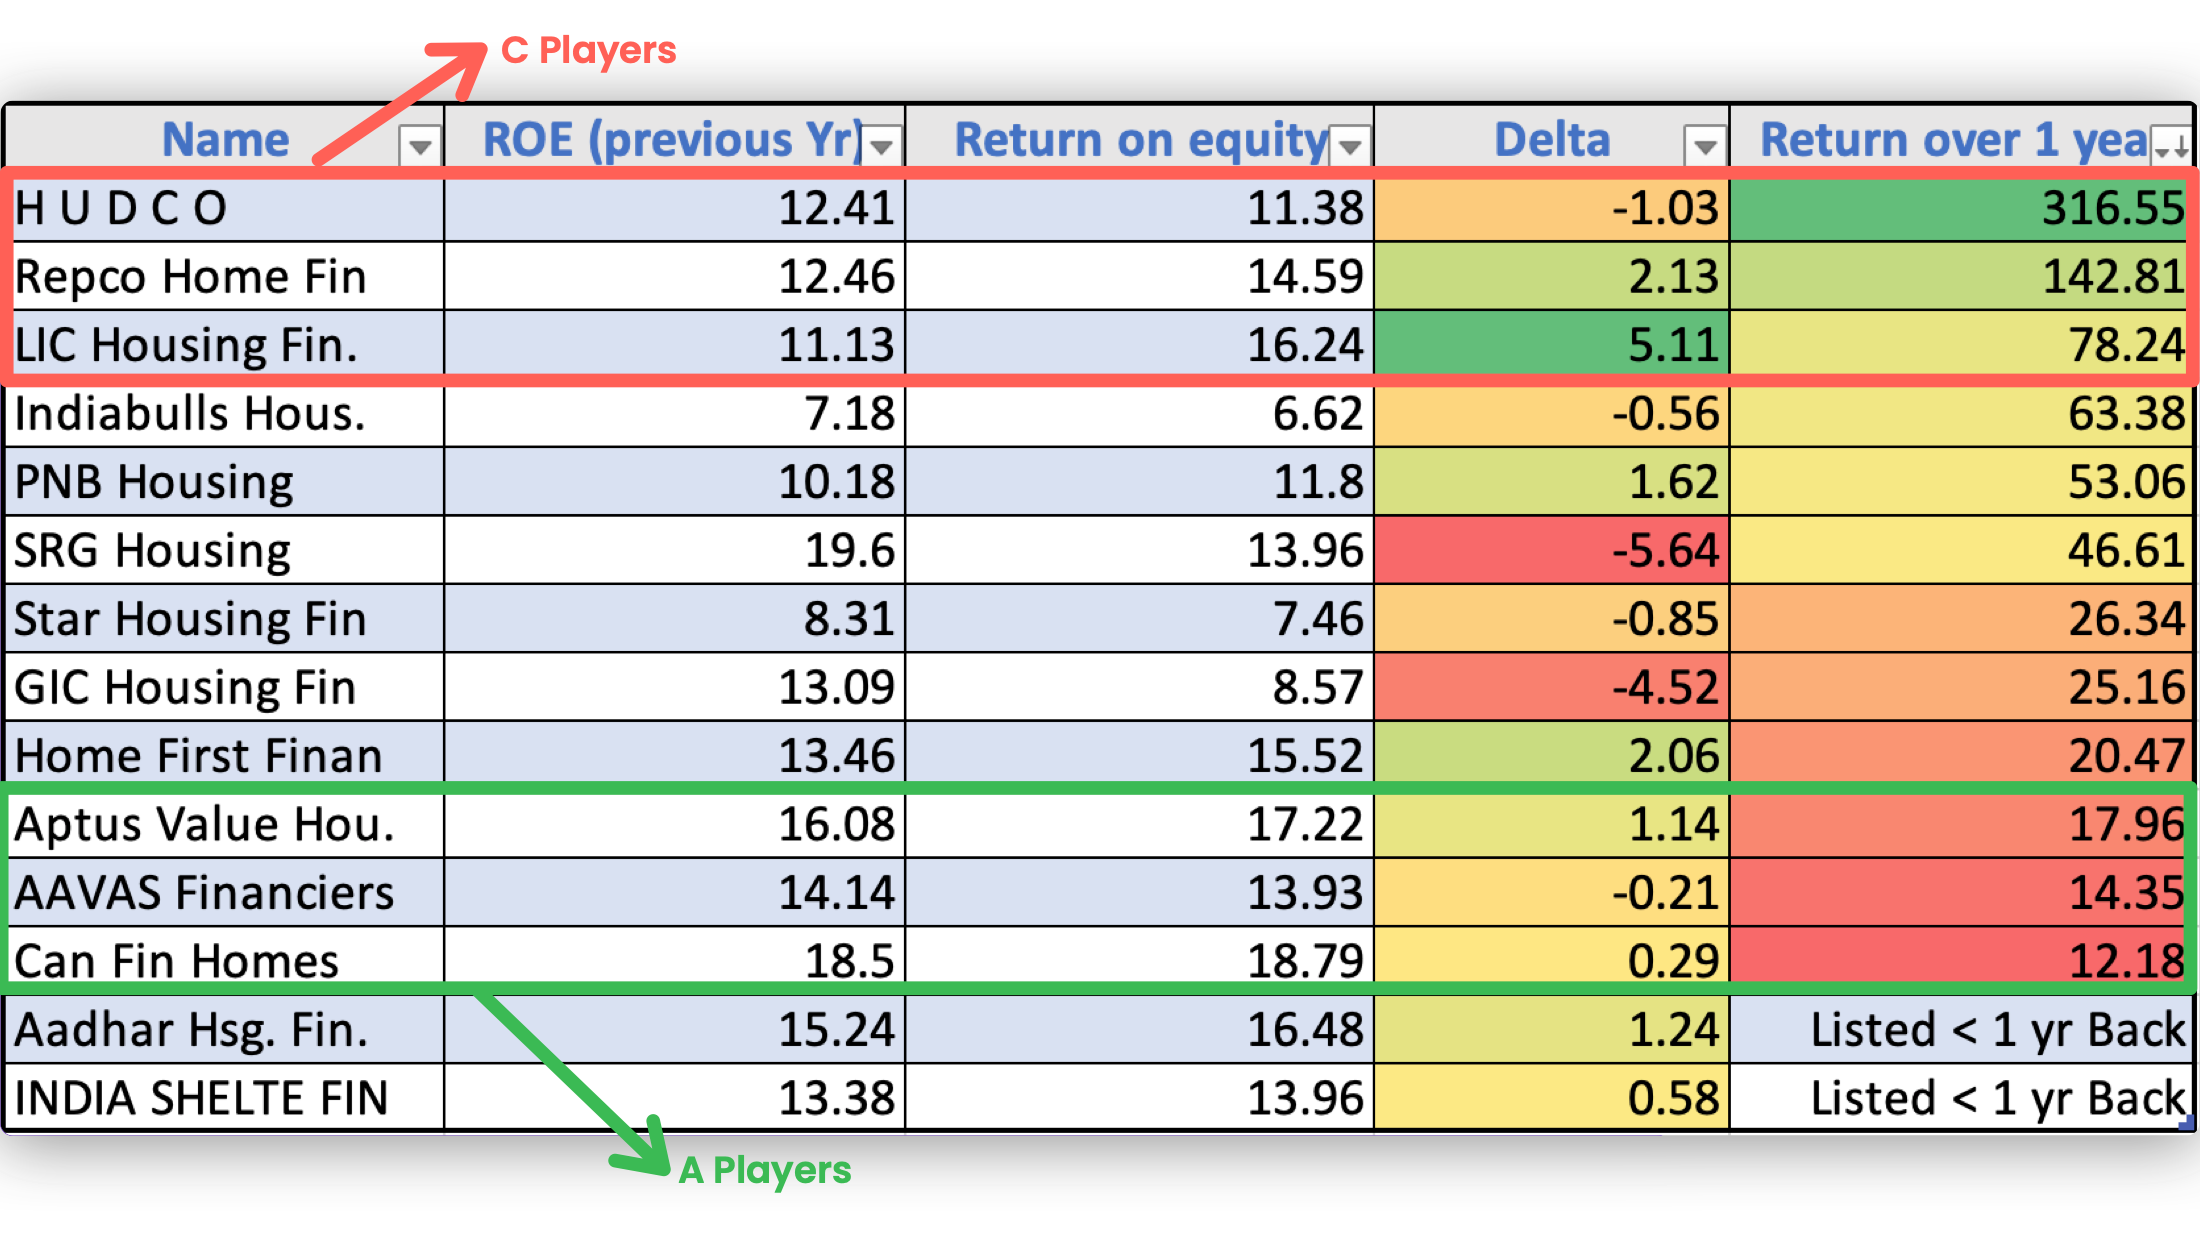
Notice something Interesting?
The worst players by Asset Quality offered the highest returns (Last 1 year) and my hypothesis for why that is the case is because In a benign credit environment, GNPAs reduction leads to lower provisions and/or write-backs, both of which lead to outsized PAT Growth vs AUM Growth.
In the case of HUDCO, an additional idiosyncratic phenomenon might be playing out too - The PSU Bubble ![]()
Poor Starting valuations are also another factor.
which raises the question, what are current P/Bx multiples? :
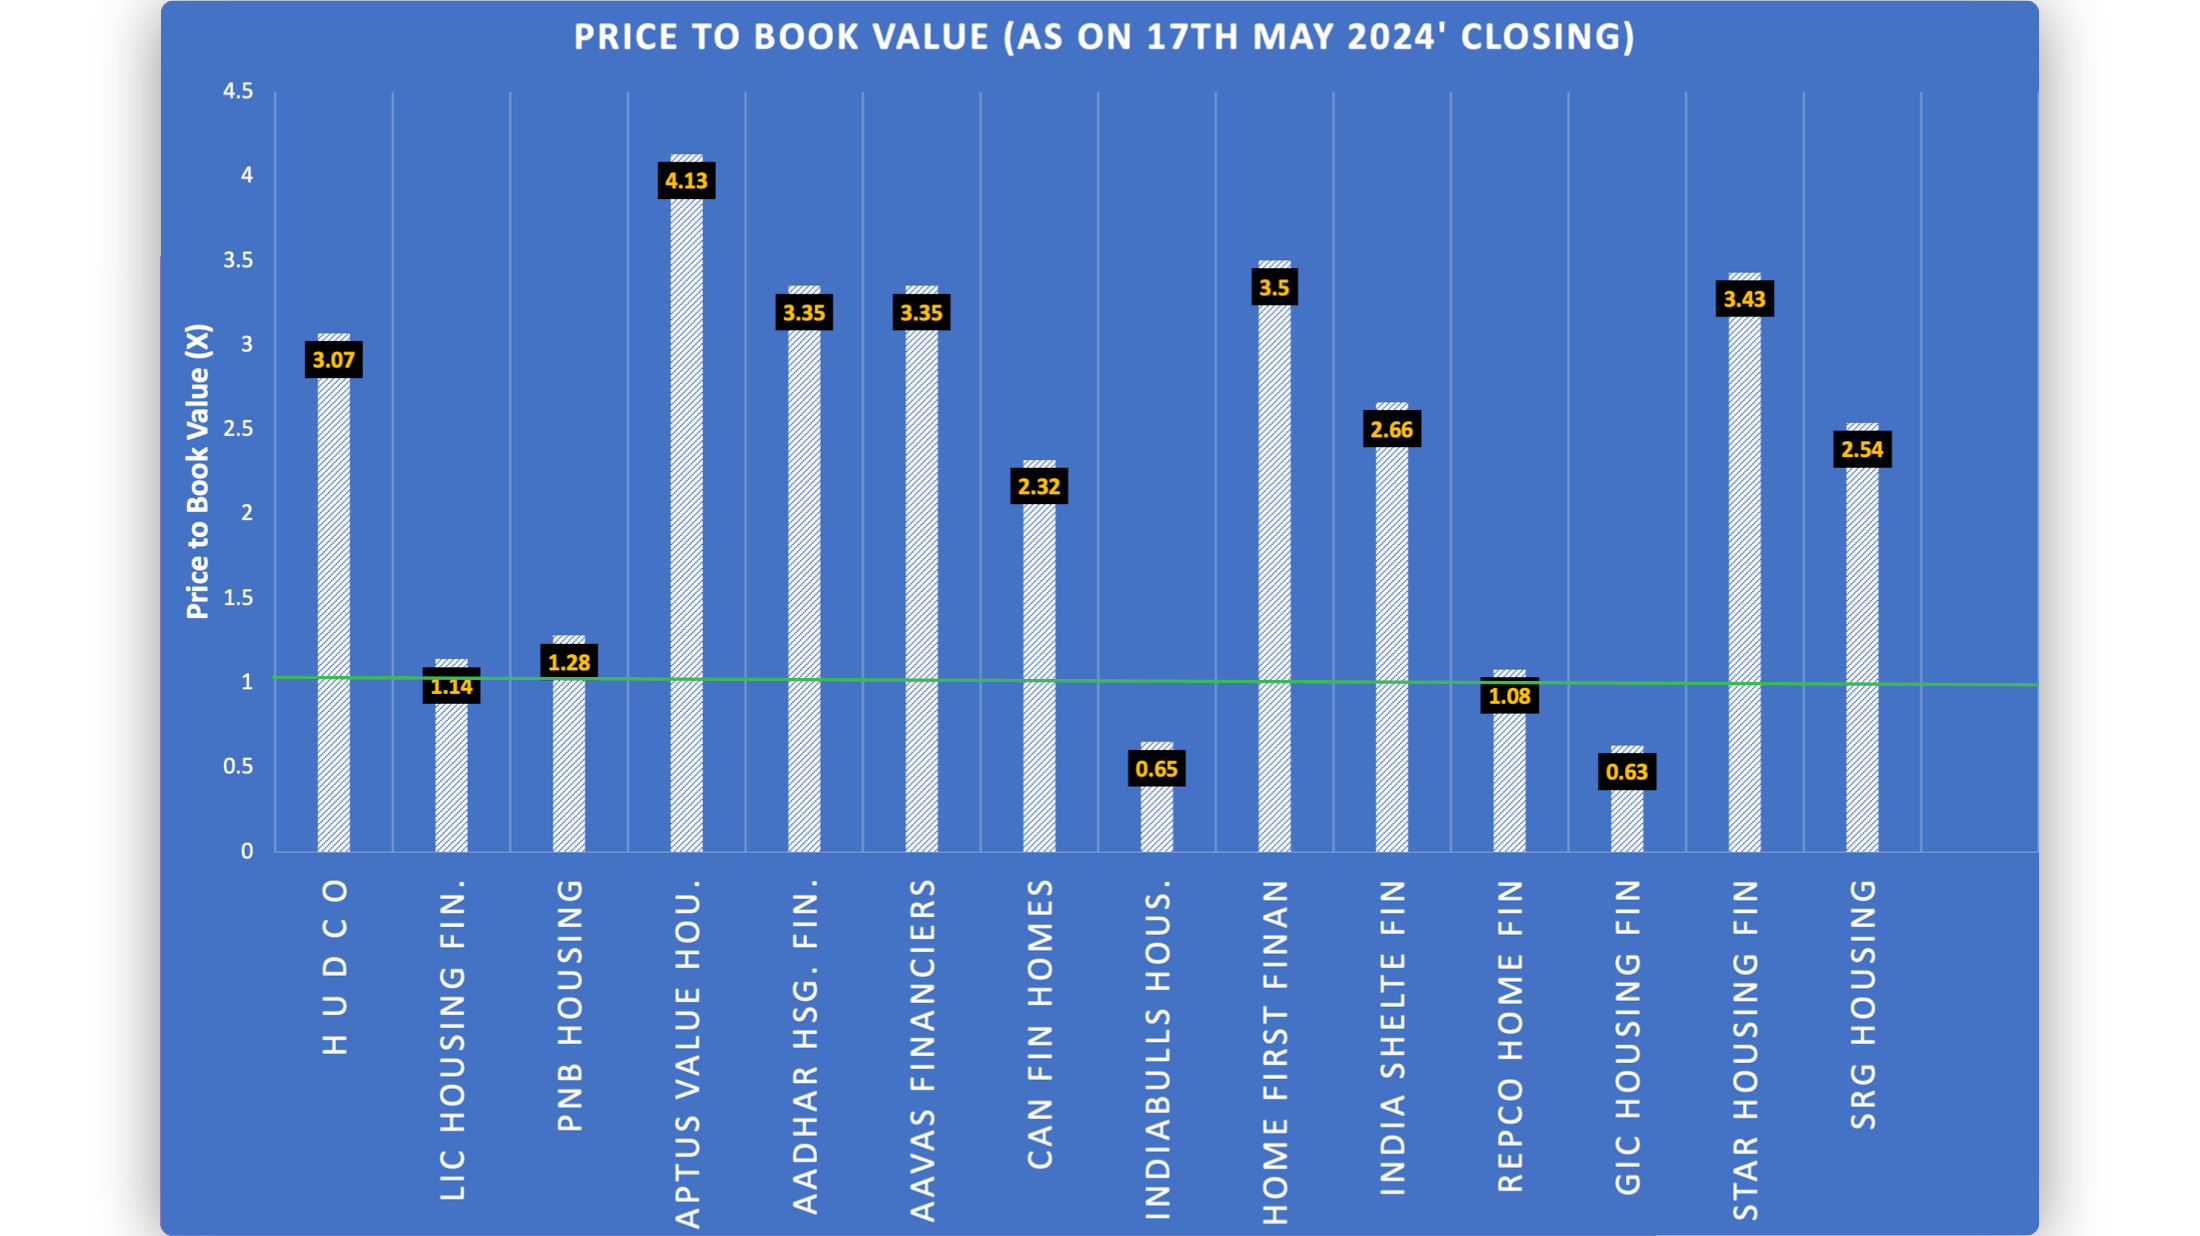
The P/Bx of 1 has been marked because Book value is meaningful for a Bank/NBFC/HFC as a metric for judging valuation (unlike for normal businesses).
Since the book value of a bank reflects the actual fair values of Assets and Liabilities (both are Marked-to-Market), a book value of < or close to 1 is considered ‘cheap’ and it implies that :
![]() There are Hidden Asset Quality issues i.e. Fair value of Assets (Loans) itself is Dicey.
There are Hidden Asset Quality issues i.e. Fair value of Assets (Loans) itself is Dicey.
![]() There will be minimal to No Growth.
There will be minimal to No Growth.
But with Banks/NBFCs/HFCs we are NOT just looking for cheaper valuations !
What we would prefer ideally is a combination of P/Bx of ~1 + an ROE of 12-15% (trending upwards) + improving GNPA + Improving Disbursement Growth?
So, with that context in mind, here’s a little homework for you.
Which co’ qualifies for the above metrics? Can you tell me in the poll below?
POLL
Would you like to guess which Co’ qualifies for the above metrics?
- LIC Housing
- PNB Housing
- Repco Home
- IndiaBulls Housing
Also let me know in the comments WHY you picked the HFC you picked.
Hope this has been fun.
Rahul
First Principles Investing