Krishana phoschem

Krishana Phoschem Limited - Detailed Analysis

1. Business Overview

Krishana Phoschem Limited (KPL) is a part of the Ostwal Group of Industries and is engaged in the manufacturing of fertilizers and industrial chemicals. The company operates a fully integrated business model, focusing on:

  • Fertilizers:
    • Single Super Phosphate (SSP) – 0.12 MMTPA
    • NPK/DAP Complex Fertilizers – 0.33 MMTPA
  • Industrial Chemicals:
    • Phosphoric Acid – 0.099 MMTPA
    • Sulfuric Acid – 0.264 MMTPA
    • Beneficiated Rock Phosphate (BRP) – 0.20 MMTPA

KPL has a strong distribution network of ~2,500 wholesalers and ~30,000 retailers across 9 states. It has been aggressively expanding its production capacity, with significant investments in plant modernization and the relocation of its DAP/NPK facility from Spain.


2. Opportunity Present Here

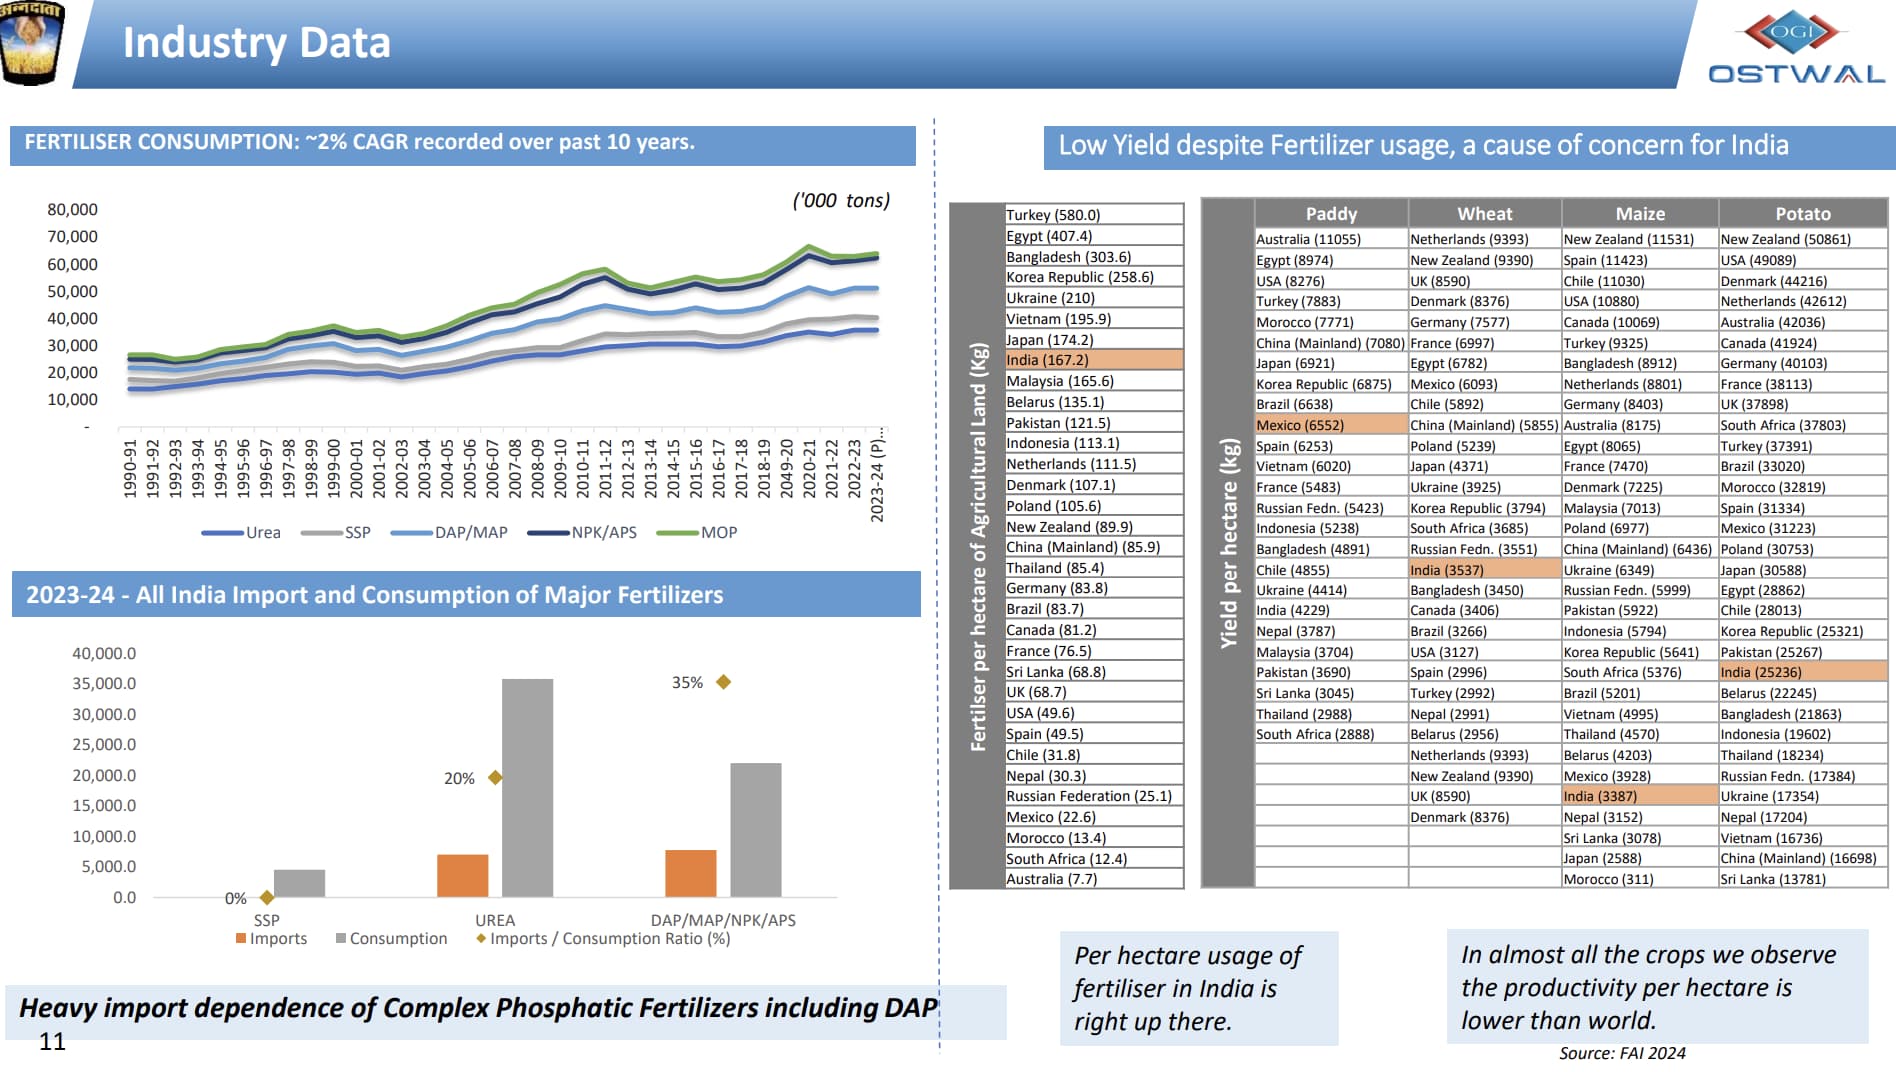
The Indian fertilizer industry is growing at a CAGR of 6-6.5%, expected to reach USD 62-70 billion by 2030. KPL operates in the phosphatic fertilizer segment, which constitutes about 20-25% of this market (~₹8-11 billion TAM).

  • Strong demand for phosphatic fertilizers driven by government subsidies and increasing agricultural productivity.
  • Backward integration in raw materials (rock phosphate, sulfuric acid) ensures a cost advantage.
  • NPK segment growth – The company has recently achieved 79% utilization of its DAP/NPK plant, showing strong demand traction.
  • Government policies like the Nutrient-Based Subsidy (NBS) scheme support phosphatic fertilizers, providing stability in pricing and margins.

3. Positives

  • Strong Revenue Growth:

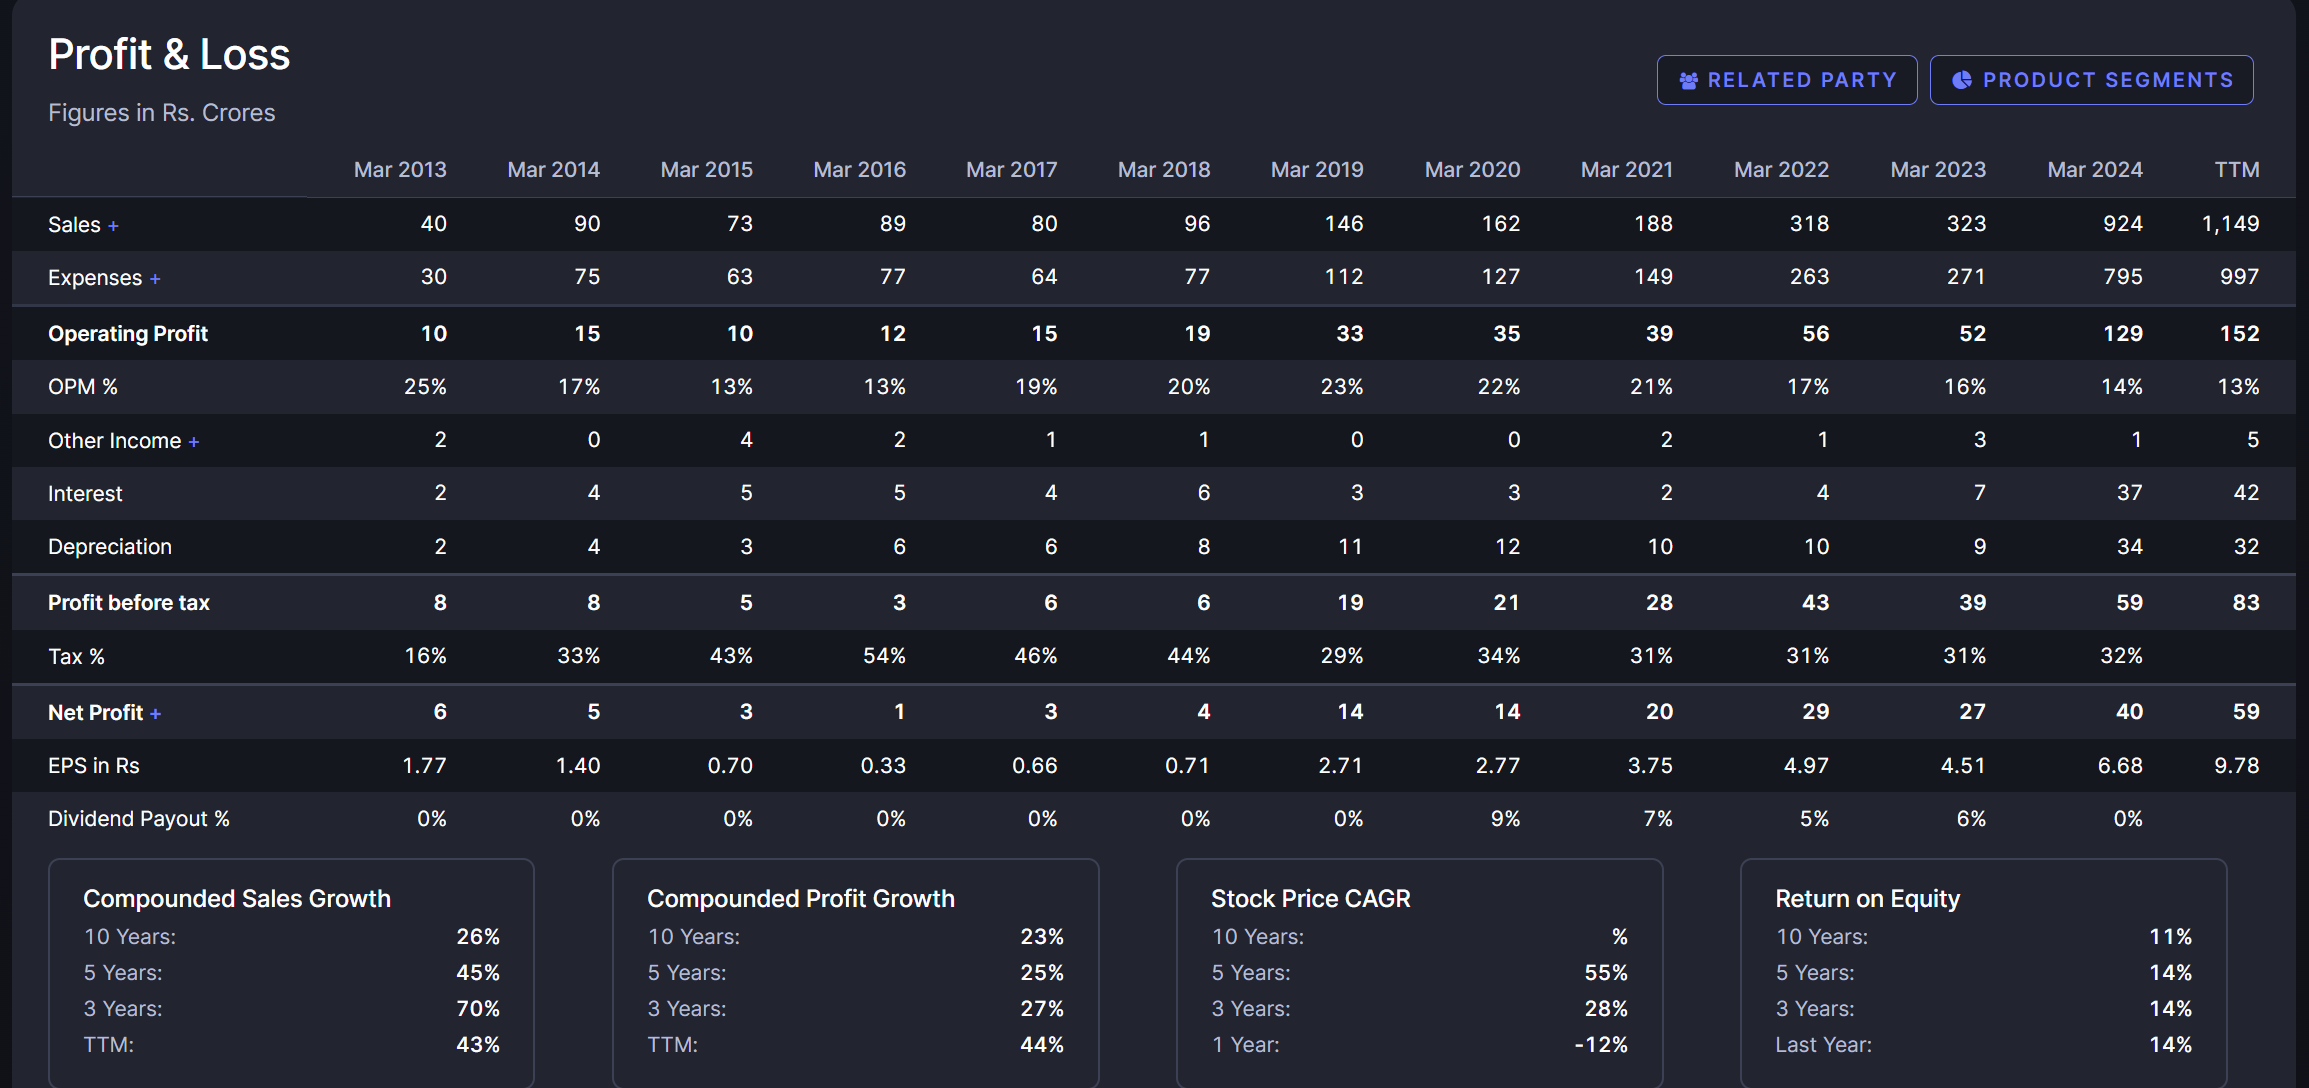
    • Sales have grown 28x in 11 years (₹40 Cr in 2013 → ₹1,149 Cr in TTM FY24).
    • Q3 FY25 revenue was ₹304 Cr, up 32.1% YoY.
  • Profitability Improvement:

    • EBITDA in Q3 FY25 was ₹44.3 Cr, up 88.5% YoY.
    • PAT grew 454% YoY to ₹20.5 Cr in Q3 FY25.
  • Capacity Expansion is Bearing Fruit:

    • SSP utilization at 100%, NPK at 79%.
    • Sulfuric acid capacity expanded from 99,000 MTPA to 165,000 MTPA.
  • Subsidy Receivables Declining:

    • Down to ₹93.5 Cr (Q3 FY25) from ₹110.5 Cr (Q2 FY25), showing improved cash flow management.
  • DCF & ROE Comparison:

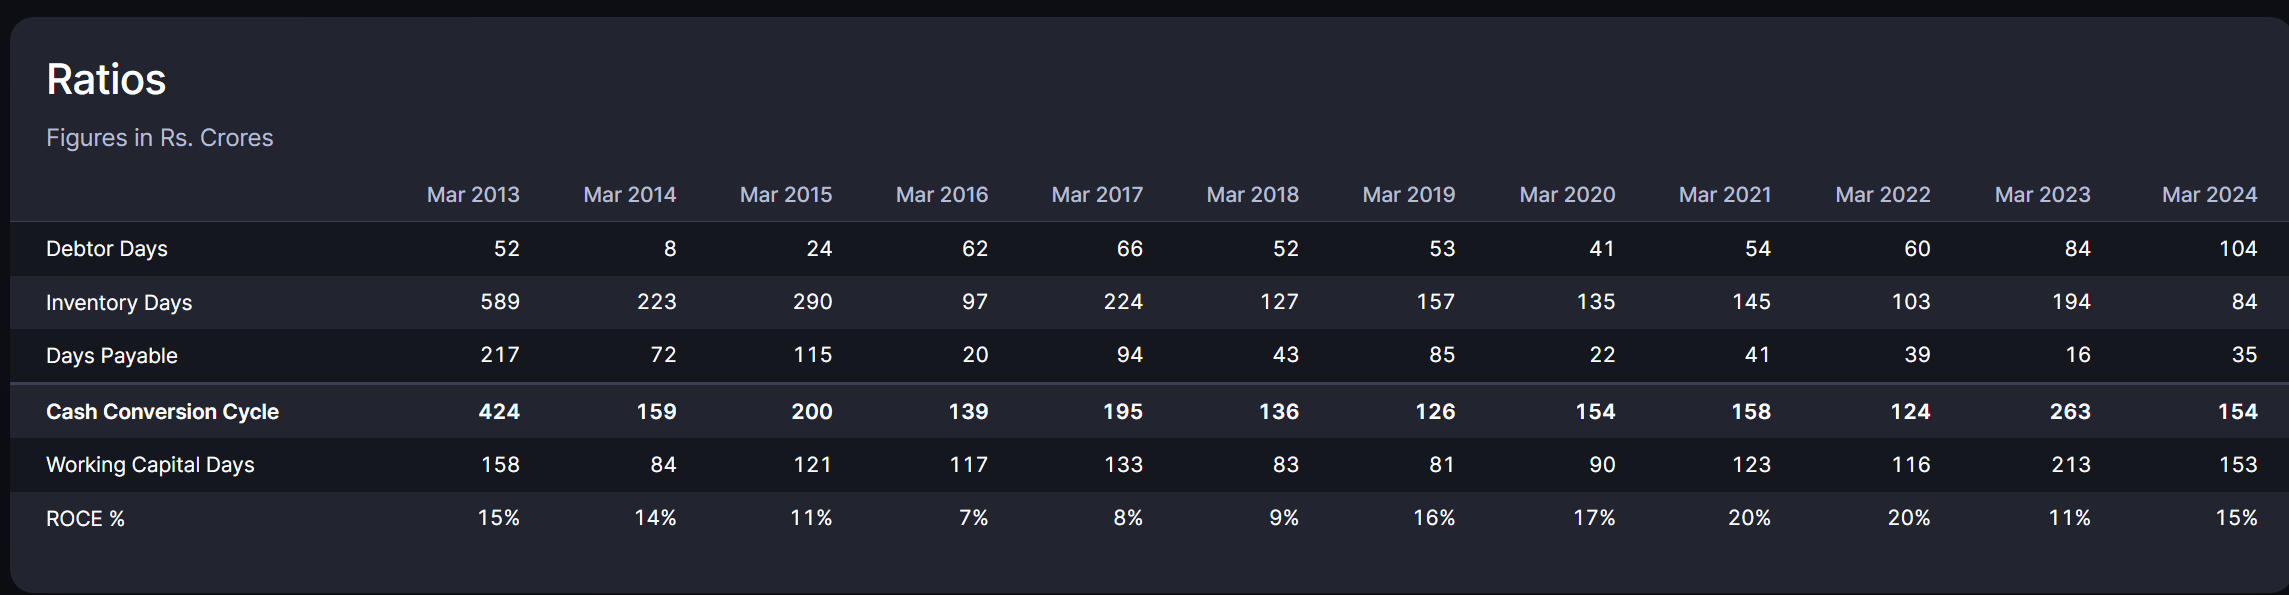
    • KPL’s ROE = 14.4%, ROCE = 15%, much higher than competitors like Paradeep Phosphates (3% ROE).
    • Despite negative FCF, its intrinsic value could improve as capex stabilizes.
  • Lower Competition from China:

    • China’s export restrictions on fertilizers benefit Indian manufacturers like KPL, providing domestic pricing power.
  • Strong Long-Term Supply Contracts:

    • Secured raw material supply (rock phosphate from Egypt, Jordan, and domestic sources).

4. Negatives & Red Flags

  • Declining Margins Despite Growth:

    • Operating Profit Margin (OPM) fell from 25% (2013) to 13% (TTM FY24).
    • Increasing expenses (raw material, logistics, and energy costs) are a key challenge.
  • High Working Capital Requirement:

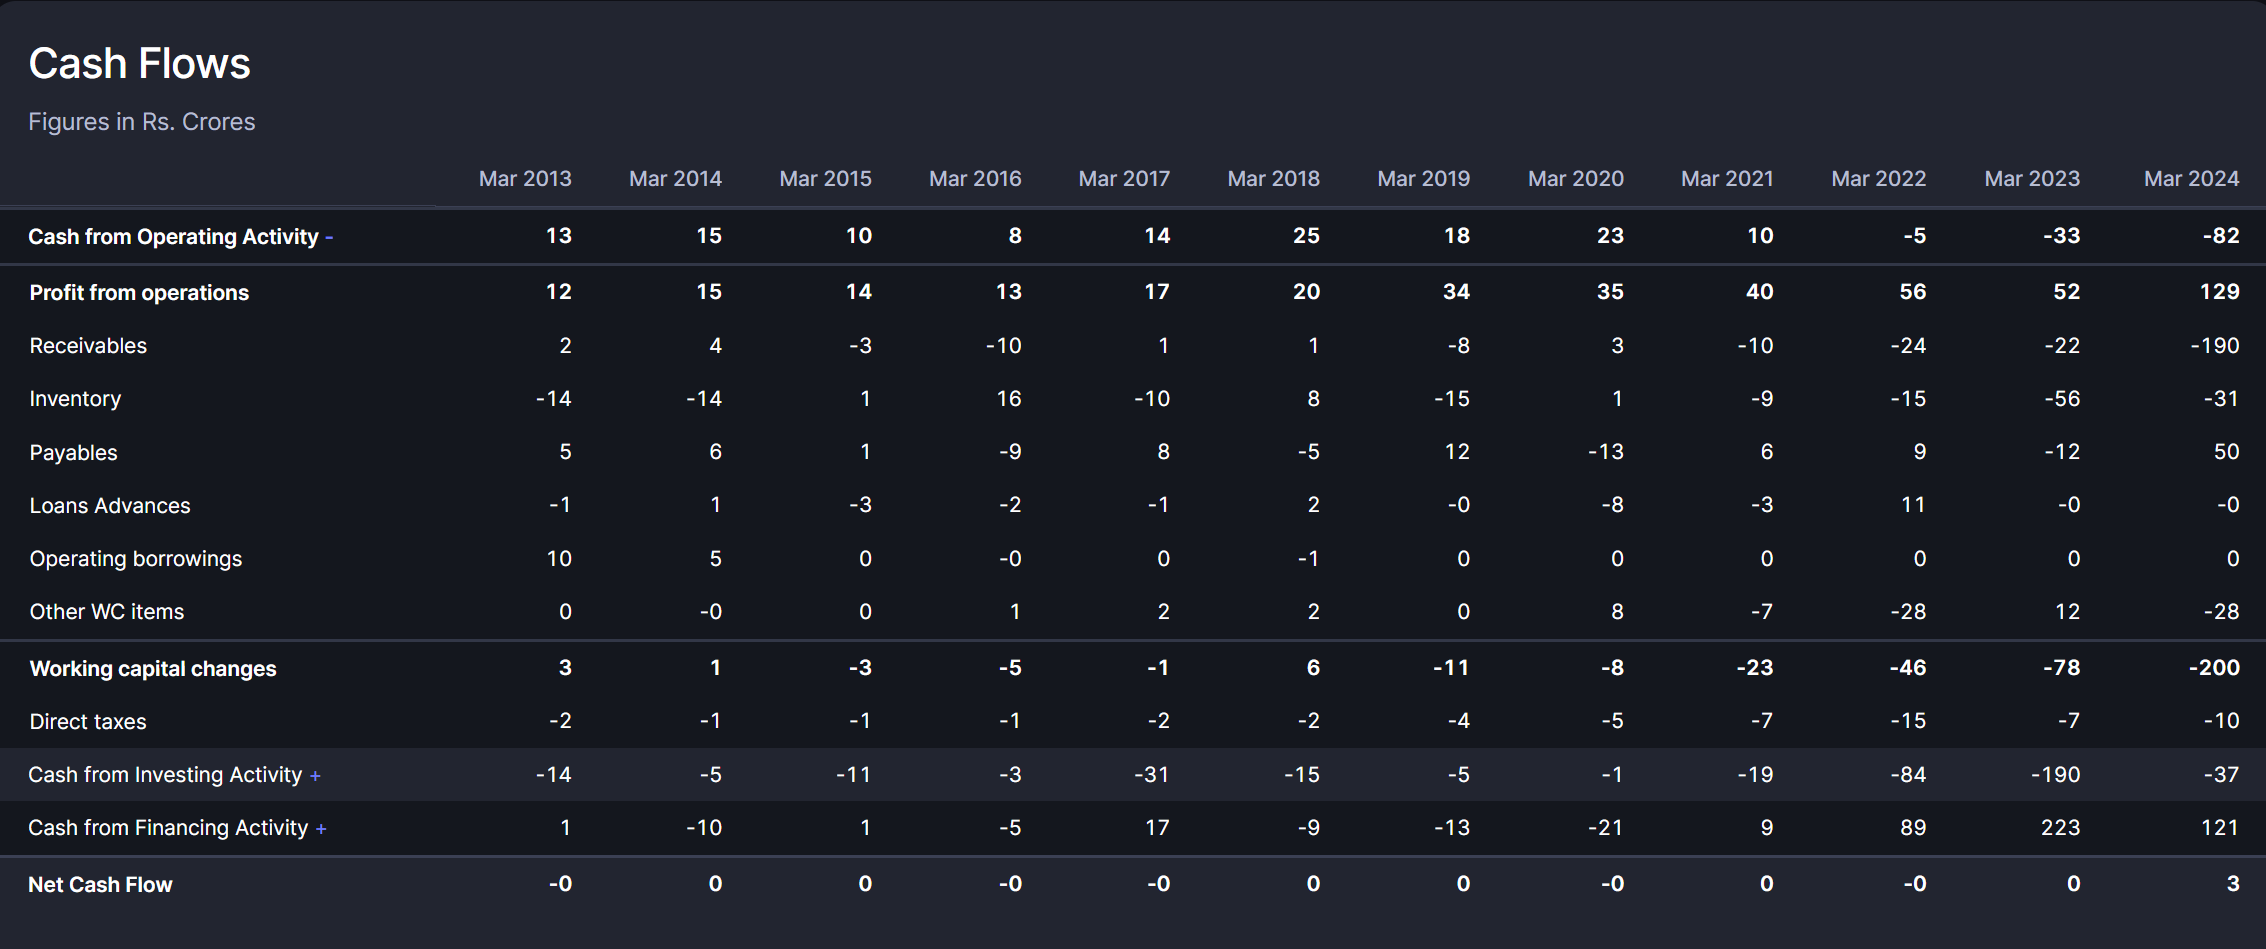
    • Receivables surged to ₹190 Cr in FY24, causing a major cash flow crunch.
    • Inventory also remains high at ₹31 Cr, impacting liquidity.
  • Negative Free Cash Flow (FCF) = ₹-119.8 Cr in FY24:

    • Heavy capex and subsidy delays are hurting FCF.
    • The company needs better working capital management to sustain expansion.
  • High Debt Levels & Interest Costs:

    • Interest expenses jumped from ₹2 Cr (2013) to ₹42 Cr (TTM FY24).
    • Increasing debt servicing cost may impact profitability if cash flows remain weak.
  • DCF Valuation Suggests Overvaluation:

    • Based on simplified DCF analysis (₹912 Cr intrinsic value), the stock is trading above its fair value (₹1,318 Cr market cap).
    • The market seems to be pricing in higher future growth or lower risk.
  • Cyclical Business, Dependent on Government Policies:

    • Any reduction in fertilizer subsidies or policy shifts in NBS could hurt margins.
  • Limited Geographic Reach:

    • KPL is still largely concentrated in a few states (Madhya Pradesh, Chhattisgarh).
    • Need to expand into high-demand states like Maharashtra, Gujarat, and UP.

5. Final Thoughts & Investment Outlook

Krishana Phoschem Limited has strong revenue growth, expanding capacity, and a well-integrated business model. However, key concerns like working capital management, high debt, and margin compression must be addressed for sustainable profitability.

Who Should Consider This Stock?

  • Long-term investors looking for a high-growth fertilizer company with strong expansion potential.
  • Investors betting on the Indian agriculture & fertilizer sector boom.
  • Those willing to hold despite short-term cash flow issues, expecting strong free cash flow once capex slows.

Who Should Avoid?

  • Short-term traders, as subsidy receivable delays and working capital crunch could cause volatility.
  • Conservative investors who prefer positive free cash flow and low debt.

“Please forgive me if I made any mistakes, and kindly correct me wherever I am wrong.” (DISC:: IM INVESTED FROM AROUND 200,WILL ADD MORE)

2 Likes

As i missed out on financials here is a sneak peak into it


Key Observations:

  • Revenue has grown 28x from ₹40 Cr (2013) to ₹1,149 Cr (TTM FY24).
  • Margins have declined (OPM down from 25% in 2013 to 13% in TTM FY24).
  • EPS growth is strong, reaching ₹9.78 (TTM FY24).

CASH FLOWS


Key Observations:

  • Operating Cash Flow has turned negative (-₹82 Cr in FY24) due to subsidy receivable delays and inventory build-up.

  • Capex is high, peaking at ₹193 Cr in FY23, indicating major expansion investments.

  • Free Cash Flow (FCF) = -₹119.8 Cr in FY24, suggesting a high cash burn phase.

  • Debt peaked at ₹211 Cr in FY23 but reduced to ₹168 Cr in FY24, showing early signs of deleveraging.
    RETURN RATIOS


    Key Observations:

  • ROE (14.4%) and ROCE (15%) indicate good profitability but are lower than historical levels.

  • Book Value per Share = ₹54.6, implying the stock trades at around 4x book value.

  • Dividend yield is low at 0.22%, indicating a growth-focused reinvestment strategy.
    AT THE END
    Positives:

  • Strong revenue growth, reaching ₹1,149 Cr (TTM FY24).

  • Profitability is improving, with net profit reaching ₹59 Cr (TTM FY24).

  • Debt has started reducing (from ₹211 Cr to ₹168 Cr in FY24).

Risks & Concerns:

  • Negative free cash flow (-₹119.8 Cr in FY24) due to high working capital needs.
  • Rising receivables (₹190 Cr in FY24), indicating delayed cash collections.
  • High interest expenses (₹42 Cr in TTM FY24) due to debt-funded expansion.
  • Declining operating margins (from 25% in 2013 to 13% in FY24).
    {my views can be biased as im invested,hope it helps :raising_hands:}


promoters are continuously buying

Disc- Added today

3 Likes

KRISHANA_22032025115050_NSEEGMINTIUPLOAD2203SIGN.pdf (1001.1 KB)

Krishana Phoschem EGM Highlights (March 22, 2025)

Key Resolutions Passed:

  1. Increased Borrowing Limit – Approved up to ₹1,500 crore, indicating expansion or refinancing.
  2. Asset Monetization & Charge Creation – Allowed selling, leasing, or pledging assets up to ₹1,500 crore.
  3. Higher Investment & Lending Limits – Permitted investments, loans, and guarantees up to ₹500 crore, signaling potential acquisitions or financial support to subsidiaries.

WHAT IT COULD MEAN

  • Aggressive Growth Strategy – Indicates future expansion or capital-intensive projects.
  • Higher Debt Exposure – Potential increase in interest costs and leverage.
  • Asset Pledging Risk – Increased financial obligations if market conditions worsen.

Next Steps:

  • Voting results to be published within two days.
  • Investors should track execution and financing details for impact on profitability and balance sheet strength.

[MARCH 2025 UPDATE]

Krishana Phoschem Limited - March 2025 Report

1. Financial Performance

  • Record Revenue & Profitability:

    • Revenue: ₹304 Cr (+32.1% YoY)
    • EBITDA: ₹44.3 Cr (+88.5% YoY)
    • Net Profit: ₹20.5 Cr (+454.1% YoY)
    • EPS: ₹3.32 (up from ₹0.60 in Q3 FY24)
  • Segment-Wise Performance:

    • NPK Sales: 57,864 tons (+205.3% YoY), highest-ever quarterly sales
    • SSP Sales: Declined 36.4% QoQ, reflecting demand slowdown
    • No DAP Sales Reported in Q3 FY25
  • Working Capital & Cash Flow:

    • Subsidy receivables reduced to ₹93.5 Cr (from ₹110.5 Cr in Q2 FY25)
    • Finance cost increased to ₹9.3 Cr (+6.9% YoY) due to rising debt servicing

2. Operational & Strategic Updates

  • Capacity Utilization:

    • NPK at 79%, driving revenue growth
    • SSP utilization dropped to 65%, showing demand concerns
  • Expansion & Growth Plans[ VERY IMP]:

    • Exploring new geographic markets in India
    • Evaluating acquisition of sick fertilizer units for turnaround
    • Brownfield & Greenfield expansion in Meghnagar, MP under consideration

3. Industry Insights & Market Trends

  • Indian fertilizer market valued at ₹3.6 lakh crore ($43 billion), expected to reach ₹5.2-5.5 lakh crore ($62-70 billion) by 2030
  • Phosphatic fertilizers (DAP/NPK) gaining market share over SSP and urea
  • China’s export restrictions have benefitted Indian fertilizer manufacturers
  • Subsidy policies remain stable, but potential risks exist for SSP support
  • India’s per hectare fertilizer use (167.2 kg) remains lower than leading agricultural nations

4. Key Risks & Concerns

  • Declining SSP Sales & Capacity Utilization Issues
    • SSP demand falling while NPK gains preference
  • Rising Raw Material Costs Impacting Margins
    • Cost of materials up 31% YoY, pressuring profitability
  • Higher Debt & Potential Asset Pledging Risks
    • Increased borrowing limits indicate potential financial risks
  • No DAP Sales Reported
    • Could indicate supply chain or market strategy shifts

MOTA-MOTA POINTS
1)NPK driving strong revenue growth
2)Subsidy receivable reduction improves cash flow
3)Expansion plans indicate long-term growth potential
4)SSP demand decline could affect profitability
5)High raw material costs & rising debt levels need monitoring

Challenges in SSP sales, rising input costs, and financial leverage must be watched closely for sustainable long-term performance.

INTERESTING DATA

2 Likes