
Notes from JB Chemicals AR for FY 21-22 -
- JBC was the fastest growing Pharma company among top 30 companies in the Indian Pharma market in FY 21-22. Company has 07 manufacturing facilities in India. 05 of its power brands feature in India’s top 300 brands. These are -
Rantac ( to treat heartburn, indigestion ), Rank- 45
Cilacar ( to treat high BP ), Rank- 52
Cilacar-T ( to treat high BP ), Rank - 203
Metrogyl ( to treat bacterial infections ), Rank- 194
Nicardia ( to treat high BP ), Rank - 240
- Key growth initiatives during the year -
(a) New go to market model focusing on increasing MR productivity and renewed focus on domestic business
(b) Increased focus on chronic segments. Acquired Azmarda ( Scaubitril + Valsartan ) from Novartis - used to treat heart failure, a fast growing category.
(c) Launched 15 products in domestic market. Contribution from new launches stands at 4pc, up from 1.4 pc last yr.
(d) Acquired 06 brands from Sanzyme. These are -
Sporlac ( probiotic used to treat gas and diarrhoea )
Lobun ( prebiotic used to treat chronic kidney disease)
Oxalo ( probiotic to treat constipation, diarrhoea )
Nano-Leo ( capsules to improve male sexual health )
Pubergen ( Injectable hormone to support pregnancy )
Gynogen ( Injection to treat infertility )
(e) Beyond India, SA and Russia are company’s strong markets. JBC was the fastest growing company in SA last yr. Company is ranked 15 in SA. Russian demand remains stable despite geo-political headwinds.
(f) In US, company to focus on low volume, high value products with own APIs as backward integration.
(g) Company’s CMO business, specially Lozenges represents an area of excellence with company being among top 5 companies globally. Aims to maintain the same. Also aims to focus on immunity based products here, beyond cold and cough products to improve growth rates.
- Last 5 yr data -
Sales - 1413, 1643, 1775, 2043, 2424 cr
EBITDA - 217, 305,378, 560,543 cr
EBITDA margins - 15pc, 19pc, 21pc, 27pc, 22pc
Disc: invested, biased
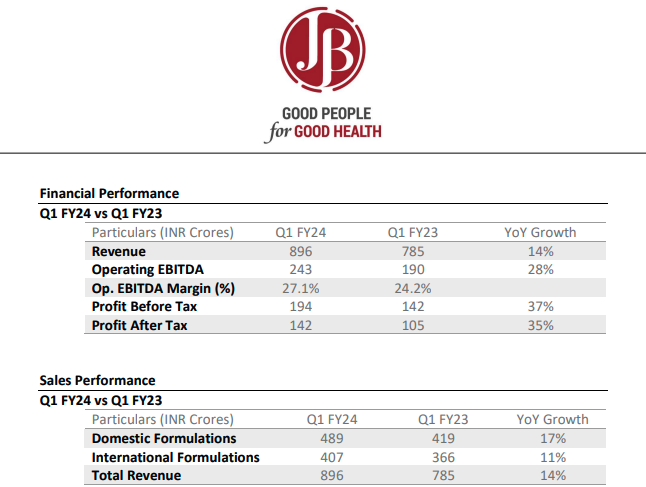
Q1results. Robust growth across all segments.
Disc: invested, biased.
PAT is down 12% YoY what is robust about the results? ![]()
PAT is down because of ESOP cost and higher amortisation costs due to the acquisitions made by the company last year.
On the operating front, the business is showing very good momentum with robust sales and EBITDA ( adjusted for ESOP) growth.
If you remove whatever costs that go up you will obviously create an imaginary EBITDA which will always grow.
ESOP cost is part of employee cost. If the high profile employees did not get ESOP they would not have joined the company and they would not have put the effort to grow sales in the first place.
If you did not acquire companies the growth would have been lower. If you remove the amortization then you should remove the acquired companies sales contribution also.
Most experienced investors will see through this, but this is highly misleading to newbies!
Amortisation is not like Depreciation. Hard assets are depreciated over their useful life time. Post that the value of asset becomes zero. And rightly so.
In case of Amortisation, the value of acquired asset… instead of depreciating, actually appreciates over its life time.
So when amortisation is charged from P&L account, the company gets a tax break and the value of acquired asset or brands keeps growing. So, its a win win for the company.
On ESOP, I believe it would be charged only for Q1. So from Q2 onwards, the company should get the full benefit of operating leverage on the increased sales.
Regards,
Ranvir Dehal
This sounds like a catastrophic news for domestic branded generic players. Requesting views from senior Valuepickrs…
Regards,
Ranvir Dehal
This is proposed many times in the past, but not implemented. This time also it may be the same case. I pesonally dont think such a thing will be possible in near future. I may be wrong.
Drs have first hand information on how effective the medicine was on the patient. So they have a choice and knowledge of knowing which brand works better. Secondly, if generic name is prescribed the patient will be at the mercy of chemist on what is to be given to patient. Which may not be right. So in my view, it may not happen in near future.
Pharma companies promote their product through Drs using various means like gifting, education, training, event sponsorship, etc. They will resort to same policy with chemist, so if the intent is to eradicate this practice, the objective will not be met.
A sector level question. With such strict scrutiny of incentives to physicians how do these MR dependent companies drive sales. Will events and conferences suffice for incentivizing the doctor to write our brand?
Further how do they track productivity of a MR, where do they get data that a particular MR drove sales. Earlier it used to be area wise where shops of an area would report higher sales, indicating MR efforts. But now with online ordering, how do they track.
“JB Pharma delivered a good quarter driven by focused execution.
Our domestic business continued its growth trajectory through strong momentum in
our chronic portfolio and acquired assets. Our big brands, especially in chronic segment,
continue to outpace the market and have reached new milestones. CDMO business
scaled further during the quarter and the healthy momentum continues for this
segment too.
EBITDA margins improved during the quarter on account of better business mix,
increased efficiencies in sourcing, and higher volumes. The first quarter has been a
robust performance both in terms of topline and operating profit, and we remain
positive about delivering on our business objectives. We will maintain our distinctive
focus on India and the CDMO business, while maintaining our efforts to control costs &
increase efficiencies across the organisation.”
To track the productivity of MRs, companies often use a combination of methods. Traditional methods like area-wise sales reports still apply to some extent, especially in physical stores. However, with the rise of online ordering, companies are utilizing digital tools and data analytics to track sales trends and identify the impact of specific MR efforts. They may analyze data from online orders, prescription patterns, and customer feedback to gauge the effectiveness of MR interactions.
In this digital age, technology allows companies to gain insights into which MR interactions are driving sales, even in the online landscape. This could involve tracking customer conversions, monitoring changes in prescription rates, and analyzing correlations between MR engagement and product purchases. Overall, the landscape is evolving, requiring companies to combine traditional and digital methods to measure the success of MR strategies in driving sales.
This is how MR system works in USA. However they hv backend data availability /collection very much streamlined largely due to structure of business and dominant health insurance industry.
My daughter being in India, used to decide entire routine/schedule of comany MRs on daily basis based on certain KPIs and Algos.

Does Anyone knows how can we get access to IQVIA database. Is it chargeable? what’s the price?
JB Chemicals -
Q2 FY25 results and concall highlights -
Revenues - 1001 vs 882 cr, up 13 pc
Gross margins @ 66.2 pc - flat YoY
EBITDA - 285 vs 251 cr, up 13 pc ( margins flat yoy @ 28.5 pc )
PAT - 175 vs 151 cr, up 16 pc ( due reduction in finance costs from 10 cr to 2cr due sharp reduction in gross debt )
Gross Debt @ 82 cr vs 357 cr on 31 Mar
Cash on Books @ 421 cr
Capex spends for H1 FY 25 @ 49 cr
Breakdown of Q2 revenues -
Domestic formulations - 588 cr, up 22 pc ( excluding the Opthal portfolio acquired in Jan 25, YoY growth was at 12 pc vs IPM growth of 7 pc ). Domestic business now constitutes 59 pc of revenues vs 55 pc at the end of Sep 24. Cilacar, Cilacar-T, Metrogyl, Sporolac, Nicardia, Rantac, Razel - company’s leading brands continue to do well. The acquired Othalmology portfolio ( from Novartis ) grew by 19 pc - @ 57 vs 48 cr YoY. Company has a dedicated field force of 100 + MRs for this division
International formulations - 300 cr, up 14 pc. South Africa and US business registered double digit growths. Russian business grew in high single digits
CMO - 94 cr, down 19 pc - due deferment of orders from Q2 to Q3. Expect to see strong Q3 and Q4 for the CMO division
APIs - 19 cr, down 20 pc
Company’s mix of Chronic : Acute sales in domestic mkt at 48:52 vs 37:63 in Mar 19. Chronic share has been inching up year after year
Company’s 5 brands ( Cilacar, Rantac, Metrogyl, Cilacar-T, Nicardia ) feature in top 150 brands in India. Their brand wise annual sales are as follows -
Cilacar ( Anti - Hypertensive ) - 431 cr
Rantac ( Antacid ) - 359 cr
Metrogyl ( Anti-Bacterial ) - 218 cr
Cilacar -T ( Anti - Hypertensive ) - 199 cr
Nicardia ( Anti - Hypertensive ) - 189 cr
Their fast growing emerging brands include - Sporolac ( probiotic ), Azmarda ( used to treat chronic heart failure ), Razel ( used for management of dislipidemia ) and the portfolio of Ophthalmology brands acquired from Novartis ( currently generating an annual sales run rate > 200 cr ). Razel and Sporolac brands have started clocking annual sales of 90 cr and 135 cr respectively
Current MR strength @ 2300+. MR productivity @ Rs 7 lakh + per month
Company is among the top 5 Contract manufacturer of Lozenges in the world. Annual CMO sales are > 430 cr. Expected to be a high growth area
Company’s manufacturing facilities are located @ Panoli ( Gujarat ) - 03 facilities, Ankleshwar ( Gujarat ) - 01 facility and Daman - 01 facility
Excluding the Ophthalmology portfolio, Gross margins improved by 100 bps ( 1 pc ) in Q2 vs Q2 LY ( as the Opthal portfolio has structurally lower margins )
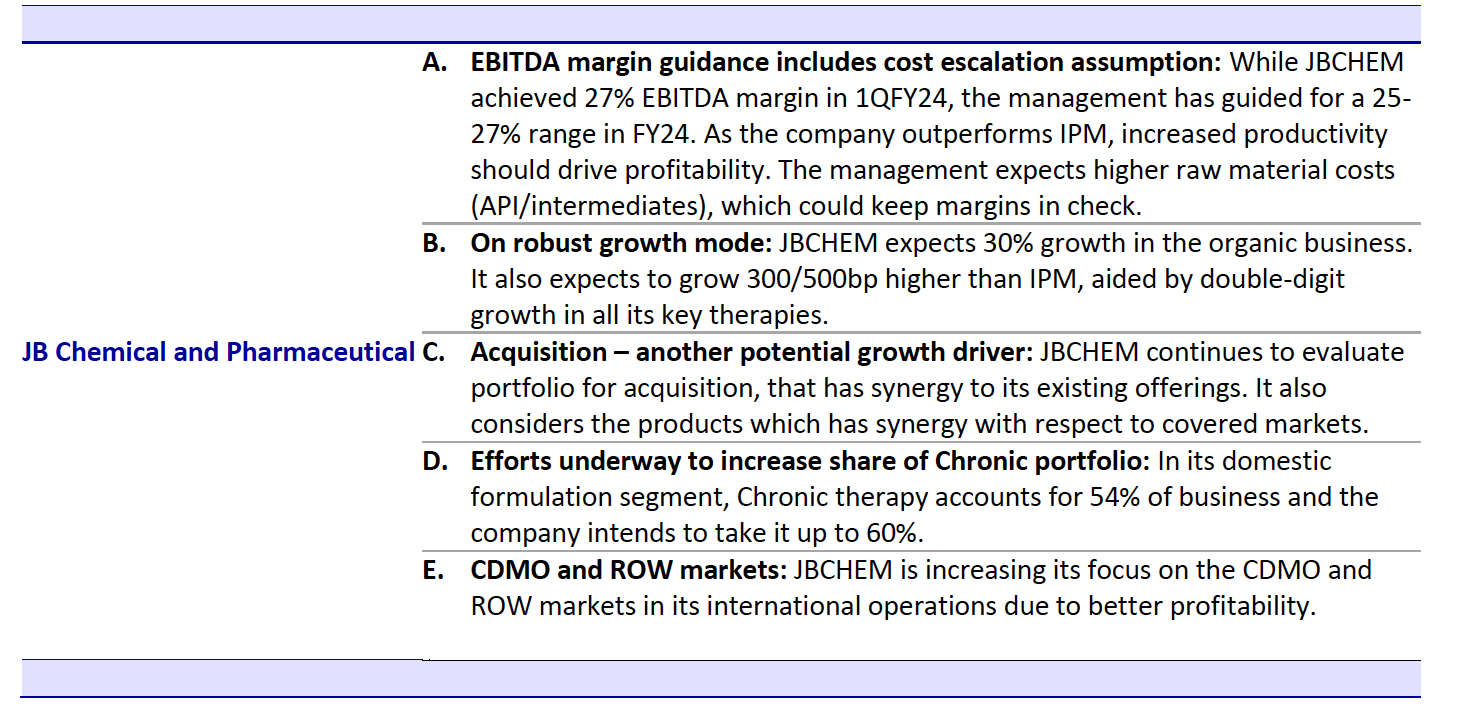
Guiding for full year EBITDA margin band of 26-28 pc for FY 25 ( FY 24 margins were at 26 pc )
Expect the CMO business to reach $ 100 million ( from $ 50 million currently ) annual run rate in 3-5 yrs timeframe. Seeing good business momentum in this segment
Azmarda continues to grow strongly. Should be able to grow this brand @ mid teen rate in the foreseeable future. Razel brand is growing at even higher rates
India business’s volume growth in Q2 was 5 pc vs flattish volume growth for IPM
Capex spends lined up for H2 @ 50-55 cr
When the company acquired Othal - branded portfolio of Novartis India, they were covering aprox 6k ophthalmologists. Company has expanded that coverage to 13k+ ophthalmologists and plan to take it to 16k+ by next FY - this is again a high growth portfolio for the company
Metrogyl franchise ( ie Metrogyl + brand extensions ) is growing in high single digits. Rantac franchise is growing in low single digits
Despite being big brands, Cilacar + Cilacar T continue to grow volumes @ 12-14 pc for last 3-4 yrs
Company has lined up a lot of new product launches ( aprox 20 products ) in the branded generics space for SA + Russia mkts - beginning Q3 next FY. This should accelerate the growth in these geographies in FY 26, 27
Continue to participate in the 2000 cr probiotics mkt with their brand - Sporolac. This is a high growth area. Expecting Sporolac franchise ( ie Sporolac + brand extensions ) to keep growing in healthy double digits
Company has lined up a couple of Injectable products and a throat spray product to be launched under their CMO division
Disc: holding, biased, not SEBI registered, not a buy/sell recommendation
JB Chemicals -
Q4 and FY 25 results and concall highlights -
Q4 outcomes -
Revenues - 949 vs 862 cr
Gross margins @ 66.1 vs 65.2 pc
EBITDA - 226 vs 198 cr, up 14 pc ( margins @ 23.8 vs 22.9 pc )
PAT - 146 vs 126 cr, up 15 pc
Gross margins expanded despite good performance of In-Licensed Opthal portfolio which has limited margins
Domestic formulations ( grew by 11 pc ) and CDMO portfolio continue to grow strongly. In Q4, even the Russian and RoW business witnessed good recovery
FY 25 outcomes -
Revenues - 3918 vs 3484 cr, up 12 pc
Gross margins @ 66.4 vs 66.1 pc
EBITDA - 1032 vs 897 cr, up 15 pc ( margins @ 26.3 vs 25.7 pc )
PAT - 660 vs 553 cr, up 19 pc
In FY 25, domestic sales increased 20 pc !!! Excluding Opthal portfolio, domestic sales grew by 13 pc
International business grew by 4 pc ( led by double digit growth in branded generics exports to RoW and Russian business )
CDMO business grew strongly in H2
India business + CMO businesses have the highest gross margins. Together, they contribute to 70 pc of company’s sales at present. In next 2-3 yrs, company aims to ramp up these two businesses to 80 pc of company’s total business
Not planning to meaningfully add MRs in next 12-18 months. Current strength of MRs is enough to carry forward company’s growth in near term. Current filed force @ 2800 MRs. Monthly field force productivity @ 8 lakh
Company is extremely bullish wrt their CMO business for next 1-2 yrs. Expecting 3-4 new projects to start kicking off wef next FY. Company will even have to incur capex in order to service these projects (although the quantum of capex is not heavy )
Net Cash @ 689 cr vs 107 cr YoY
Segmental performance -
Domestic business -
Revenues - 2269 vs 1897 cr, up 20 pc. Volumes grew by 13 pc including Othal portfolio and 6 pc excluding Opthal portfolio
Chronic business recorded an 18 pc YoY growth
Brand wise annual sales for FY 25 -
Cilacar + Variants - 785 cr
Razel - 99 cr
Metrogyl + Variants - 342 cr
Sporolac - 134 cr
Nicardia - 205 cr
Rantac + Variants - 427 cr
Azmarda - 70 cr
International business -
Revenues @ 1649 cr, up 4 pc
Breakup -
International formulations - 1128 cr, up 6 pc ( led by Russia, RoW. US business was a drag )
CDMO - 446 cr, up 3 pc ( due weakness in H1 ). Have won a few global contracts which are likely to be commercialised in next 12-18 months
APIs - 76 cr, down 12 pc
Chronic : Acute sales in domestic business @ 47:53
Company now cover 3.5 lakh doctors across specialities in India
At present, company has 25 brands with revenues > 20 cr in India
Company has raised its EBITDA margin guidance to 27-29 pc for FY 26 !!! ( ex of ESOPs )
Cilacar, Razel, Nicardia, Azmarda, Sporolac - are all high growth brands - augurs very well for the company
Company expects its International formulation business to grow @ around 10 pc in FY 26 and in low teens wef FY 27
CDMO / CMO ( Lozenges ) business grew by 18 pc in Q4. Going to enter CMO of ORS, throat sprays by end of FY 26. Once all the new products ramp up ( say in 2 yrs ), CDMO business should be able to clock annual sales of 600 cr vs 450 cr presently
Aim to ramp up Azmarda’s sales to > 100 cr in next 2 yrs
65 pc of India business sales come from top 5-6 brands. Most of these r in high growth areas
Acute therapies have performed @ suboptimal levels in the IPM for last 2 yrs. If the season is favourable and acute therapies pick up, IPM’s volume growth is expected to pick up from 1-2 pc to 4-5 pc
In Dec 27, the company shall become the full fledged custodians of the in-licensed Opthal portfolio that it had acquired. After that, the GMs and Operating margins of this portfolio shall bump up significantly
Compay is open to buying out brands / companies I the range of 1-1.5X their current EBITDA ( that works out to be 1000-1500 cr ). However, the acquisition has to be a strategic fit + should be present in high growth areas
Their Opthal business is currently clocking sales of 180 cr / yr. Should keep growing in mid-teens in for next 2-3 yrs
Wef FY 28, the gross margins in their Opthal business shall jump from 20 pc ( currently ) to > 60 pc. This should lead to a massive EBITDA expansion wrt the Opthal portfolio
Disc: holding, biased, not SEBI registered, not a buy/sell recommendation