
These two articles in morningstar has answers to your queries
2 Likes
Dear members - could someone please advise on how to organise the financials of stocks you’re tracking on your PC. I know screener provides a method to download the excel - are there better alternatives. And could someone please provide a sample on how do you go about saving such info.
Thanks so much in advance.
Regards,
Mohit
Sir, the links are not working
I have a basic question regarding working capital changes in Cash Flow Statement. I was looking at the balance sheet of Jamna Auto and found that the Total Receivables for the year ended 2012 is 12879.50 compared to 13108.75 back in 2011.
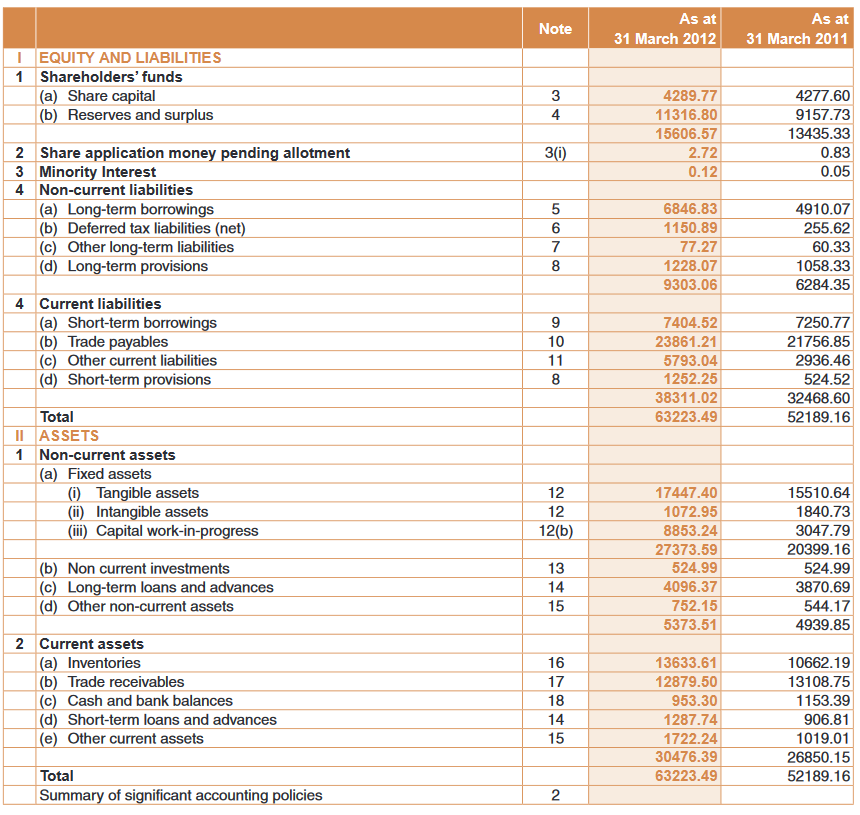
However, in the Cash flow statement, in Cash Flow from Operating activities under changes in working capital section, the “Change in Trade Receivables” is a different number.
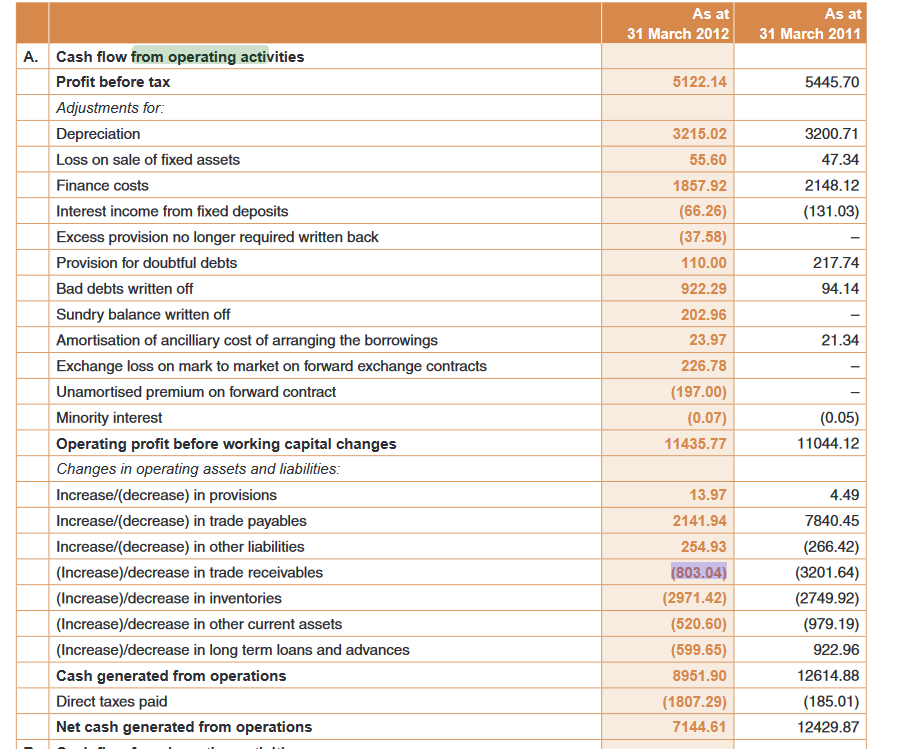
I am under the assumption that the change in receivables in the balance sheet should match the change in receivables in the cash flow statement. Why does this discrepancy occur?
Has this been accounted under Provision for Doubtful debts and Bad debts written off? Because that does seem to match
Hello Everyone,
Wanted to check a small thing, and request to please flag this post if this has been answered somewhere. A lot of emphasis(rightly or wrongly) is placed on PE ratios. I wanted to understand which value is used for calculating PE ratio for a stock, in terms of the time when the value is picked up.
For example, the current PE ratio of Nifty is showing as 23.77, does that mean the earnings for FY20 have been taken into account? What if some companies have not announced Q4 results yet? Same with stocks.
The reason to check this also is, that from my basic understanding, earnings for Q1FY21 will be a washout, and that would mean the denominator of the PE ratio reducing a lot, thus leading to a huge spike in the PE ratio, which in turn should have the P part normalise to some extent. My guess is no amount of liquidty would let stocks get to triple digit PE levels(while some stocks are already there) and hence some correction should be in store at that time. But when would the Q1 earnings reflect in the PE ratio for a stock? or the index for that matter.
Please correct the error in my understanding, wherever made. Thanks.
Hi All,
Glad that this forum exists and thankful to the moderators who have also created this space for asking basic investing questions…
My question is on the valuation of Banco Products
Current Market cap (493Cr) is lower than the Reserves and Surplus (710 Cr)
Growth could be a concern however i dont think company has any cash flow concerns since Current Assets(excluding inventories) is arnd 400Cr while the current liabilities is 318Cr
So even if the company is going to shut down, the current stock price appears to be cheap.
Kindly guide if i maybe making a mistake here…
Thanks & Regards,
Mayank
It is not that a company that reports loss will have -ve or zero market cap. Earnings does not matter if the dip in earnings is temporary and especially when all is aware of the reason for dip. There are other metrics like P/B and GDP/market cap to value NIFTY but metrics like P/E and dividend yield won’t hold good for FY21.
But then if the ratio has to hold good for FY22, wont it have to normalise in FY22? Meaning that if the P keeps growing in FY21 because everyone knows the reason, then either the price growth of the stock/index slows/reduces in FY22 to balance the ratio out someday.
Otherwise we are all in a Ponzi scheme where availibility of money is all that matters, and as long as we have FED or other investors to buy at whatever price, prices will keep on increasing indefinitely.
ur initial question was related to FY20 (which is now 23.77 as u mentioned) or FY21 nifty P/E and my opinion is not to consider valuation based on P/E as u have interpreted but other metrics since E can drastically change in specific period. I neither mentioned FY22 will be good nor that current nifty valuation is fair. If one in buying right now (in a pandemic), then he/she should be concerned about FY30+.
1 Like
Understood. Thank you.
@Donald @phreakv6 @ayushmit How do you process the information that is present during conference calls and in Annual reports? If you have any template for these, could you please share it with us.
Hi folks,
This is a very simple question. I thought of creating a separate thread for it, but it didn’t really seem worth it. This seems to be a catch-all thread, so i thought I would put it here. If this is unsuitable/inappropriate, let me know what I should do instead.
This is a simple question about the meaning of some fields in a share price chart. I was watching the NSE Cipla price at market close on Friday 19th June 2020. Right at the end, like 10/15 minutes before closing, around 3.15/3.20, it went down to around 632 or so. Then it started climbing very fast, and at the close at 3.30 it was at 645. Now, look at the graph of the NSE’s CIpla page.
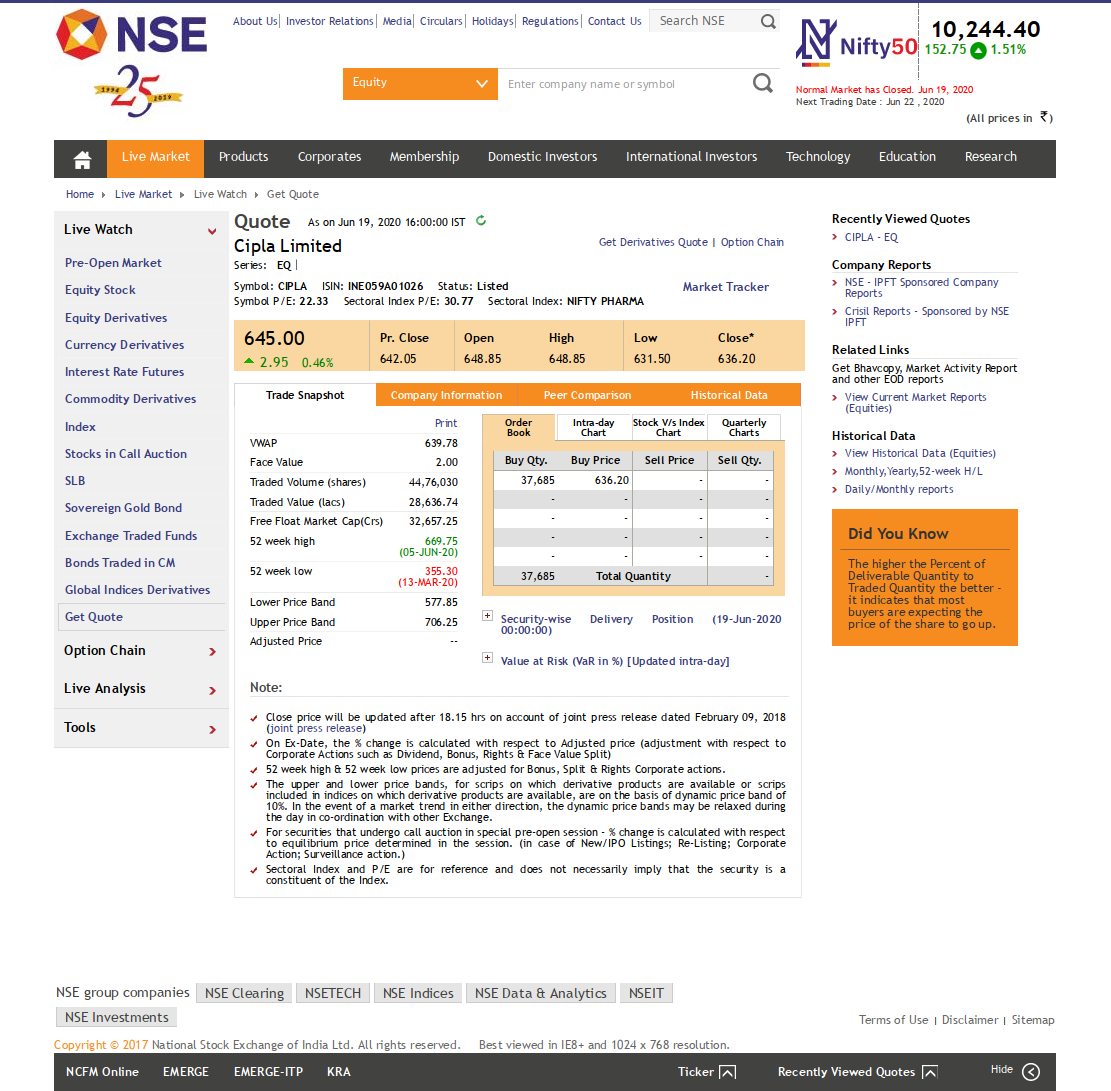
As you can see, the number of the far left in bold is 645. However, the Close value is given as 636.20. At 3.30 that Close value was blank, and appeared later in the day. I think I checked after 6/7 pm on Friday, and it was there then.
First question: if 645 isn’t the closing value, what is it? And if 636.20 is the closing value, why wasn’t that the number showing at the closing? Maybe are the trades had not been updated yet, but doesn’t that happen in real time?
In the notes, it says:
Close price will be updated after 18.15 hrs on account of joint press release dated February 09, 2018 (joint press release)
That’s a broken link. Apparently NSE can’t be bothered to keep its links up to date. The correct link is https://archives.nseindia.com/content/press/PR_cc_21022018.pdf. They should update it.
However, this notice appears to be largely content-free, and references a press release dated February 9, 2018, which I have been unable to locate. If anyone can find it, I’d like to look at it.
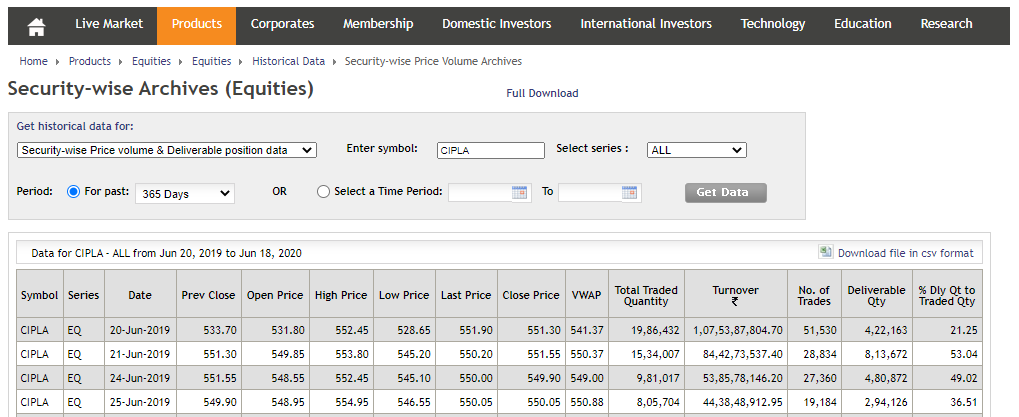
An additional unrelated question: is it possible to see the delivery volume or percentage on the NSE web site? Because I have not found it yet.
Last Traded Price is exactly what the term indicates – the last trade in the stock happened at that price. Closing Price has a different definition. On NSE, is the volume weighted average price of the stock in the last half an hour’s trading.
1 Like
Hi guys,
My question is:
How does the nifty or bank nifty(or any other index for that matter) change when the underlyings do not change in premarket?
I went through this link of NSE explaining the premarket functions:
What is Pre-open using call auction?
So the indicative equilibrium price in one/many/all index stocks cause the change in the index price in premarket. Am i right? Or am I missing something?
Thanks in advance
Hi @Chandragupta,
Thank you for the explanation. I did find a confirmation of sorts on the Zerodha web site, on Why is there a difference between last traded price and closing price on NSE?. I’ll quote the entire thing, in case it is removed or deleted. It’s quite short.
The Last traded price (LTP) usually differs from the closing price of the day. This because the closing price of the day on NSE is the weighted average price of the last 30 mins of trading. Last traded price of the day is the actual last traded price.
Due to this the LTP will not match the close on the daily charts either as the close on the daily candle is updated using the close from NSE bhavcopy.
The difference is usually more if the market is moving around quite a bit in the last 30 mins.
However, I could not find this information anywhere on the NSE site, though I spent some looking. Does anyone know where it is? And perhaps more importantly, which is closing price defined in this way? I could not find any justification or explanation for this elsewhere on the net.
Also, can anyone locate the 9th February 2018 circular? I’d like to see it. And also:
Because I’d like an answer to that.
I use the old NSE website and this is where you will find it:
https://www1.nseindia.com/products/content/equities/equities/eq_security.htm
1 Like
Hi @Chandragupta,
Thank you. That’s very helpful. But I wonder why it is not visible on the new site. Is the information just not there, or is it well hidden?
I have a hopefully quick question about some odd behavior I observed in the market with Cipla stock between Friday 19th June and Monday 22nd June.
Near closing on Friday, around 3.15 pm, it was trading around 632. Then it suddenly started climbing very fast, and when the market closed at 3.30 pm it as at 645. But that’s not the odd part.
My broker called me on Monday morning around 9 am (pre-opening) to tell me that the pre-opening price was 699. However, when the markets opened it was 696/691 (BSE/NSE). It then started to drop very fast as people sold the shares, and within 15 minutes it was around 670. It then dropped further and then oscillated slightly above 660 for awhile before closing around 656.
I don’t really understand what was going on here. First, I don’t know how trading outside the normal trading hours works. But apparently enough shares were traded to drive the price to nearly 700. But when the markets opened, why did the share price drop so fast? In other words, during pre-trading there was mostly buying, and after the markets opened it was mostly selling? This doesn’t make sense to me. If one wanted to sell the shares are 699 or whatever the pre-opening price was, could one have? And if one could, how could the price get as high as 699 if there were so many people who wanted to sell, as clearly there were based on how quickly the price dropped during trading hours?
BTW, my broker was amusingly optimistic about the share price. He asked me if I wanted to sell at 710 to start with. I told him that the share price would certainly fall after opening, though I didn’t expect it to fall so fast. But my experience of finance professionals in India (I don’t have experience anywhere else) is that they don’t seem to have any more of a clue what is going on than anyone else.
This isn’t central to the question, but if anyone can explain to me trading works outside normal trading hours, that would be helpful. And I realise this isn’t exactly an investing question, but how the markets work is relevant to investing.
1 Like
Most of these sharp few day movements are driven due to some big player traping the retail players like us… Watch the movie “Bazaar”… coming to Cipla and this particular movement, could be due to initially expectations of some big announcement (hence the price rise during pre-trade) and then when it got delayed and hence the drop… maybe, we can just speculate on this…
If someone has any other points pls add…
Hey, I wanted someone experienced to clarify, can large cap give good returns?
many of my peers tell me not to go for Eicher & ITC as they cannot be multi-bagger.
What would be your advise?
(My investing period is long term…but I want to be financially independent in next 10 years)