As you must know that EBITDA does not contain Interest, Taxes, Depreciation and Amortisation.
Now Operating here means that the earnings are from the core operations of the business and does not include any earning from company’s investing or any financial activities other than its actual business
This will tell how effective is the company in its actual business
AS
some companies try to show increased earnings from selling of assets or other investing activities, which are not included in operating EBITDA
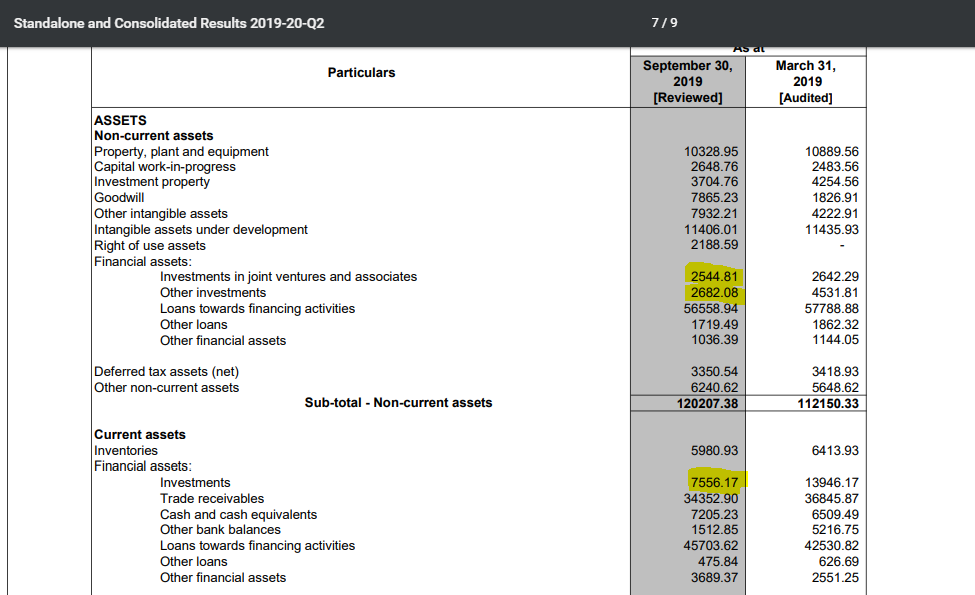
You will have to check the notes to accounts for ‘Other Financial Assets’ to see how liquid they are. Unfortunately, that will only be available on the Annual Report. Even so, if you look at the last Annual Report, you can get an idea of the composition of ‘Other Financial Assets’:
It is up to your judgement how you want to treat them. Generally, if it looks related to the business (Ex: Advance to Related Parties, Receivables), I don’t include it in Liquid Cash/Assets.
HDFC AMC is subsidiary of HDFC Ltd. So when HDFC AMC declares dividend (after paying taxes on profit), Do HDFC Ltd need to pay taxes on Dividend received also?
Kotak AMC is subsidiary of Kotak Bank. Now Kotak AMC makes some profits and Kotak bank want to use it by lending it to it’s customer. Do kotak bank need to pay any tax on transfer of AMC profit to it’s book?
So basically I would like to know if kotak bank ia enjoying any tax benefit by keeping Kotak AMC as 100% private subsidiary over HDFC Ltd.
From the forum discussion above I understand some companies are always available only at higher PE historically. (Also have bought many at high PE). I saw an example of some company bought at 30PE as it was always in that range.
1.But is DCF model relevant or stands good if we have decided to pay in accordance with historical PE.
2. If DCF model is applied I think we shall never invest in stocks more than 15 PE as the Treasury yield now is 6%.
Is my assumption correct
Thanks in advance for your help
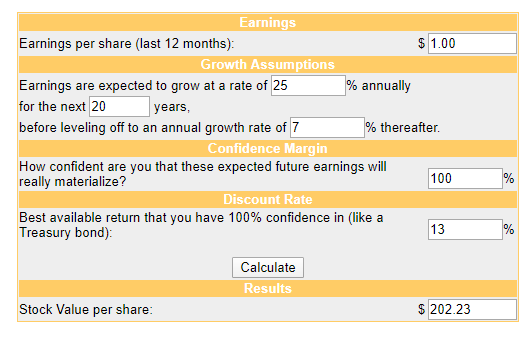
Here are my assumptions (I will explain why later):
EPS is 1
25% Growth for 20 Years
7% Growth thereafter
No Margin of Safety
13% Discounting (About the average Cost of Capital for Indian firms)
Here is the answer:
This hypothetical company is roughly worth 202.23 P/E (Since our “E” is just 1).
But - here’s the catch. According to MOSL’s Wealth Creation Studies, only 1-2 companies in India have ever grown consistently over 20% (Say) for decades or beyond. Size impedes Growth. We cannot expect Hinustan Unilever Limited to grow at the same rate as, say, Godrej Consumer Products. HUL’s “runway” (In MOSL’s words again) is constrained solely owing to its massive size.
So a company having a 200 P/E and still being undervalued is a highly unlikely event. You can try to experiment with different growth numbers and growth periods, but this is the gist of it.
Dear Mr Tamal
you need to open new demat account as current dematn cant be made joint. then you have to transfer existing shares through off market deal to new demat account. this involves some minor costs, but in the overall context it is worth doing
regards
Also I was doing the profitablity matrix as per Five rules by Pat Dorsey. which ROE and FCF should I use. should I use the latest or use average of last 10 years.
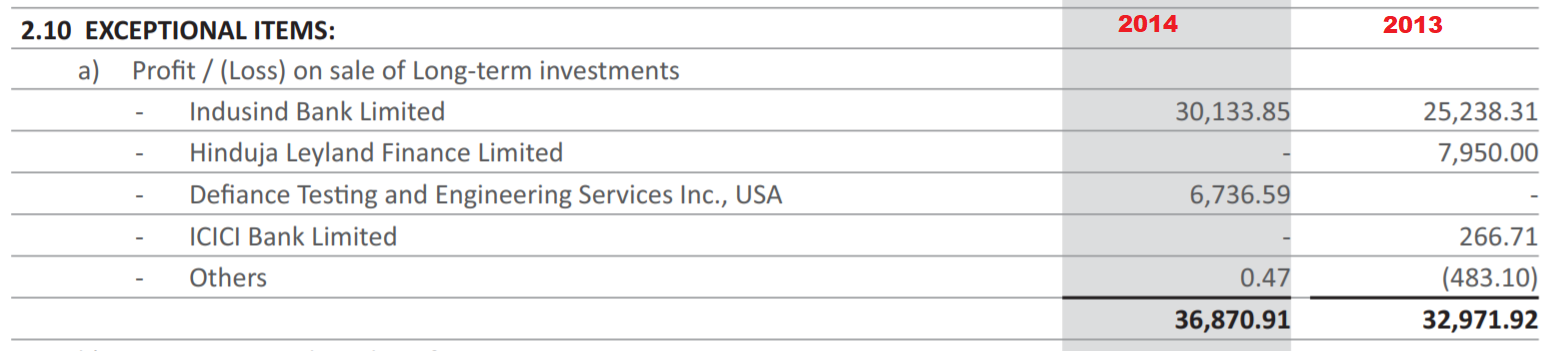
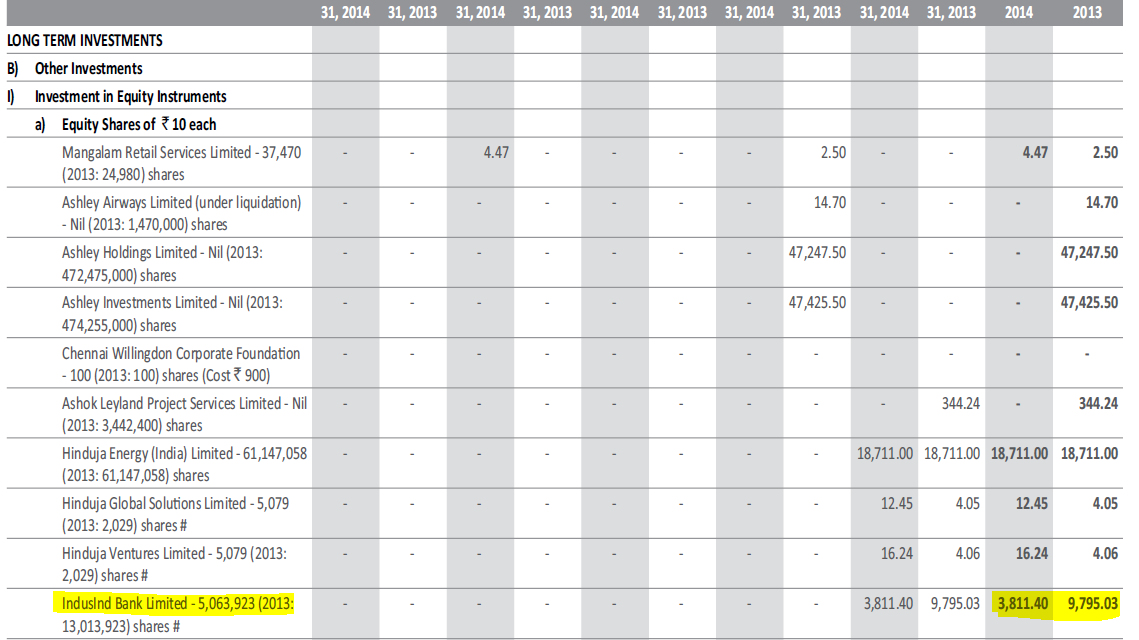
The corresponding entry in the Long Term Investments section (AR 2014, Page 67) shows that the investments reduced from 9795.03 Lakhs in year 2013 to 3811.40 Lakhs in year 2014. This is a reduction of 5983.63 Lakhs.
Can someone please explain me these figures? Are the investments mentioned in the Long Term Investments section represented at the acquisition cost or fair value?
Thanks for sharing the link @dineshssairam sir. I also tried using Dr. Ashwath Damodaran’s DCF model excel template from your blog but being a non-finance guy, it was a pretty daunting task to scan the annual reports and put the numbers in the model.
One thing which I am not able to understand in DCF models is the assumption of growth rate - what should be rationale used to assume growth rate? Being invested in a company might make me a bit biased on growth projections Eager to know what methodology you use to assume growth. I am assuming growth rate means profit growth. Please correct me if I am wrong.
Not just Growth, for any projection make sure whatever you are assuming ties back to reality. There are certain checks you can keep for Sales Growth:
Self Sustainable Growth (The rate at a which a company can grow without raising new funds - so sort of like an upper limit for growth)
Industry Growth Vs Company Growth - Historical (See how the company has done historically vs the industry and judge whether they will continue to do that)
Market Share (If the industry is not growing too much and you use high growth rates for your own company - soon it will take up 100% of the market - which is improbable. Make sure for all the years of projection, you can justify the Market Share)
Historical Growth: History doesn’t repeat, but it does rhyme. Historical growth is a good place to start, but not the be-all and end-all of projection.
Management Commentary: Take these with a pinch of salt. But I generally like to use management commentary to try and see I am not far outside what they are trying to do. When I valued D-Mart for instance, I worked backwards from Capital Invested (Which is a function of Sales in my model) and figured out that the Store Growth per Year will likely touch 19 for the next decade - which is also what the management is aiming to achieve.
Business History: For instance according to MoSL, only a handful of companies have grown at 20%+ for more than a decade in India business history. So if you are breaching those limits, be careful - because that brings us to…
Size: Size impedes Growth. HUL cannot grow at the same rate as GCPL solely owing to the sheer size of their operations. If you’re dealing with a behemoth, you may want to hold back on the Growth optimism.
Economics: If your company is growing at more than the Risk-free Rate for multiple decades, it will become larger than the country itself (Think about it). So for longer than 10-15 years of projections, moderate your Growth towards the Risk-free Rate in the country.
The idea is to start somewhere (Like Historical Growth), have checks (SSG, Market Share, Industry Growth, Size, Business History) and end up justifying the final figures with something grounded in reality (Management Commentary, Competitor’s Commentary/action, Economics).
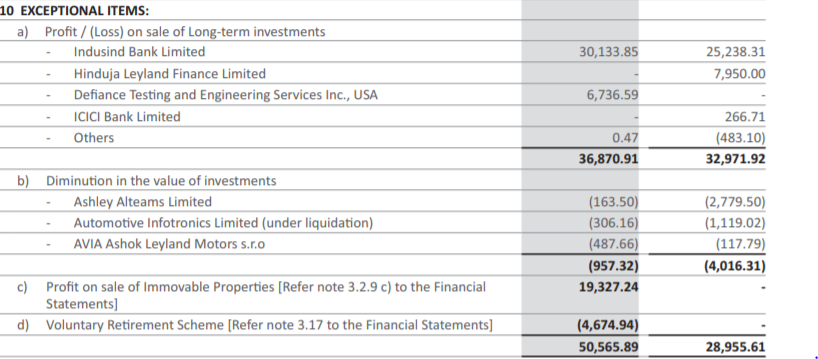
I saw this, when you compare with indusind"s share price at 2011 it looks like the acquisition price. and 2014 in the exceptional item they have shown the profit from sales of indusind shares as below
Also just something to add from my side… Promoters of IndusInd Bank and Promoters of IndusInd Bank are closely related so I think it’s better not to have a good conclusion out of these profits…
I think the sale was to reduce promoter holding to meet RBI regulation. this year they have again applied to increase promoter stake quoting Kotaks’ case.
Please excuse my ignorance but where can one find information on upcoming bonus issues of shares, a little bit in advance? Which public sources to track?