Investing Basics - Feel free to ask the most basic questions

Hi,
Is there any way to calculate New high new low index indicator to find market breadth. Any website provides it?
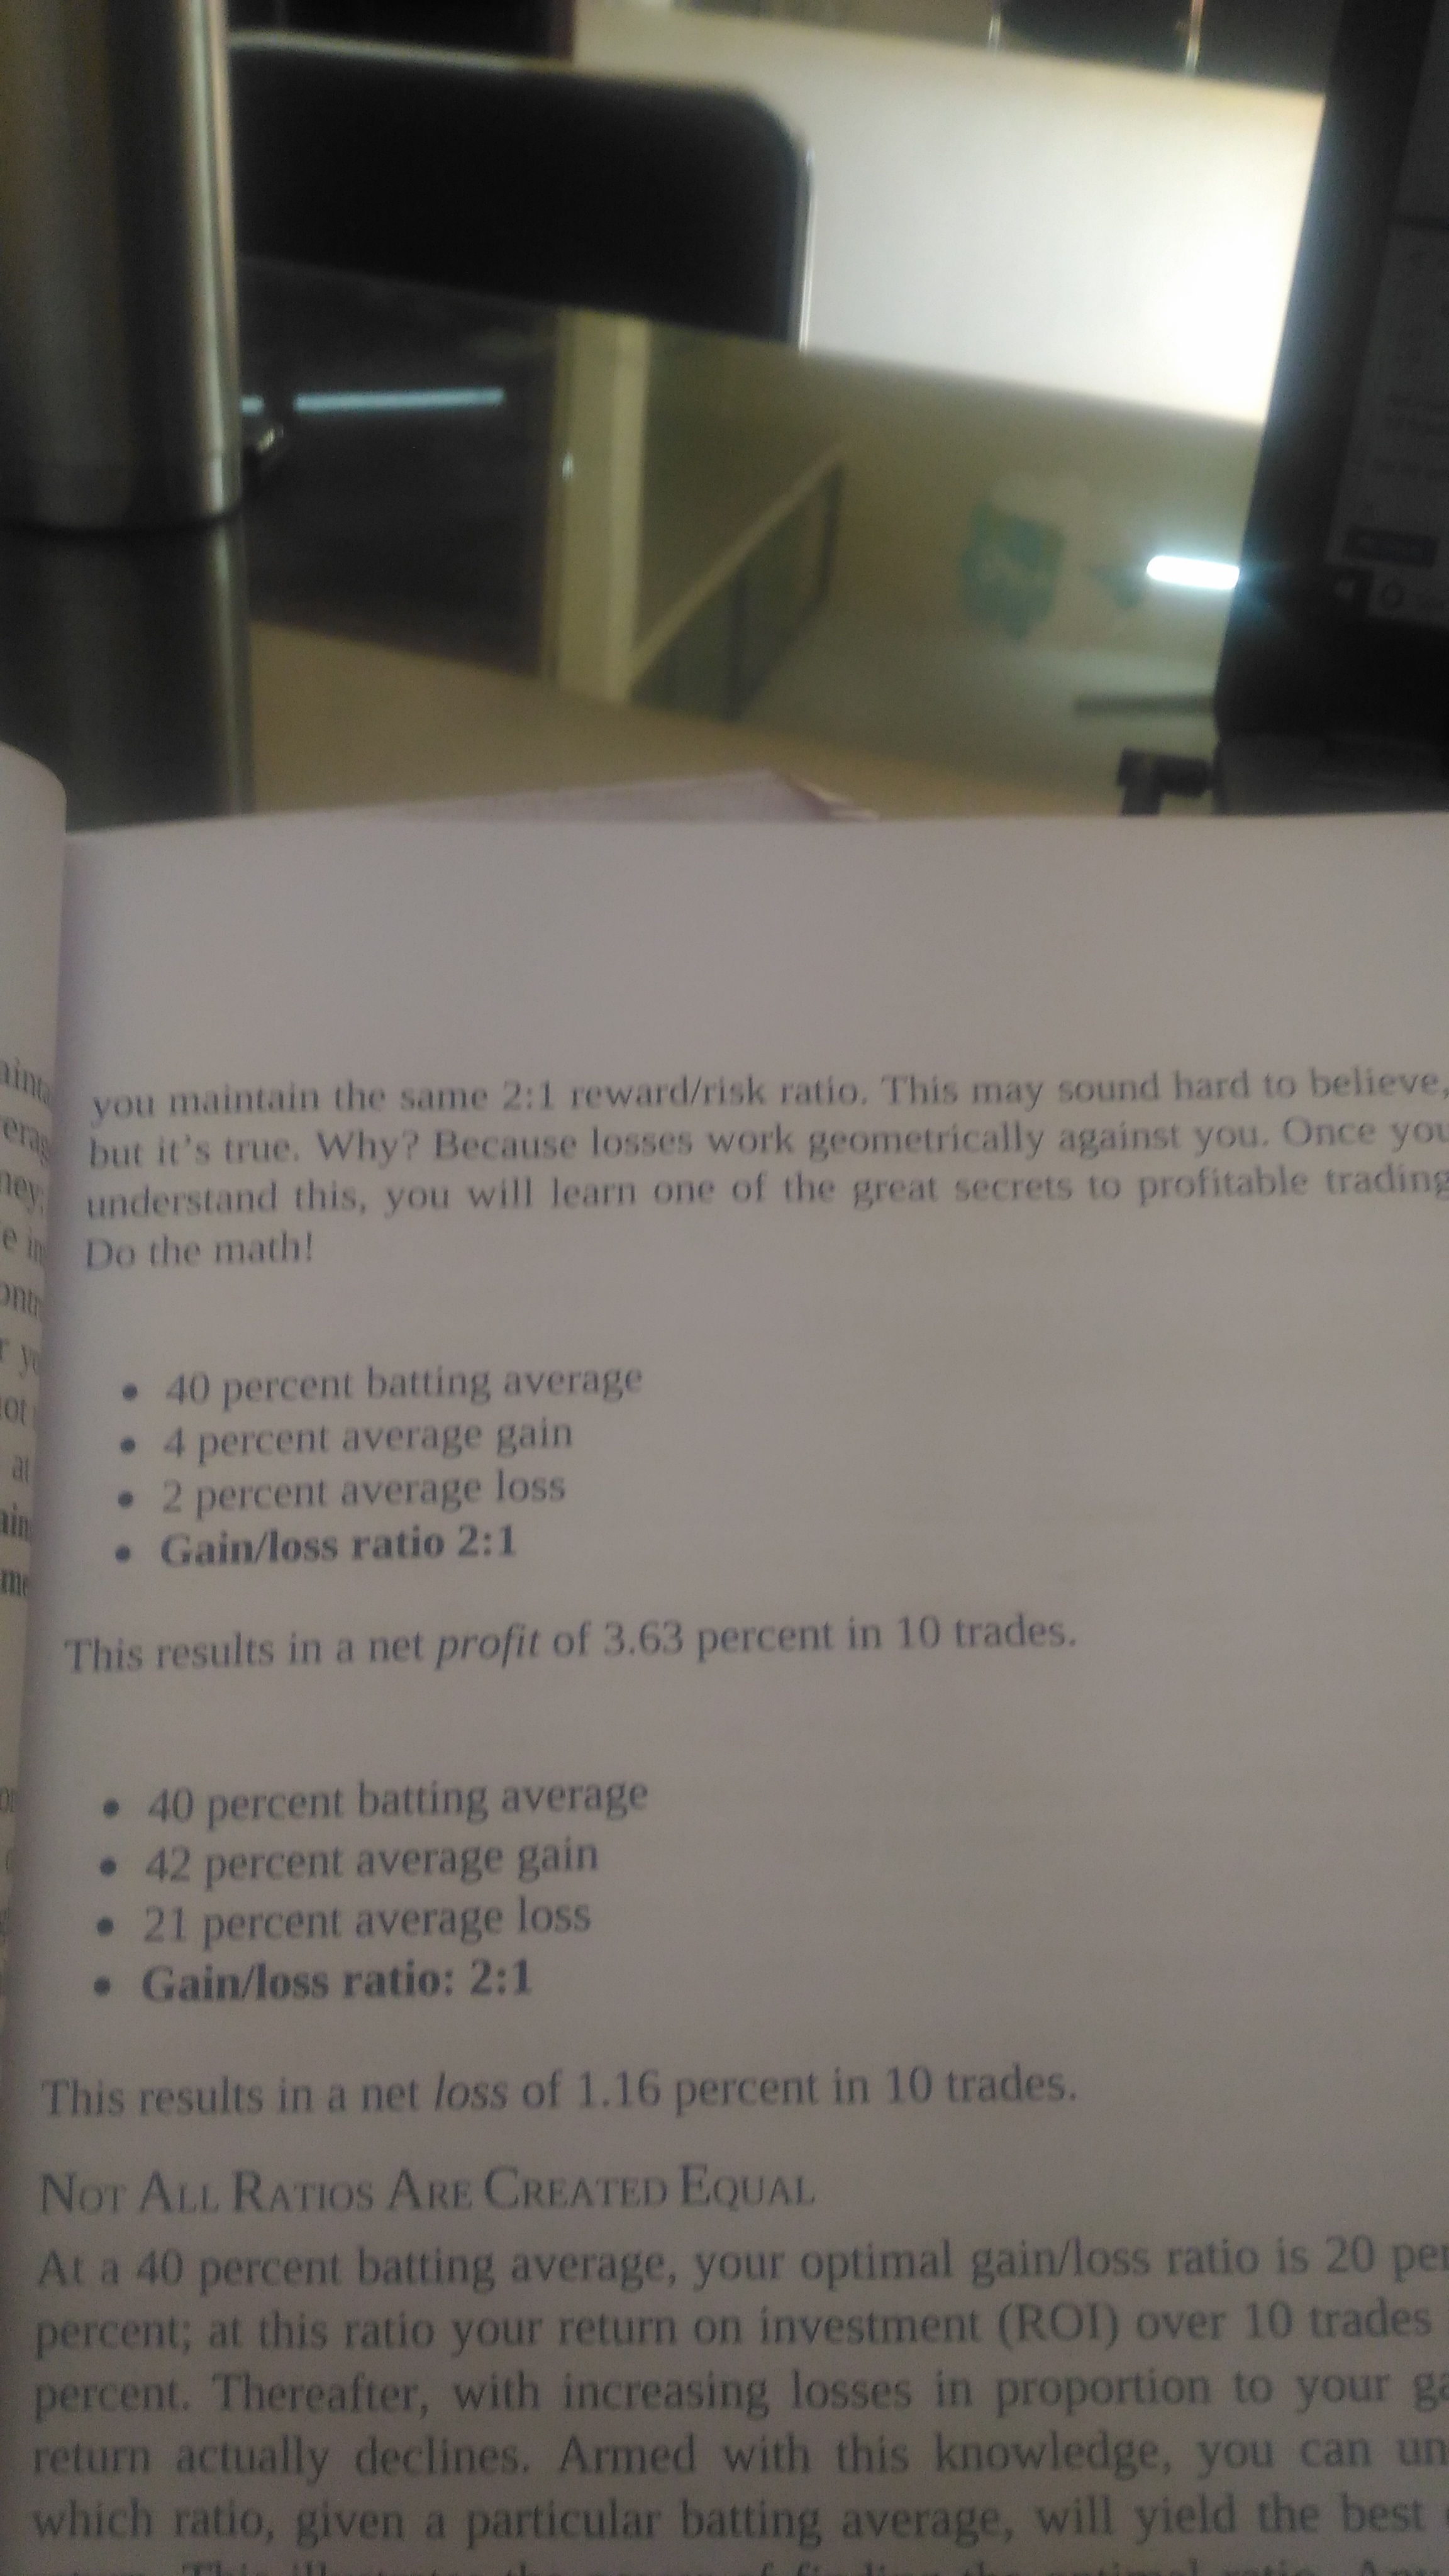
This indicator from Elder Alexander books look intriguing. Tried checking this in different platforms but couldn’t succeed. Or is it thatonly way to plot is taking it directly from NSE or BSE website and calculate it manually?

Could anyone please let me know.

Any direction would be of great help!

Thanks,
Krishna

1 Like

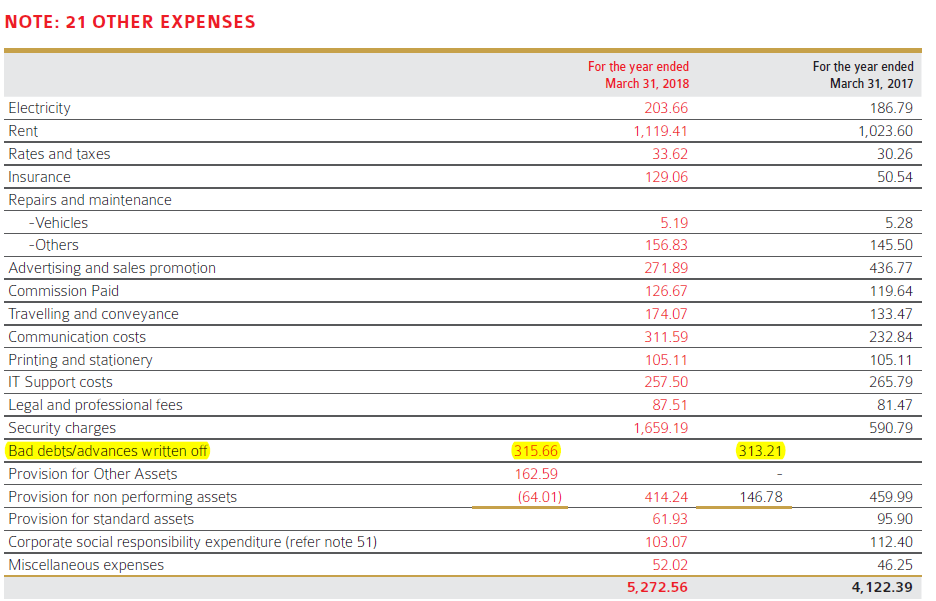
I am trying to understand how NPAs are added/deducted and how Bad debts are written off from P&L during a particular year. For instance take following notes from an NBFC.

Here Bad debts/advances written off is 315.66. How do they come to this figure?

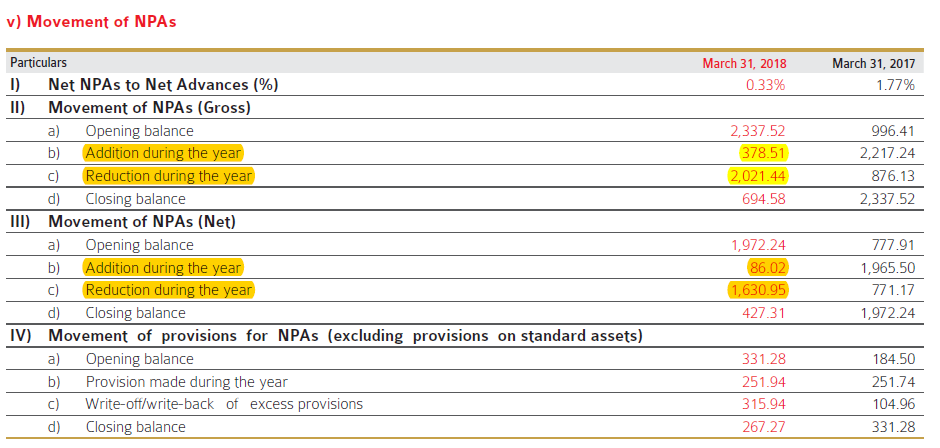
Another note regarding movement of NPAs below. How NPAs are added and deducted during the year? Any norms for that or is that just as mgmt wishes to deduct/add during the year. I understand that closing balance is summation of net NPAs(sub standard+doubtful+loss assets) which is also the opening balance of next year.

Video on Moats by Pat Dorsey.Found it pretty useful

3 Likes

The link of basics are not working?

Need help.
currently i am reading Mark Minnervini’s Book and i have one doubt.

In the book, the author has done following calculation:
40% batting average (i.e 40% win in the trade)
42%average gain
21% average loss

Result: net loss of 1.16% in 10 trades

i just couldn’t figure out the result, as per my calculation:
let you trade 100 rs for 10 times with 40%batting average then

a. 100 + 42%gain =142
b. 142
c. 142
d. 142
e. 100-loss of 21%=79
f. 79
g.79
h. 79
i.79
j.79

Net Profit/Loss: (424)-(216)=168-126=42
net %gain=42/1000=4.2%

But the author is reporting loss of 1.16%; HOW?

here is the screenshotP_20181101_135629

@dineshssairam @hitesh2710
please let me know if you have understood the concept

This is the calculation:

Trade N0. Amount Gain/Loss %
0 100
1 142 42
2 201.64 42
3 286.3288 42
4 406.586896 42
5 321.2036478 -21
6 253.7508818 -21
7 200.4631966 -21
8 158.3659253 -21
9 125.109081 -21
10 98.836174 -21

The gain in 4 trades is average of 42% and loss in 6 trades is average of 21 %. Final amount is 98.83 which is 100-98.83=1.16% loss

Should one add costs such as - Brokerage & Tax incurred (while buying the stock) to the Cost of purchase of a stock or only the terminal price paid should be considered while measuring one’s portfolio performance & calculating capital gains tax (after selling the stock)…

These are two different things – calculating capital gains for income tax purpose and calculating portfolio performance for personal review.

For income tax purpose, all costs directly attributable to the purchase or sale of the share can be adjusted, such as brokerage or transaction charges except STT. You can easily google for this information since this is straight away as per Income Tax law.

If you are a DIY retail investor and doing a personal performance review, I think you should include not only the direct costs given above but ALL costs related to your investing activity itself, such as annual demat charges, subscription to magazines, paid services, websites etc. if any and so on. After deducting all of these, one should be able to beat the average equity mutual fund at least, then only it is worth investing directly in the markets.

2 Likes

Shared by @Prdnt_investor in Twitter
History of Corporate misadventures
http://prdntinvestor.blogspot.com/2018/11/history-of-corporate-misadventures-in.html?m=1

1 Like

How does one subscribe to an NCD? I am trying to subscribe to the manappuram NCD, but I am unable to figure out how. Thanks for your time!

1 Like

I am trying to calculate ROA & ROE from Maithan Alloy’s Financial Statements

Maithan Alloys

Page 147 - Net Income 29180.11 Lakhs
Page 146 - Assets 121196.33 Lakhs

ROA = Net Income/Assets = 29180.11/121196.33 = 24.07%

Page 146 - Total Equity 86838.02 Lakhs

Financial Leverage = Assets/Shareholder’s Equity = 121196.33/86838.02 = 1.4

ROE = ROA * Financial Leverage = 24.07 * 1.4 = 33.69%

MyROA = 24.07%
MyROE = 33.69%

But when I look at screener.in’s figures
https://www.screener.in/company/MAITHANALL/

Screener’s ROA = 37.10%
Screener’s ROE = 40.48%

So what am I doing wrong?

Trying to do an Intrinsic Value Calculation using Pat Dorsey’s method for Maithan Alloys

Free Cash Flow for 2017-18 was 272 crores. I am assuming a 5% growth in FCF for 10 years using 12% as the discounting rate

Year FCF Present Value
1 286 255.36
2 300.3 239.40
3 315.32 224.43
4 331.08 210.41
5 347.63 197.26
6 365.02 184.93
7 383.27 173.37
8 402.43 162.54
9 422.55 152.38
10 443.68 142.85

Using 3% as long term growth rate, calculating the Perpetuity Value

Perpetuity Value = (443.68 * 1.03)/(0.12 - 0.03) = 5077.67

Present value of perpetuity value = 1634.87

Total PV of FCF + PV of Perpetuity Value = 3577.79

Outstanding shares = 2.9 crores

Intrinsic Value = 3577.79/2.9 = Rs. 1233.72

Screener.in’s Intrinsic Value = Rs. 189
https://www.screener.in/company/MAITHANALL/

I know that they may have used a different formula but can the result vary so much? Or am I doing some mistake in my calculations?

How to see intrinsic value in screener?

You can download the data using “Export the excel” feature, and see the formula they have used in the sheet.

Just use the Add Quick Ratio box . Using it you can search for and add predefined ratios ( or even your own custom ratios that you defined earlier) . BTW, You need to login to use this feature.

I have used it but how do we get a intrinsic value? do we need to write some formula?

Please just type the text “intrinsic value” in the Add Quick Ratio box.

2 Likes

If 2017-18 fcf is 272 then how you have come to fcf 630 in the first year

Click on Add Quick Ratio & add Intrinsic Value

1 Like