I wish to calculate my monthly and yearly returns where I can compare it with different indices. Although it is easy to calculate indices return as one has to take start and end value but how do I do it for my portfolio where there is a continuous inflow/outflow of money.
How do I do it in excel or any other s/w available for this?
Every Large and small banks publish their Investor presentations, where they mention all the key parameters…You can go through it. In HDFC Bank the Retail : Wholesale Mix is *55%:45% as of October 30, 2023.
There is a certain individual based in pune who offers stock advisory based on difference in expectation and actual earnings of indian companies. Recommendations are system based (not discretionary). Has a background in IT. Can’t recall the name. Can someone help, not able to recall.
This is not an ad :). I just wanted to check out.
Thanks
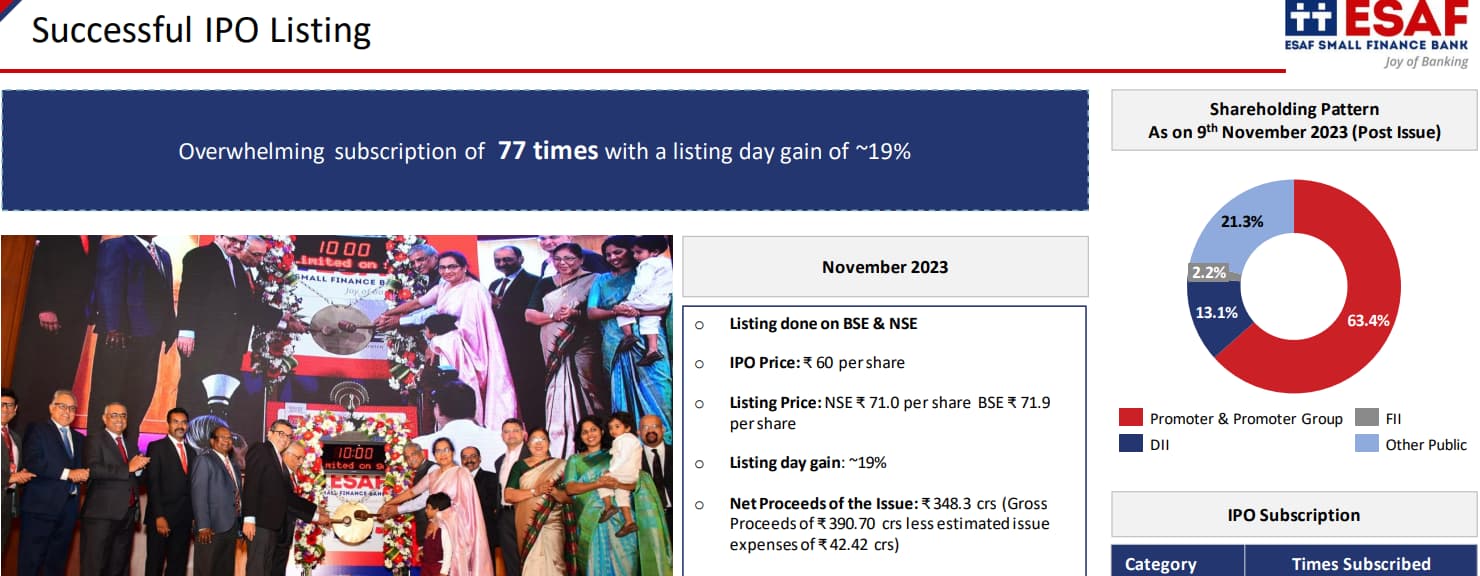
I was recently checking investor presentation of the ESAF bank. they raised 390 crores in fresh issue and also there are some selling shareholders. In this attached pic, it is mentioned issue expense is 42 crores for raising 390 crores. Almost 10% of fresh money went into the expense. I know during IPO there are lot of costs involved, but 42 crores is some mind boggling number. Is this is how all IPOs happen
Be that as it may, but I don’t think as minority shareholders we have a say in this. I mean, we cannot tell a management to not give dividend and go for buybacks.
Dividends excluding the tax structure, is real return, not necessarily comparable to price appreciation, but it is a return that we get on our investment. And some people expect a dividend from their investments, and some even if don’t expect want one, when a company has cash and has no immediate need for the cash. And some people exclusively buy some dividend stocks, they may or may not be concerned about the price appreciation, and overtime such stocks can take care of a portion of expenses too. And I think, dividend paying managements are perceived to be friendly to shareholders. There are a lot of angles to this.
I get some dividends from my investments and shorter term trades, in fact, I even check regularly for the credited dividends. So take my view with a pinch of salt.
There are some topics opened on this subject in the forum, you can check them if you are interested, where different perceptions and opinions are expressed.
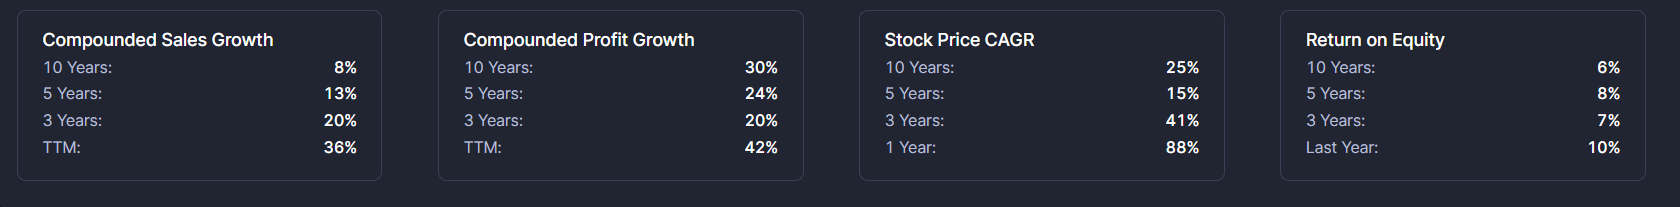
Let’s suppose a company sales growth is growing at 10 % and profit growth is 10% where as it’s stock price CAGR is growing at 40 % how do we draw conculsion about that stock. I just pasted one random example but what I am trying to understand is when company sales and profits are growing at 10% but it’s stock price is growing at 4 times than it’s profit growth. is there any relativity between all these three parameters or should I look at these independently.
I have heard QoQ earing per share increase with sales increase is a good indicator for future growth stock . How to identify this trend in initial phase .
It’s very basic question - you need to read some books.
Anyway, It means PE got expanded. In bull market PE gets expanded and in bear it gets contracted. Mean reversion may happen, it means even profit increases and PE contracts - price stuck there or come down.