
What is pre-ipo concept. Can anyone explain ?
Esitmated FY24 Net/EBITDA Ratio mentioned in Q4 presentation, ~2.5 times.
With assumed EBITDA of Rs 1100, and 2.6 time Net Debt/EBITDA ratio, Net Debt would be ~ Rs 2,860 Cr on 31 March 2024, as against Rs 3,121 cr as on 31 March 2023 (Q4FY23 presentation slide 35)
So that would provide Decline in net debt of ~ Rs 261 Cr as against anticipated EBITDA of Rs 1,100 Cr.
Hope this explain what query you had. In case further doubt, feel free to mention.
I am enclosing my working in excel in case you need to check formuals.

Calculation with Excel formula for above sheet enclosed for your reference.
Sterlite Tech Working July 2023.xlsx (9.6 KB)
2 Likes
How inventory buildup(finished goods) can improve my EBITDA margins?
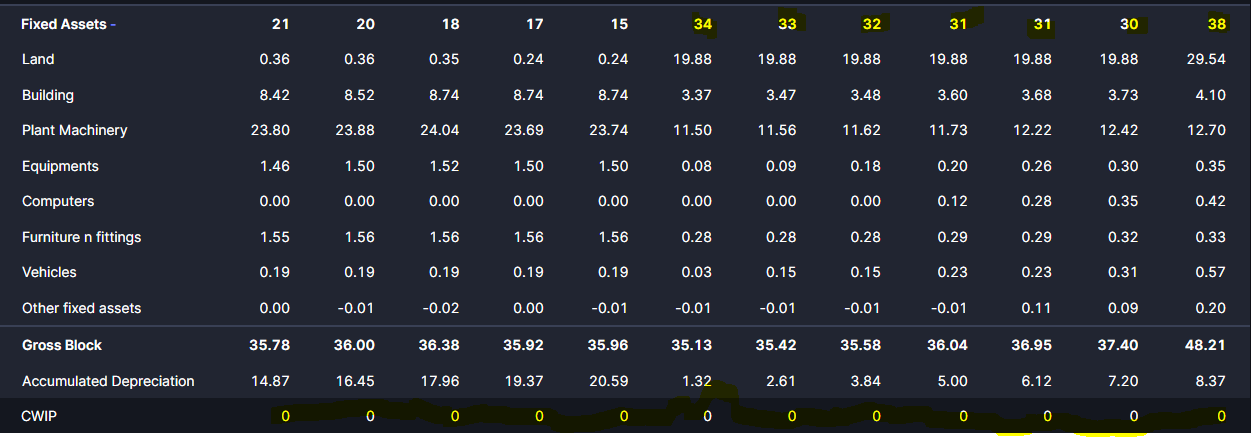
How is it that without showing money in CWIP directly fixed assets are purchased during the year.
Is it common based on business need company purchase assets which gets reflected in Balance sheet at year end ?
If yes then how to track it ? Do they file such info on Index ?
I don’t know if they have to be disclosed, but I think if the increase in assets has taken place in less than 12 months of the FY, CWIP will be 0.
You can check the filings for the whole year of the increase, if no such disclosures mare made, then check the quarterly results where the changes in assets have been mentioned.
@ankit_tripathi In the above exmaple, if one see break up of fixed assets addition, it is mostly in land. Generally, there is land purchase does not need amy improvement in caee it is developed and hence can be strigjt added to fixed assets without being going through capital work in progress. Capital work in progress would be applicable mostly for buidling and plant and machinery when comapny is implemeting large capex over more than 12 months. Even head like furniture and vehicle would be normally directly added to fixed assets as same can be used from day one after purchase and generally does not need any improvements. This is my understanding and may be wrong
4 Likes
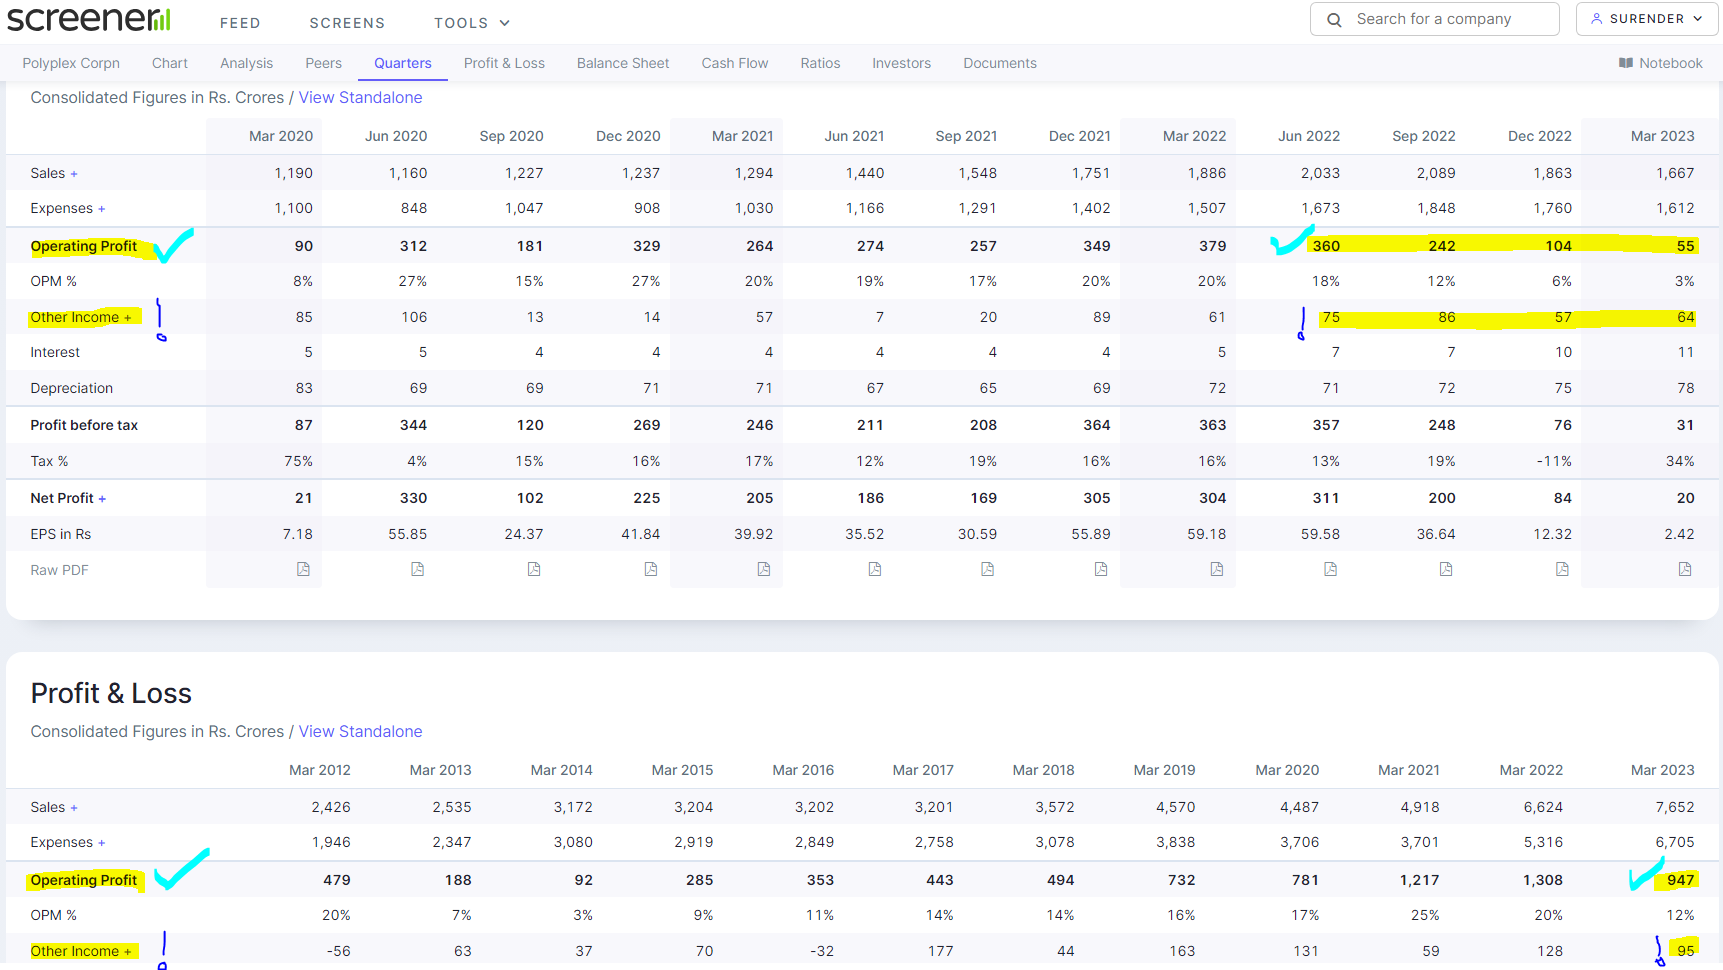
Business: Polyplex Corporation | Reconciliation of Quaterly and yearly Other Income and EBITDA:
- Why the sum of quarterly ‘Other Income (OI)’ higher than the yearly ‘OI’?
- Why the sum of quarterly ‘EBITDA’ lower than the yearly ‘EBITDA’?
Note: Total of sum of quarterly OI and EBITDA EQUALS to Total of yearly OI and EBITDA.
1 Like
I was going through the related party transaction page of FY22 Annual report of SP Apparels and had below doubt (Page 199)
-
What does Lease Rent Paid mean? Does this mean company is paying rent to Promoter ?
-
What does Lease liability paid mean?
-
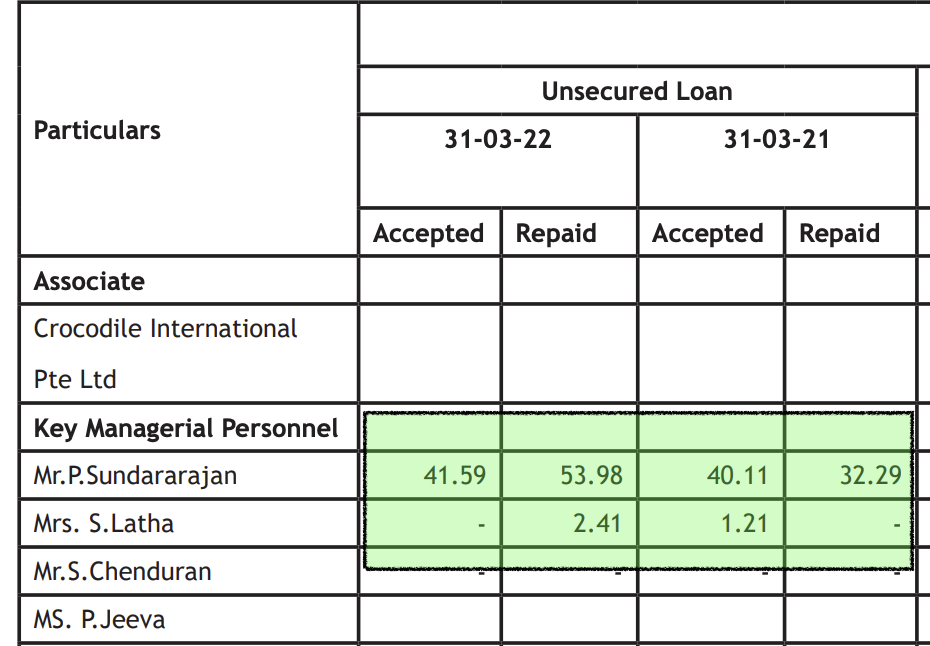
Does this unsecured loan paid by company to promoter or vice versa?
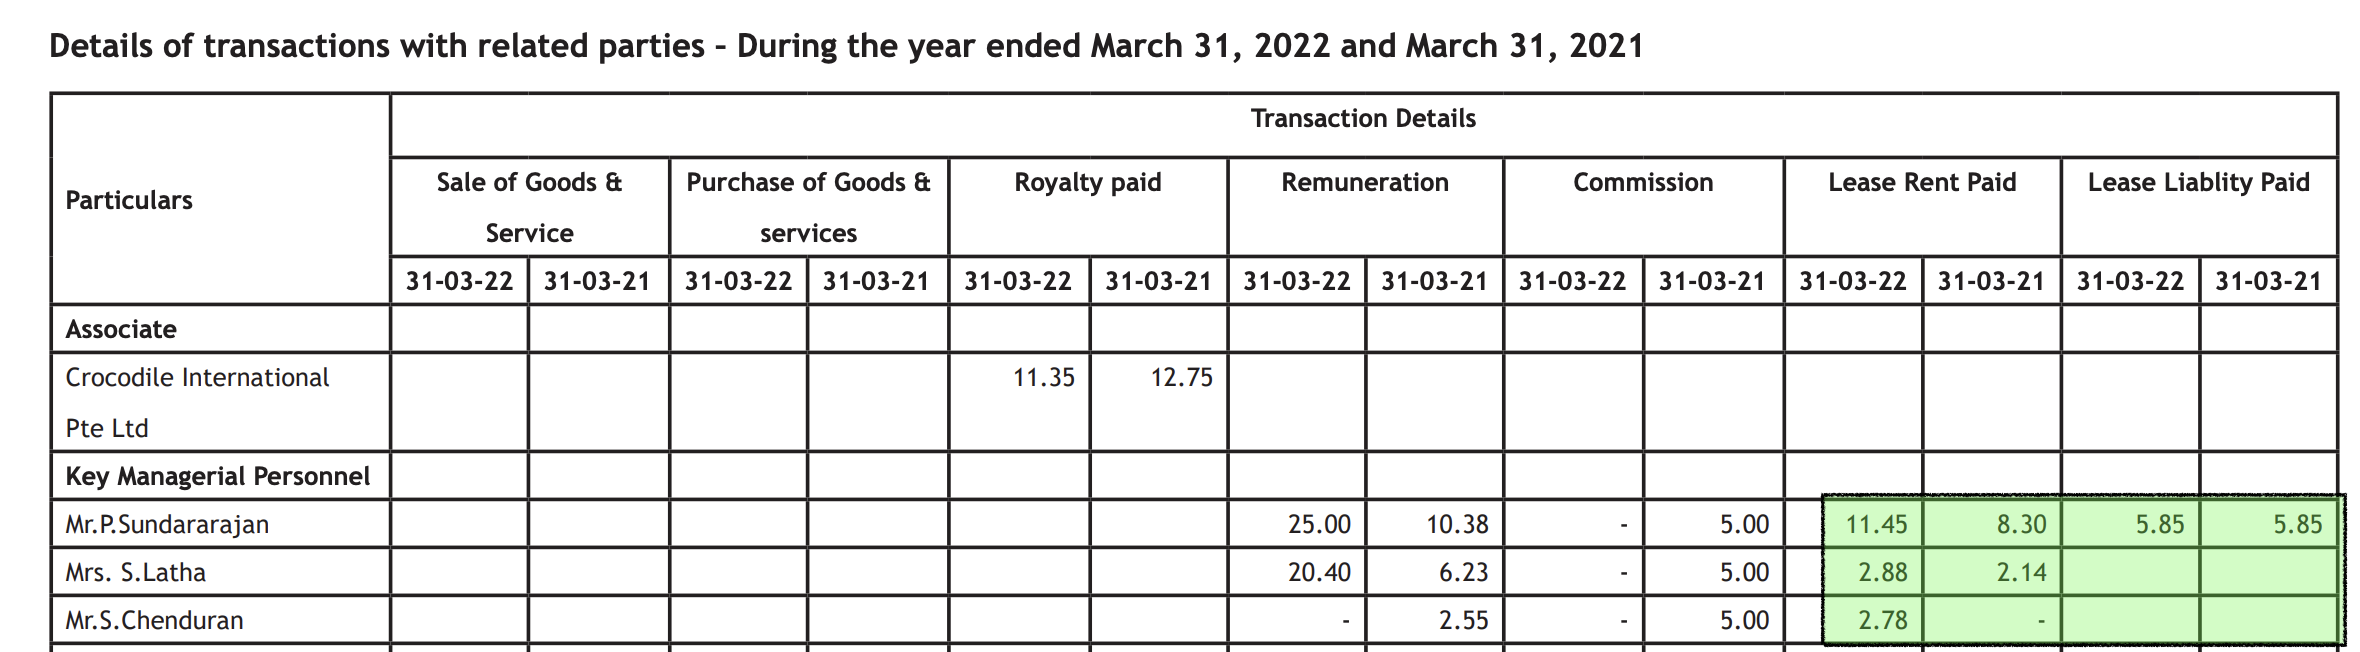
4.What does lease liability worth 259.98 mean ( last row in image) ? Is SP Apparel paying this amount as lease liability to subsidiary company
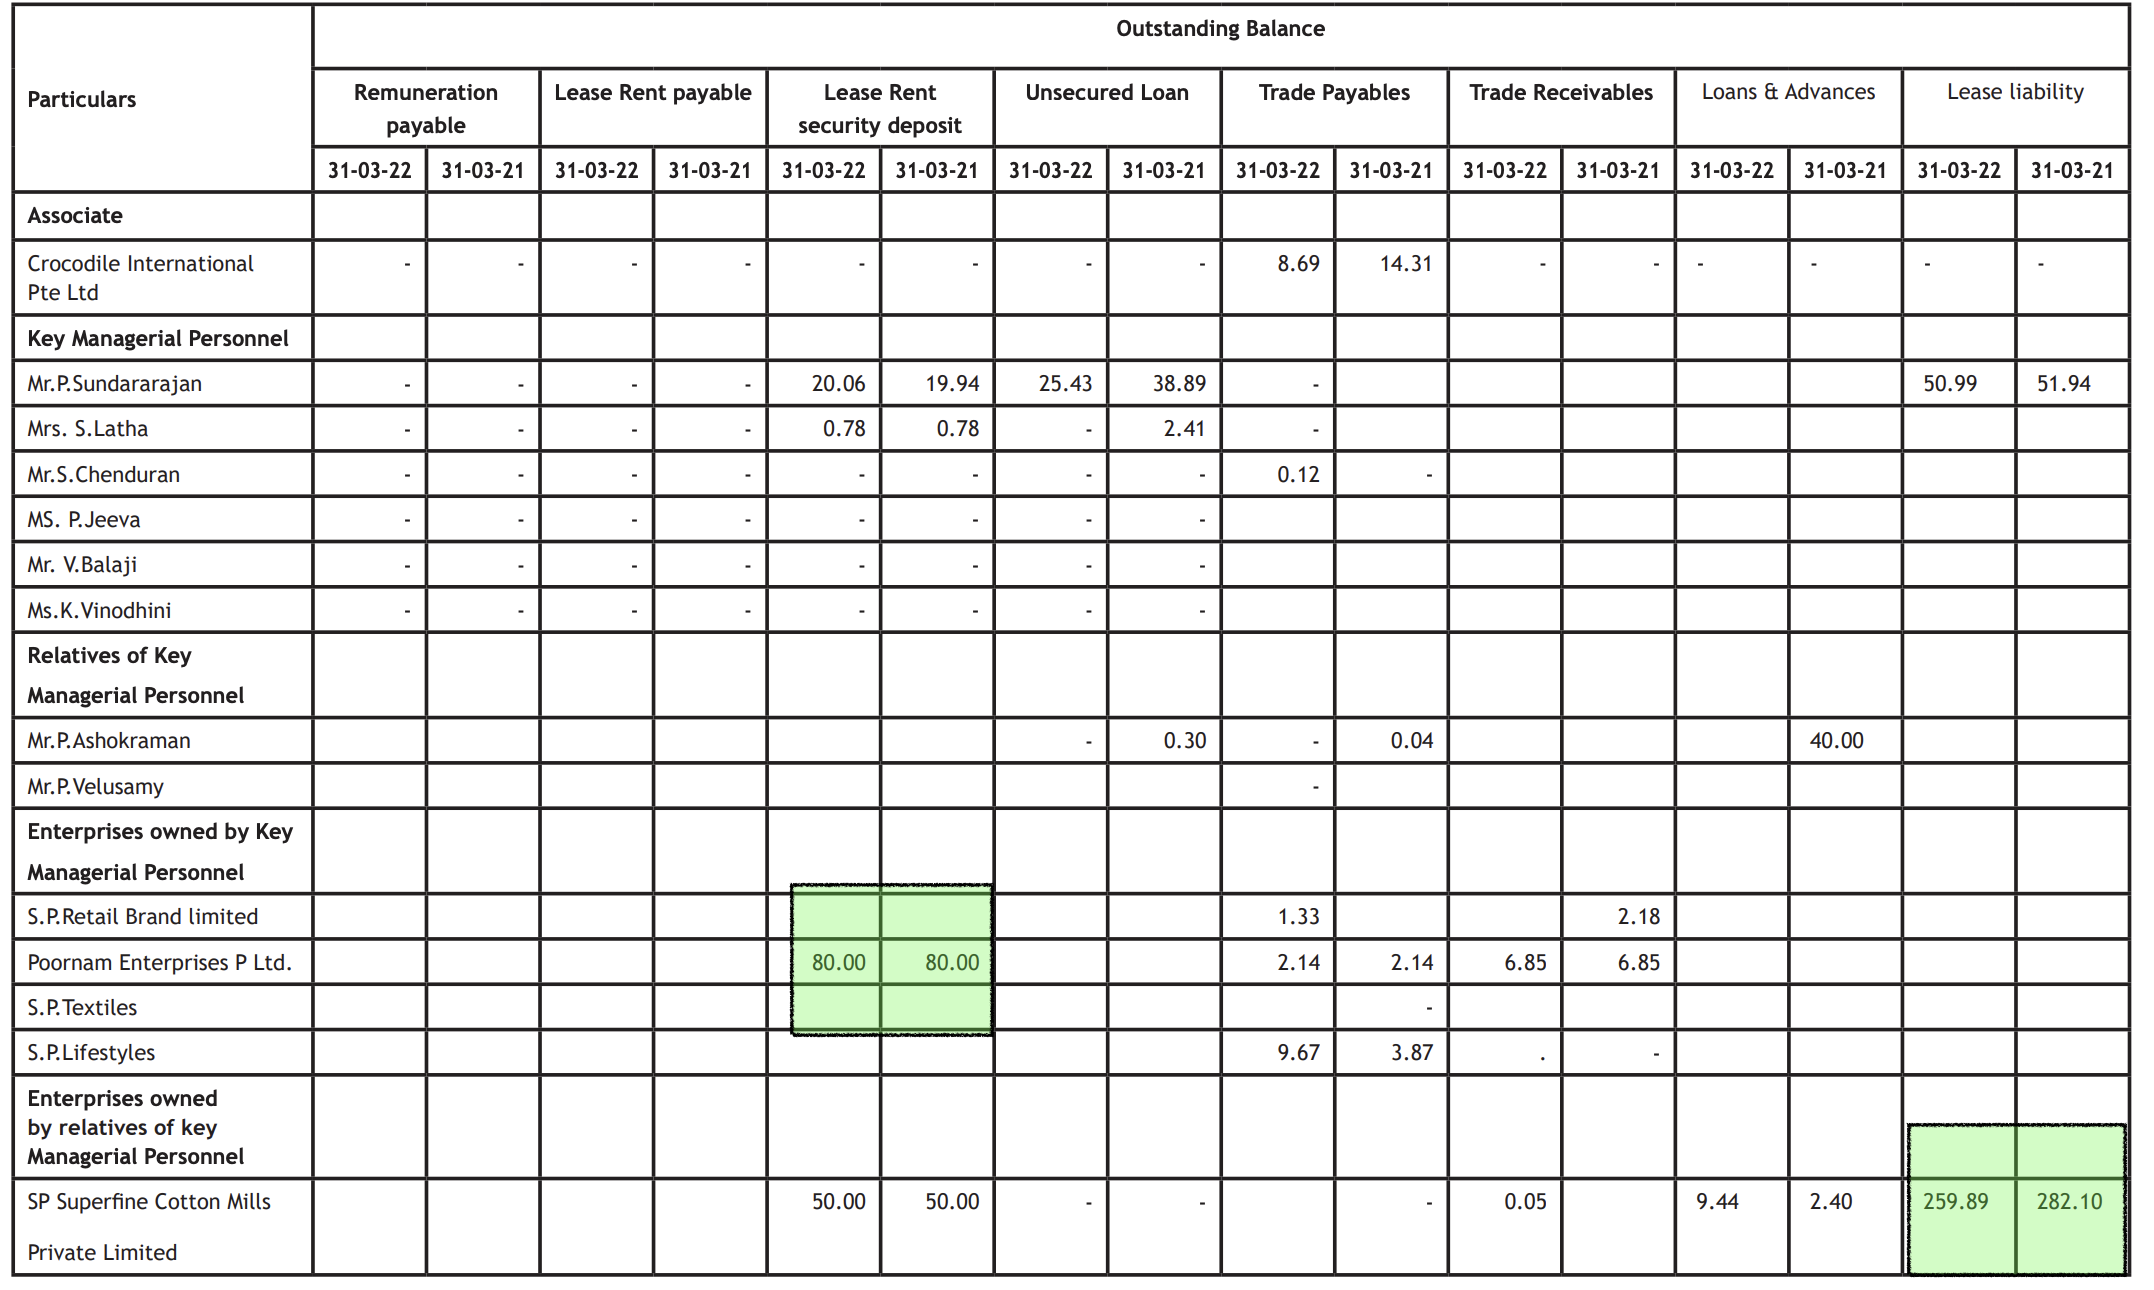
My board-level understanding is that whenever company pays rent, loans etc to promoter /other subsidiary company, it looks like promoter is trying to make money
PE on screener are TTM trailing.
1 Like
Answer to your questions
-
Yes
Lease Liability: Lease liability is basically the total payment the company is obligated to make to the lessor (or key managerial person in this case) over the term of the lease agreement. This amount is the present value of all future lease payments and is recorded on the company’s balance sheet as a financial obligation. From what I understand this payment is not yet made but will be made in the future but please verify it with an accounting expert.
Lease Rent: The lease rent refers to the periodic payments made by the company to the lessor (KMP in this case) for the use of the leased asset during the lease term.
Now , the lease rent payments are made over time and are a part of the total lease liability.
Why is the Lease Rent higher than the Lease Liability then?
The lease rent can be higher than the lease liability for various reasons. It could be due to changes in the current value of the leased asset, changes in the lease agreement terms, or other factors like variable lease rent, additional charges, or lease modifications during the lease term. The answer to this can only be found in the lease agreement.
Also, the lease liability paid should have decreased in 2022 but it remained the same (5.85) in this case. Why?
Some of the reasons can be as below:
The lease agreement may have fixed lease payments, where the company is required to make fixed payments over the lease term without any changes or escalations. In such cases, the lease liability remains constant as the total obligation doesn’t change throughout the lease period.
The lease payments might be structured in a way that only a portion of the payment goes towards reducing the lease liability, while the rest covers the interest expense. In such cases, the lease liability may not decrease proportionally with each payment.
The lease liability is initially calculated based on the present value of future lease payments, using an appropriate discount rate. If there are changes in the discount rate or the way it is applied, it can influence the lease liability calculation.
It can also be due to changes in the lease agreement
-
This is the loan that company accepted from the promoter and then repaid to the promoter. Rough calculations at a rate of little more than 20 percent. Again this can be verified only with respect to the terms of the loan agreement.
-
Same as 2
1 Like
1 Like
Is anyone aware of how I can search/find the top gainers for a specific timeline?
I want to find the top gainers for each year.
I think you can search for such gainers both on Screener and Chartink. I think you can either search in terms of years or weeks, I guess they provide this.
Or Zerodha recently launched this, you can check this too.
1 Like
They all provide data for the last 3 months, 6 months, 1 year, etc. but not for the specific time range. Ex- I want to search for top gainers from 1/01/2014 to 31/12/2014. I am looking for this type of data.
Can someone explain Book Value Per Share in detail? This forum says BVPS is (Equity Capital + Reserves & Surplus)/Shares Outstanding. Other websites in which I was researching this, said that BVPS= (Net assets-Net Liabilities)/Outstanding shares.
It would essentially be the same thing. The idea behind it being that in case of bankruptcy or liquidation (all liabilities are squared off by assets) how much of the value is to be returned to shareholders. Deep value investors compare the marketcap to book value (i.e. P/B) to determine whether there is enough safety of return of capital
As with all ratios, it has to be seen in a context
- BV/share is more relevant for traditional asset heavy businesses. New ages businesses which have a lot of intangibles may not have a high book value
- A stock trading at less than book value might indicate deep value or a value trap depending on how the assets have been valued
Hope this helps
The title intrigued me and here is my query.
So, I’ve just started investing and I eye short term and long term gains.
I’ve shortlisted stocks from major industries like, Hospitatlity, Power, IT, Power, Entertainment and OMCs.
Is there any other industry I should focus upon?
What should be the fundamentals I should look at while zero downing a stock for investment.
I understand that it is not always about the fundamentals but, in my opinion these build a base for the company which is a near true reflection of their future.
Looking forward to more insights, Thank you!
Short term gains are relatively tough to get compared to long term gains. I am not sure without some experience with gains or even with losses, one can straight away trade for short term.
So if you want to focus on long term, considering that you are new, you can look at the topics opened on businesses in the forum, there are hundreds of them. Pick one business on any basis and read about how members go on about the business, how things have changed, what members thought about them, what kind of decisions they took etc.
I guess once you have some learning and experience irrespective or profits or losses, you can venture into short term. Not that we cannot speculate, but it will be tough to understand market movements in short term without some experience, because there are many nuances, there will be many whats, hows and whys. If you want to go the short term route, then visit these threads.
It will be overwhelming, but there are a lot of things that are covered for short term, books, charts, fundamentals etc.
2 Likes
Hi,
In your experience what are the most important parts of the annual report? e.g Management discussion etc