Introducing Potley.in - Uncluttered stock profiling

Fellow value pickers,

We are extremely chuffed to share you ‘potley.in’!

What is this: Just another portal to explore stocks.

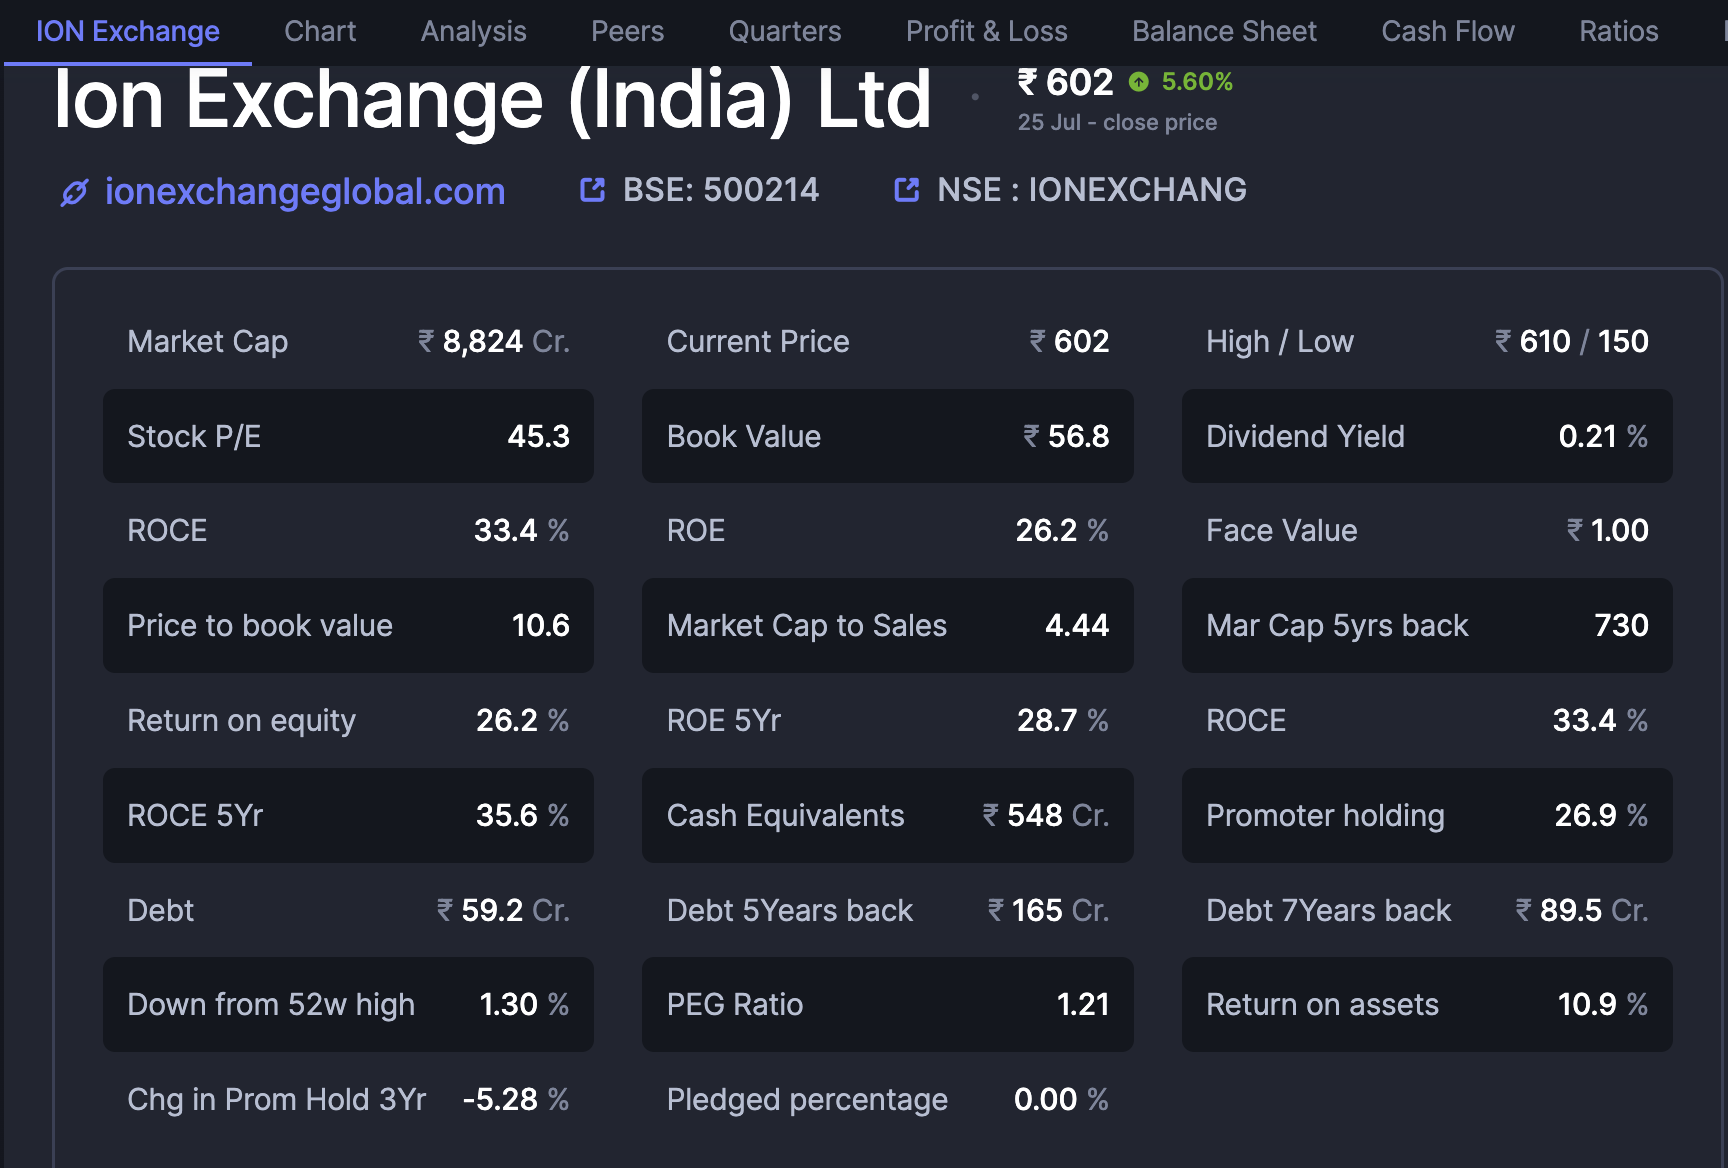
In a world with many portals to explore stocks like screener.in (btw, which we are also a big fan of…), we felt a need to add one of our very own.

But why?

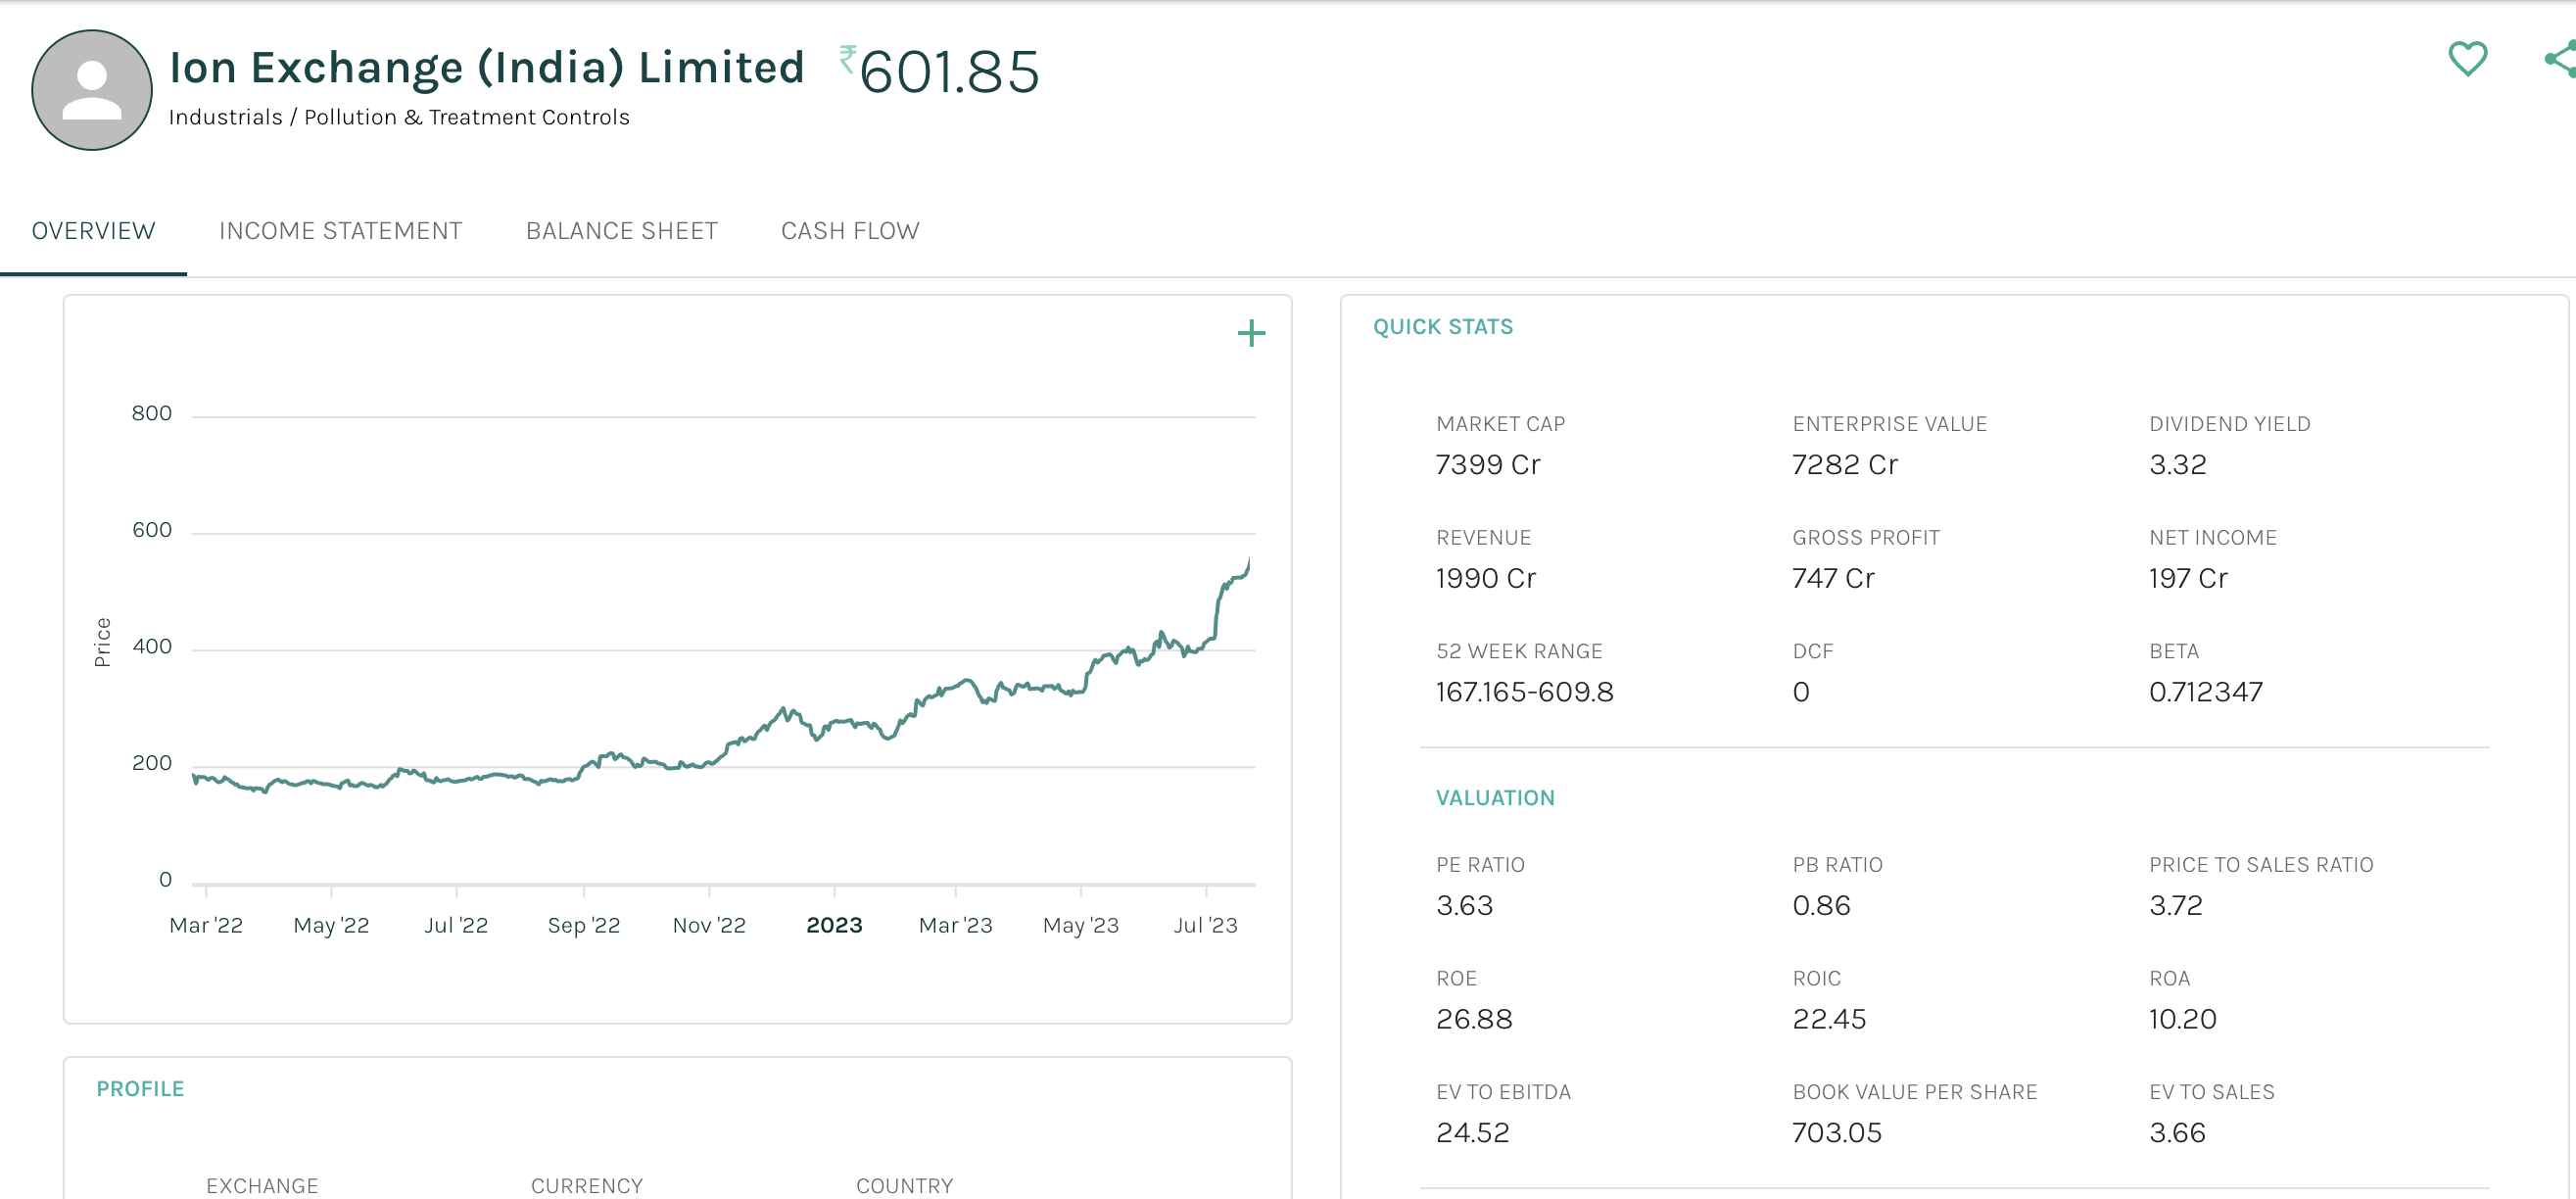
We are familiar to quotes like, “Information is power” / “Knowledge is power” but in a world where we are constantly flooded by too much of information, clarity is important than ever before. To know, what to focus on!” - With this philosophy, we have built this portal.

We (Myself and Kaiwalya) are bunch of technology and finance enthusiasts, our intersection of interests, resulted in this portal!

Features:

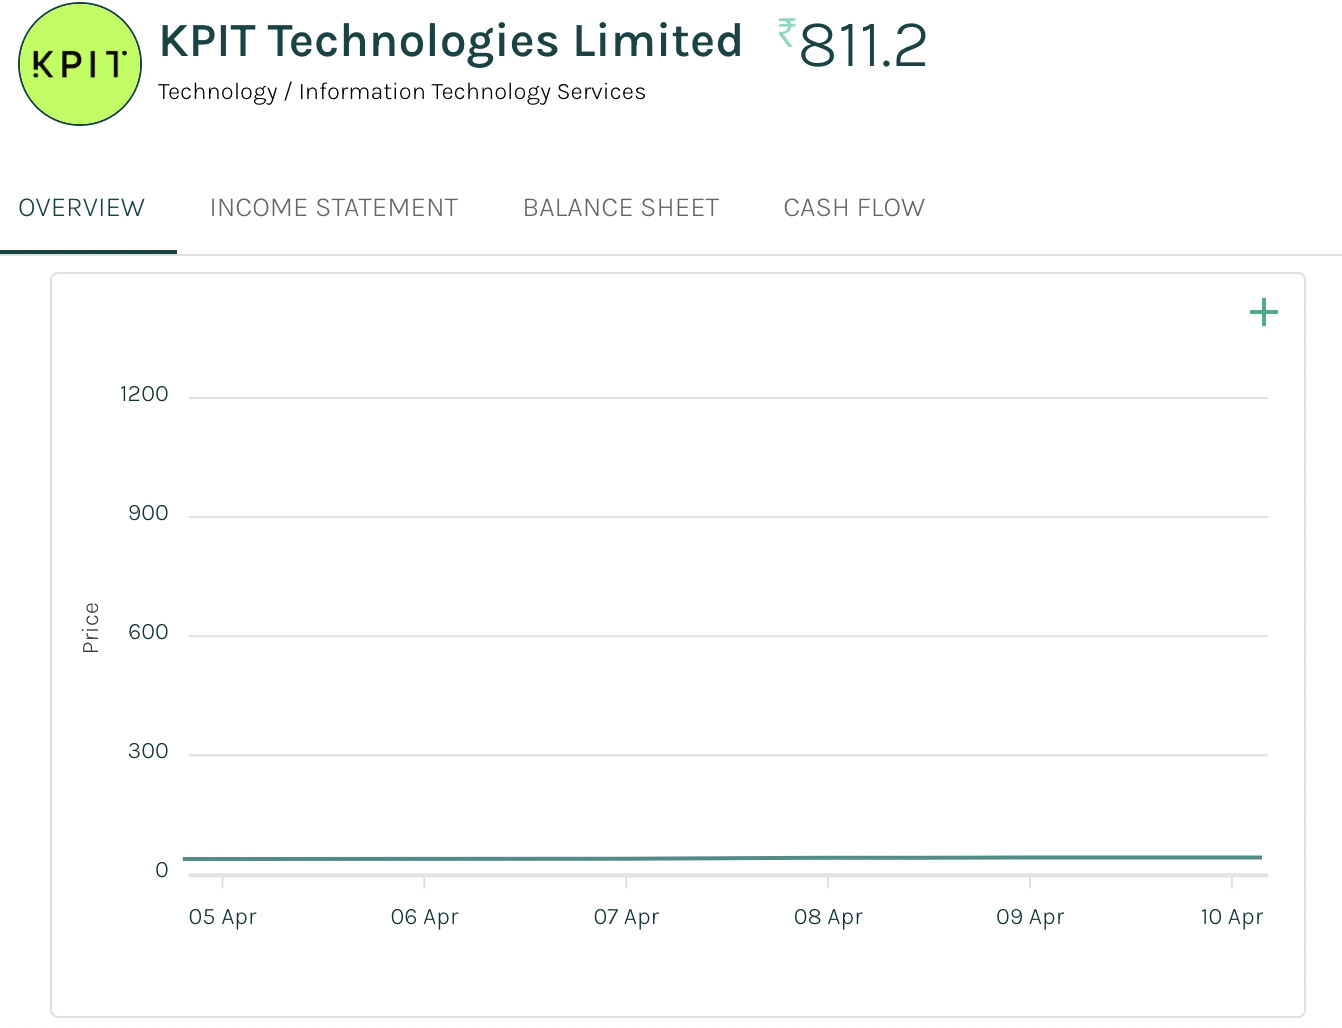
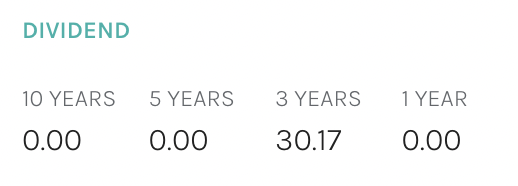
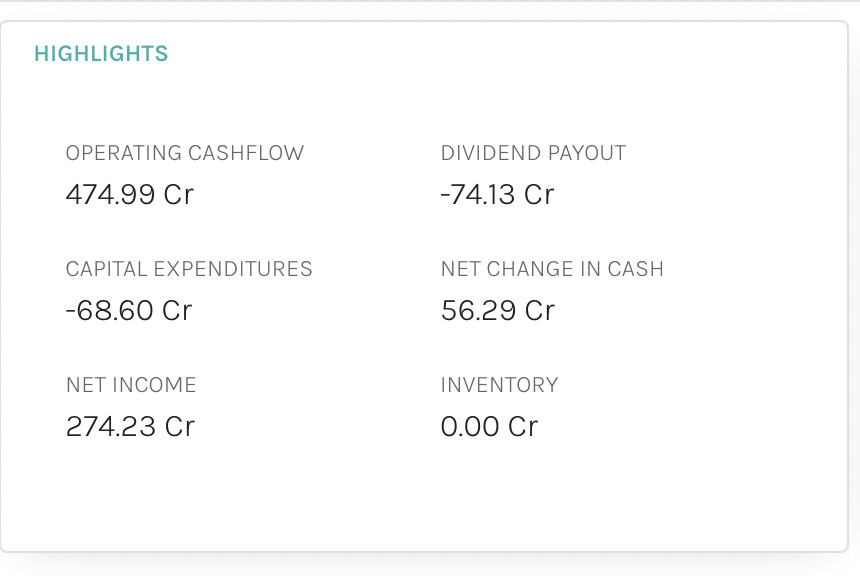
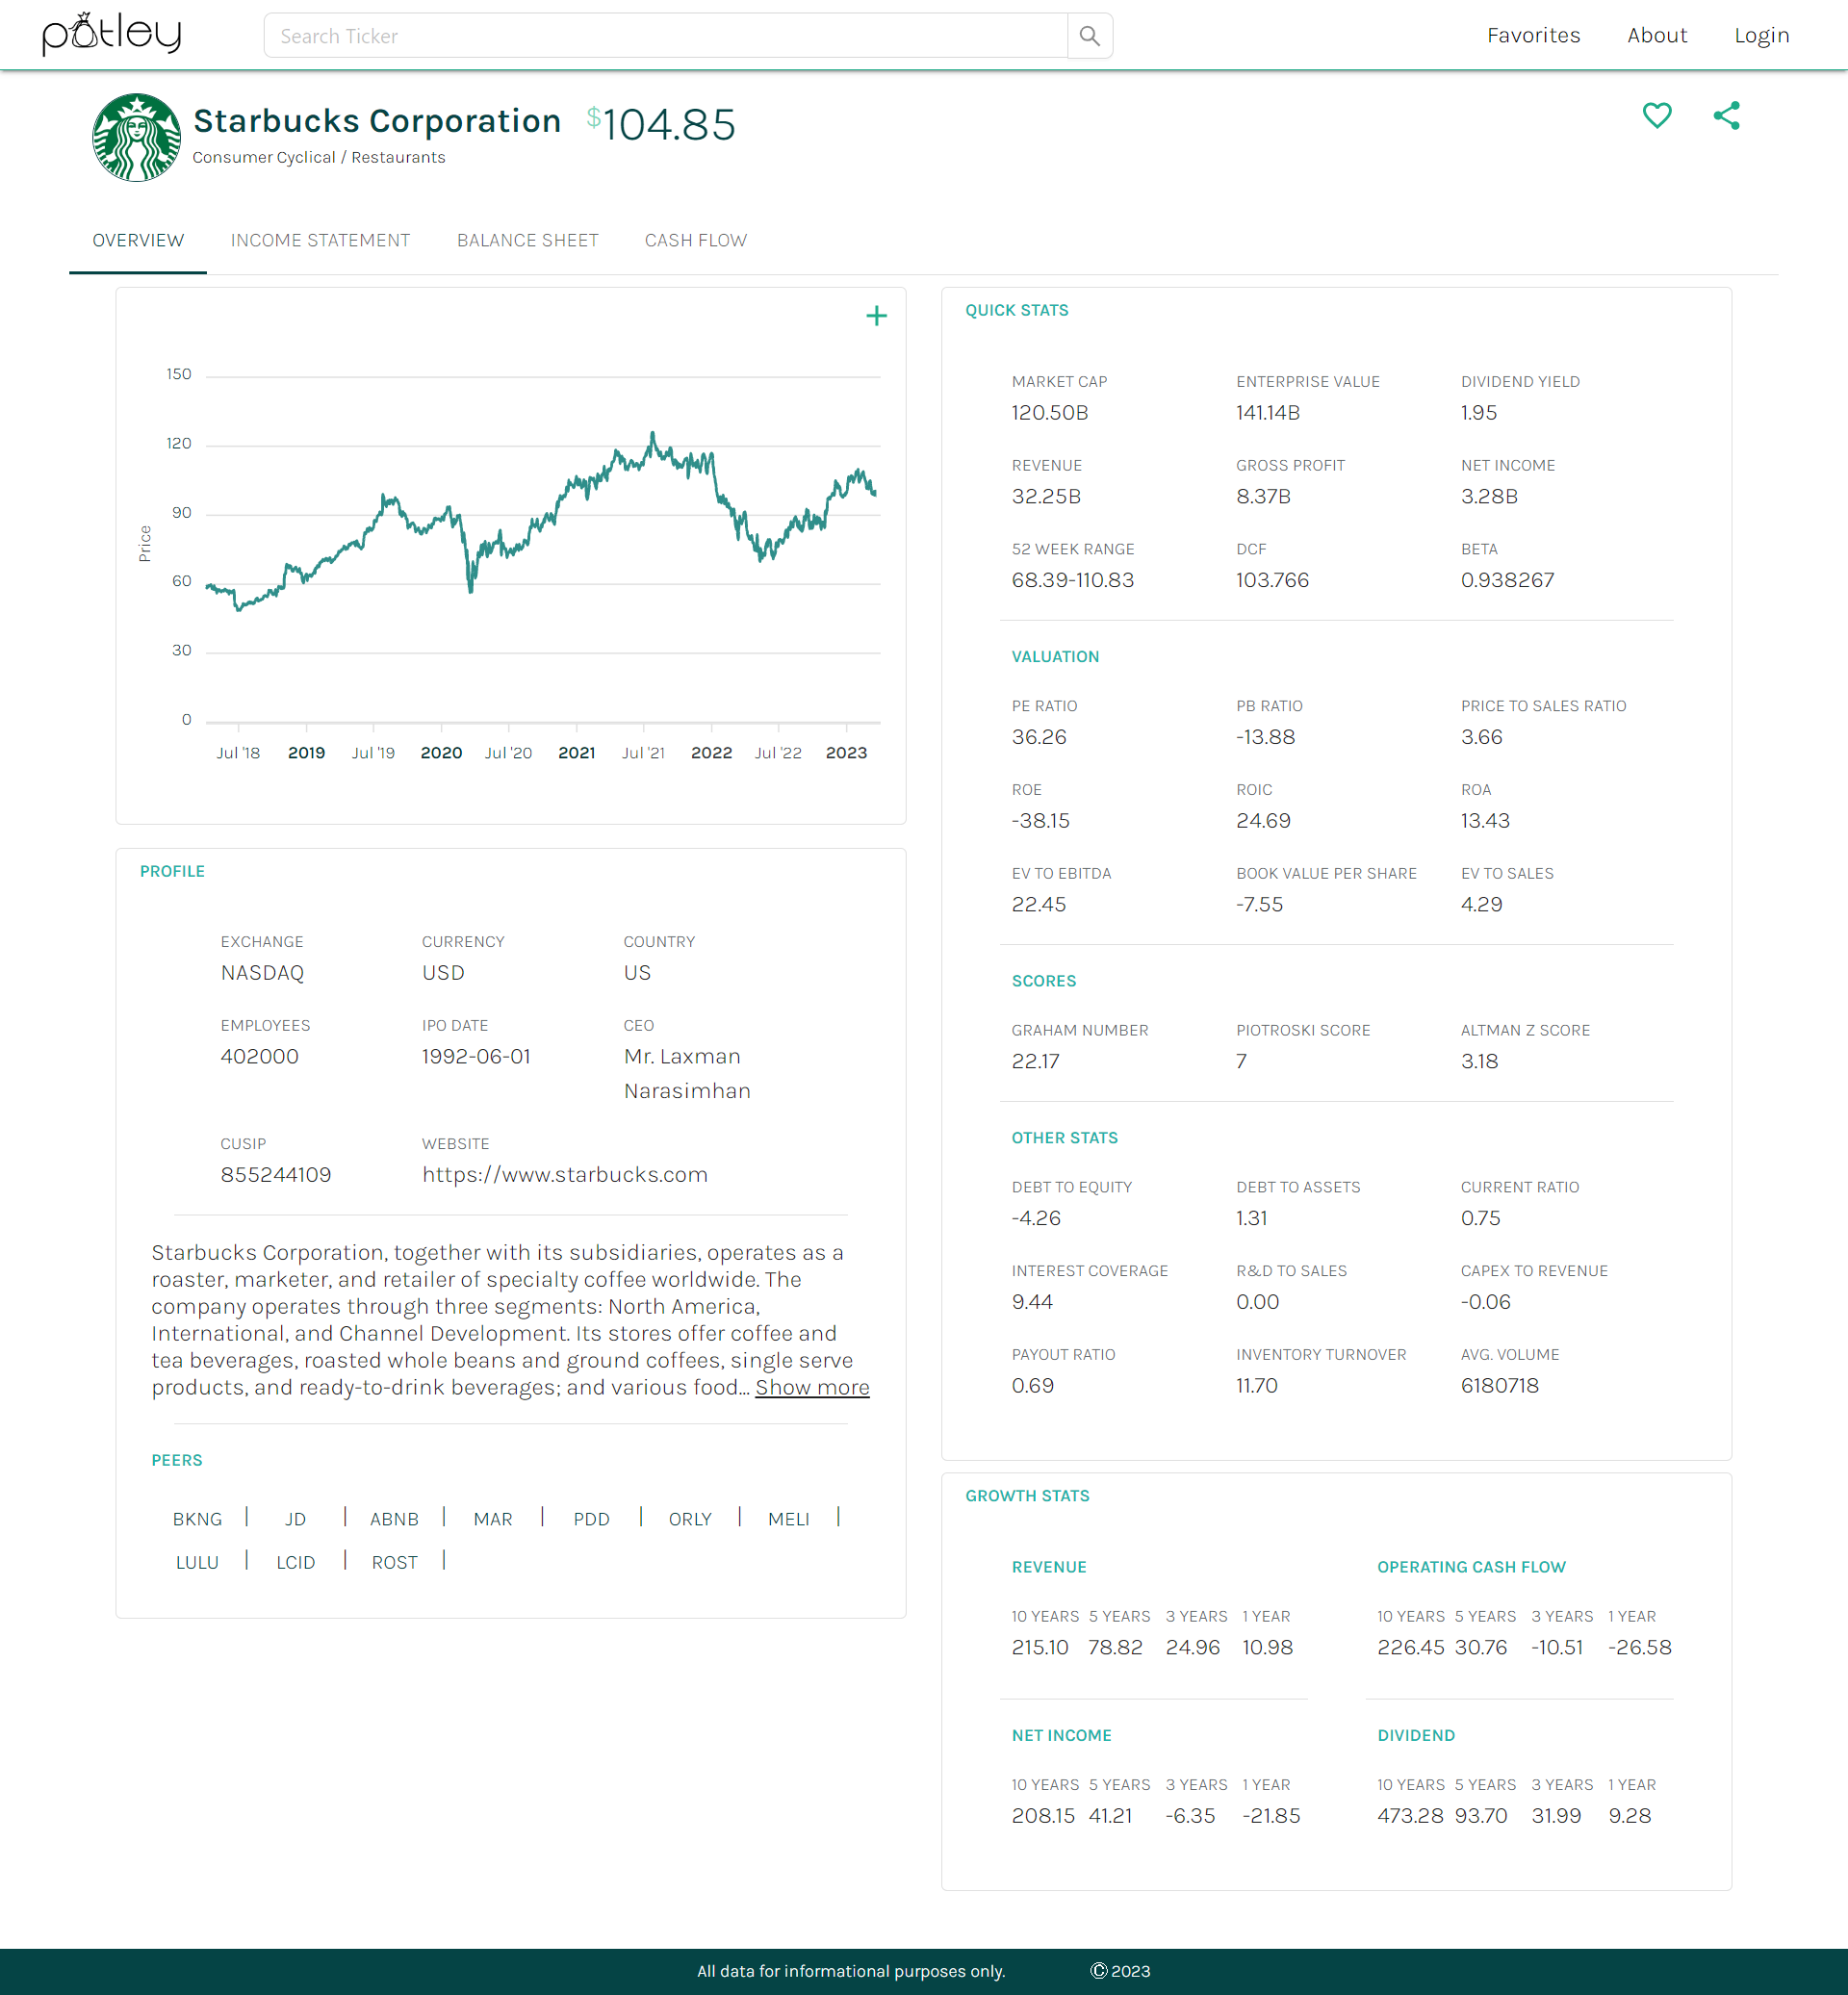
Focus on what matters: Uncluttered view of financial stats.

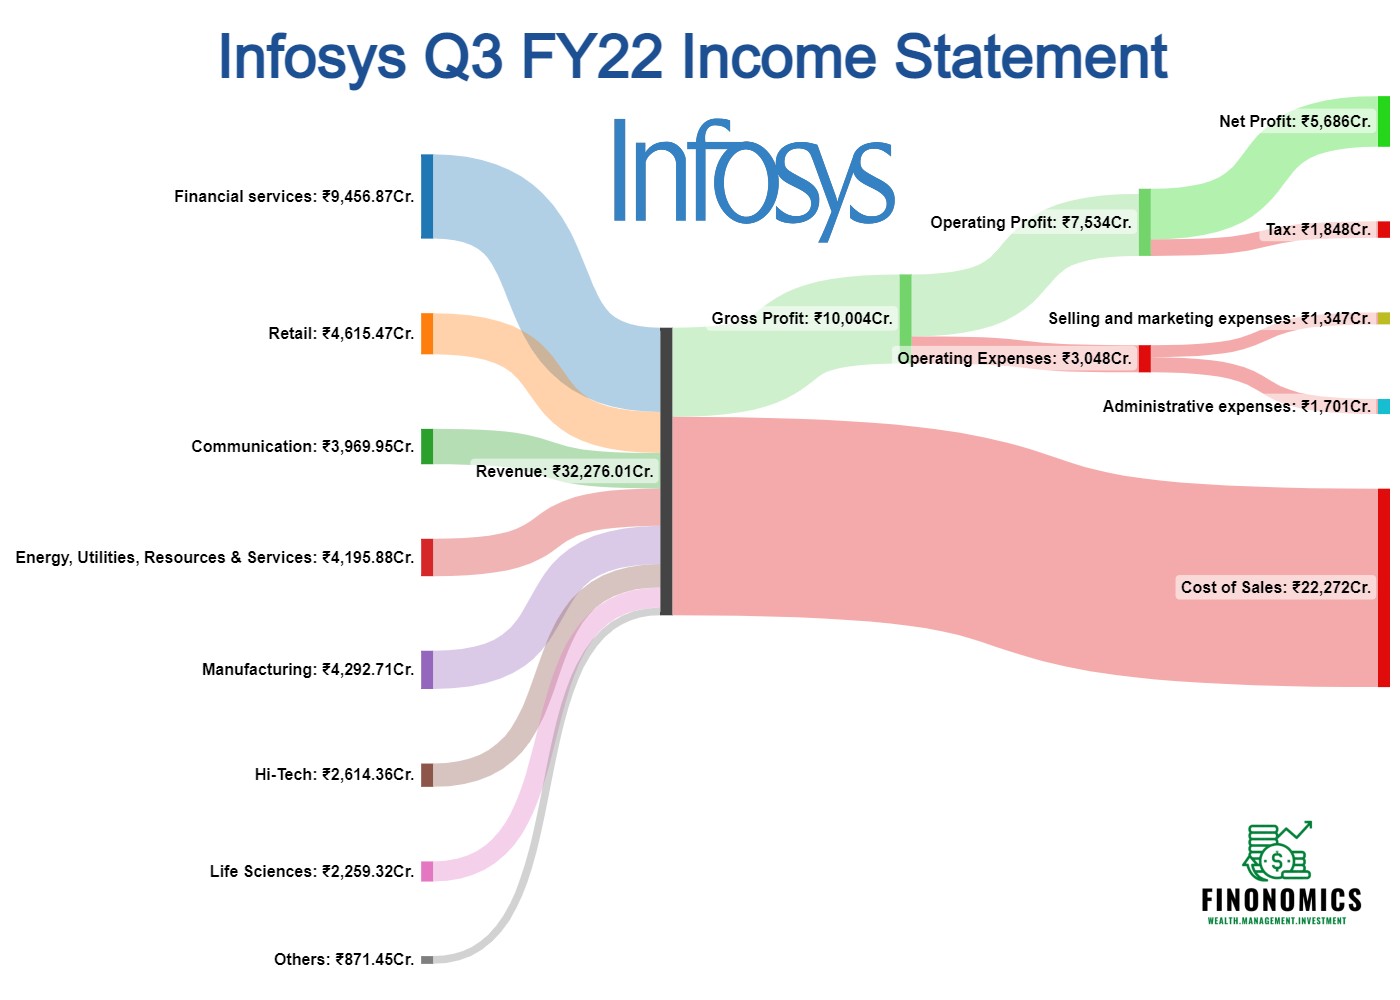
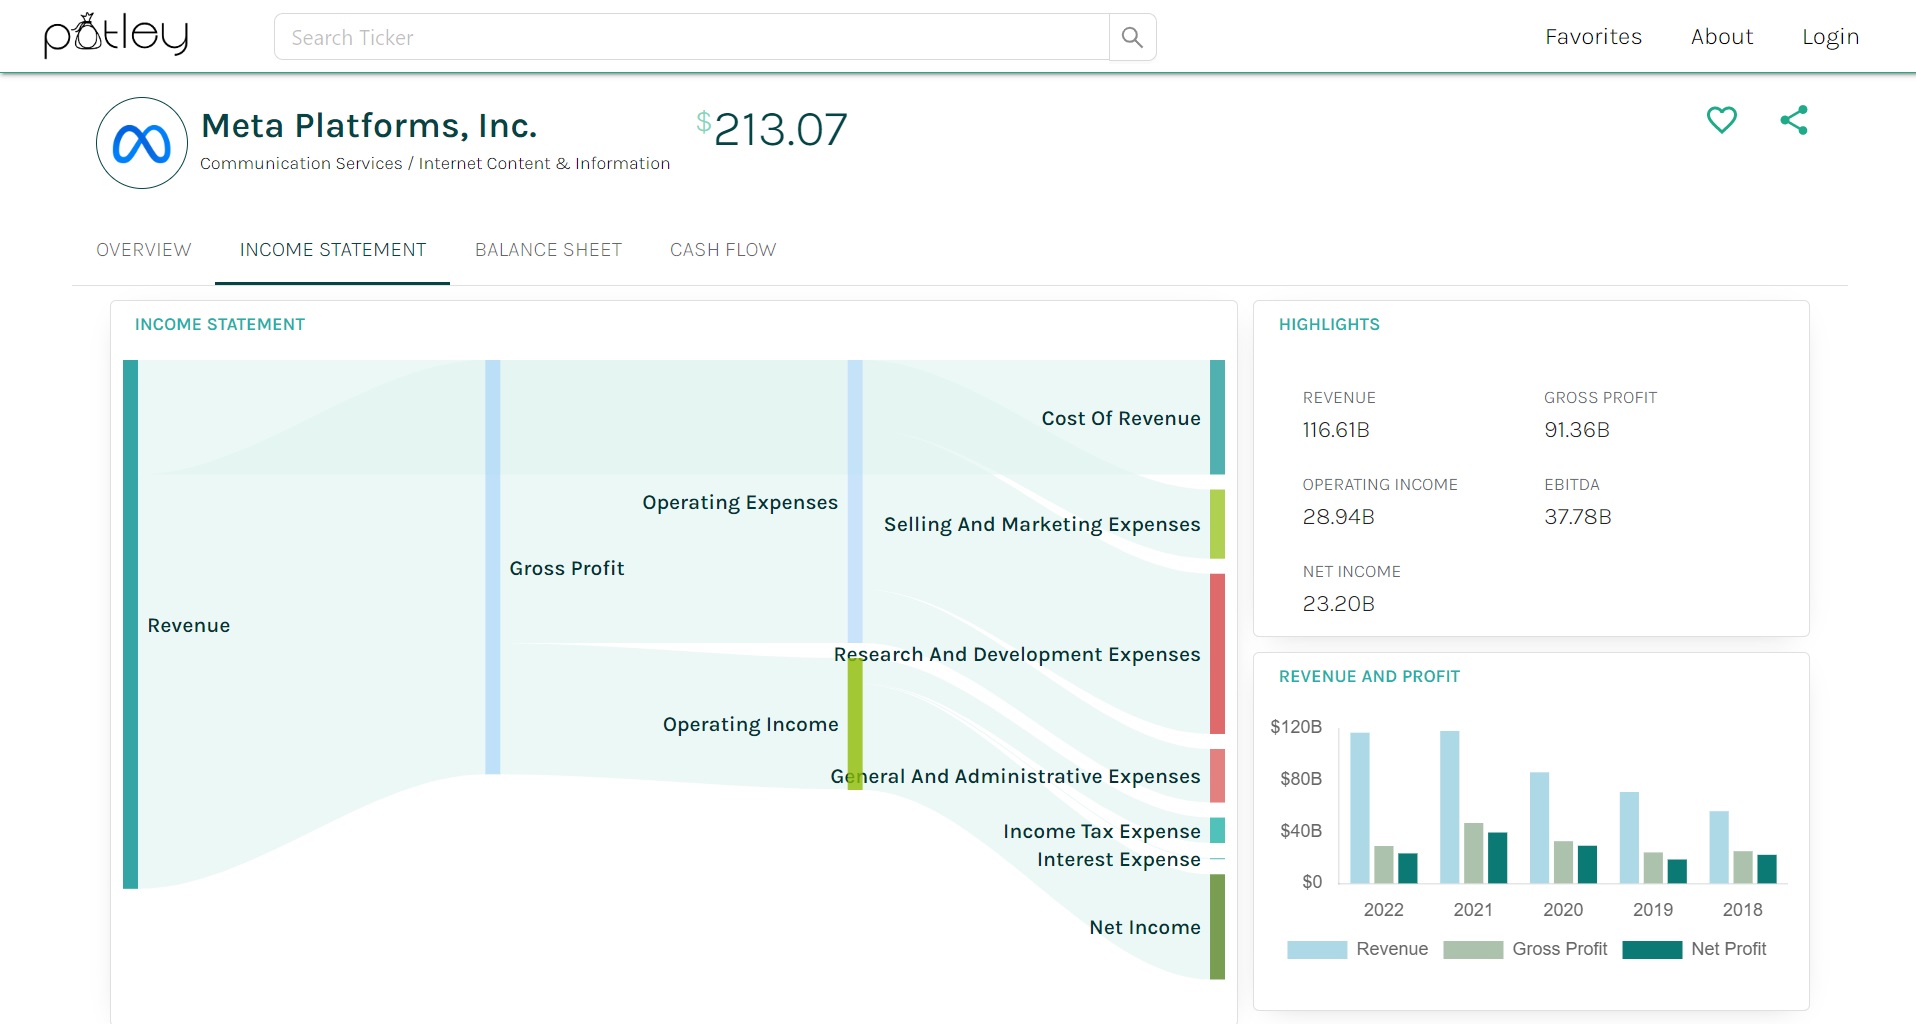
Sankey Chart for income statement: We believe a nice pictorial division of income statement will imprint a nice mental picture,

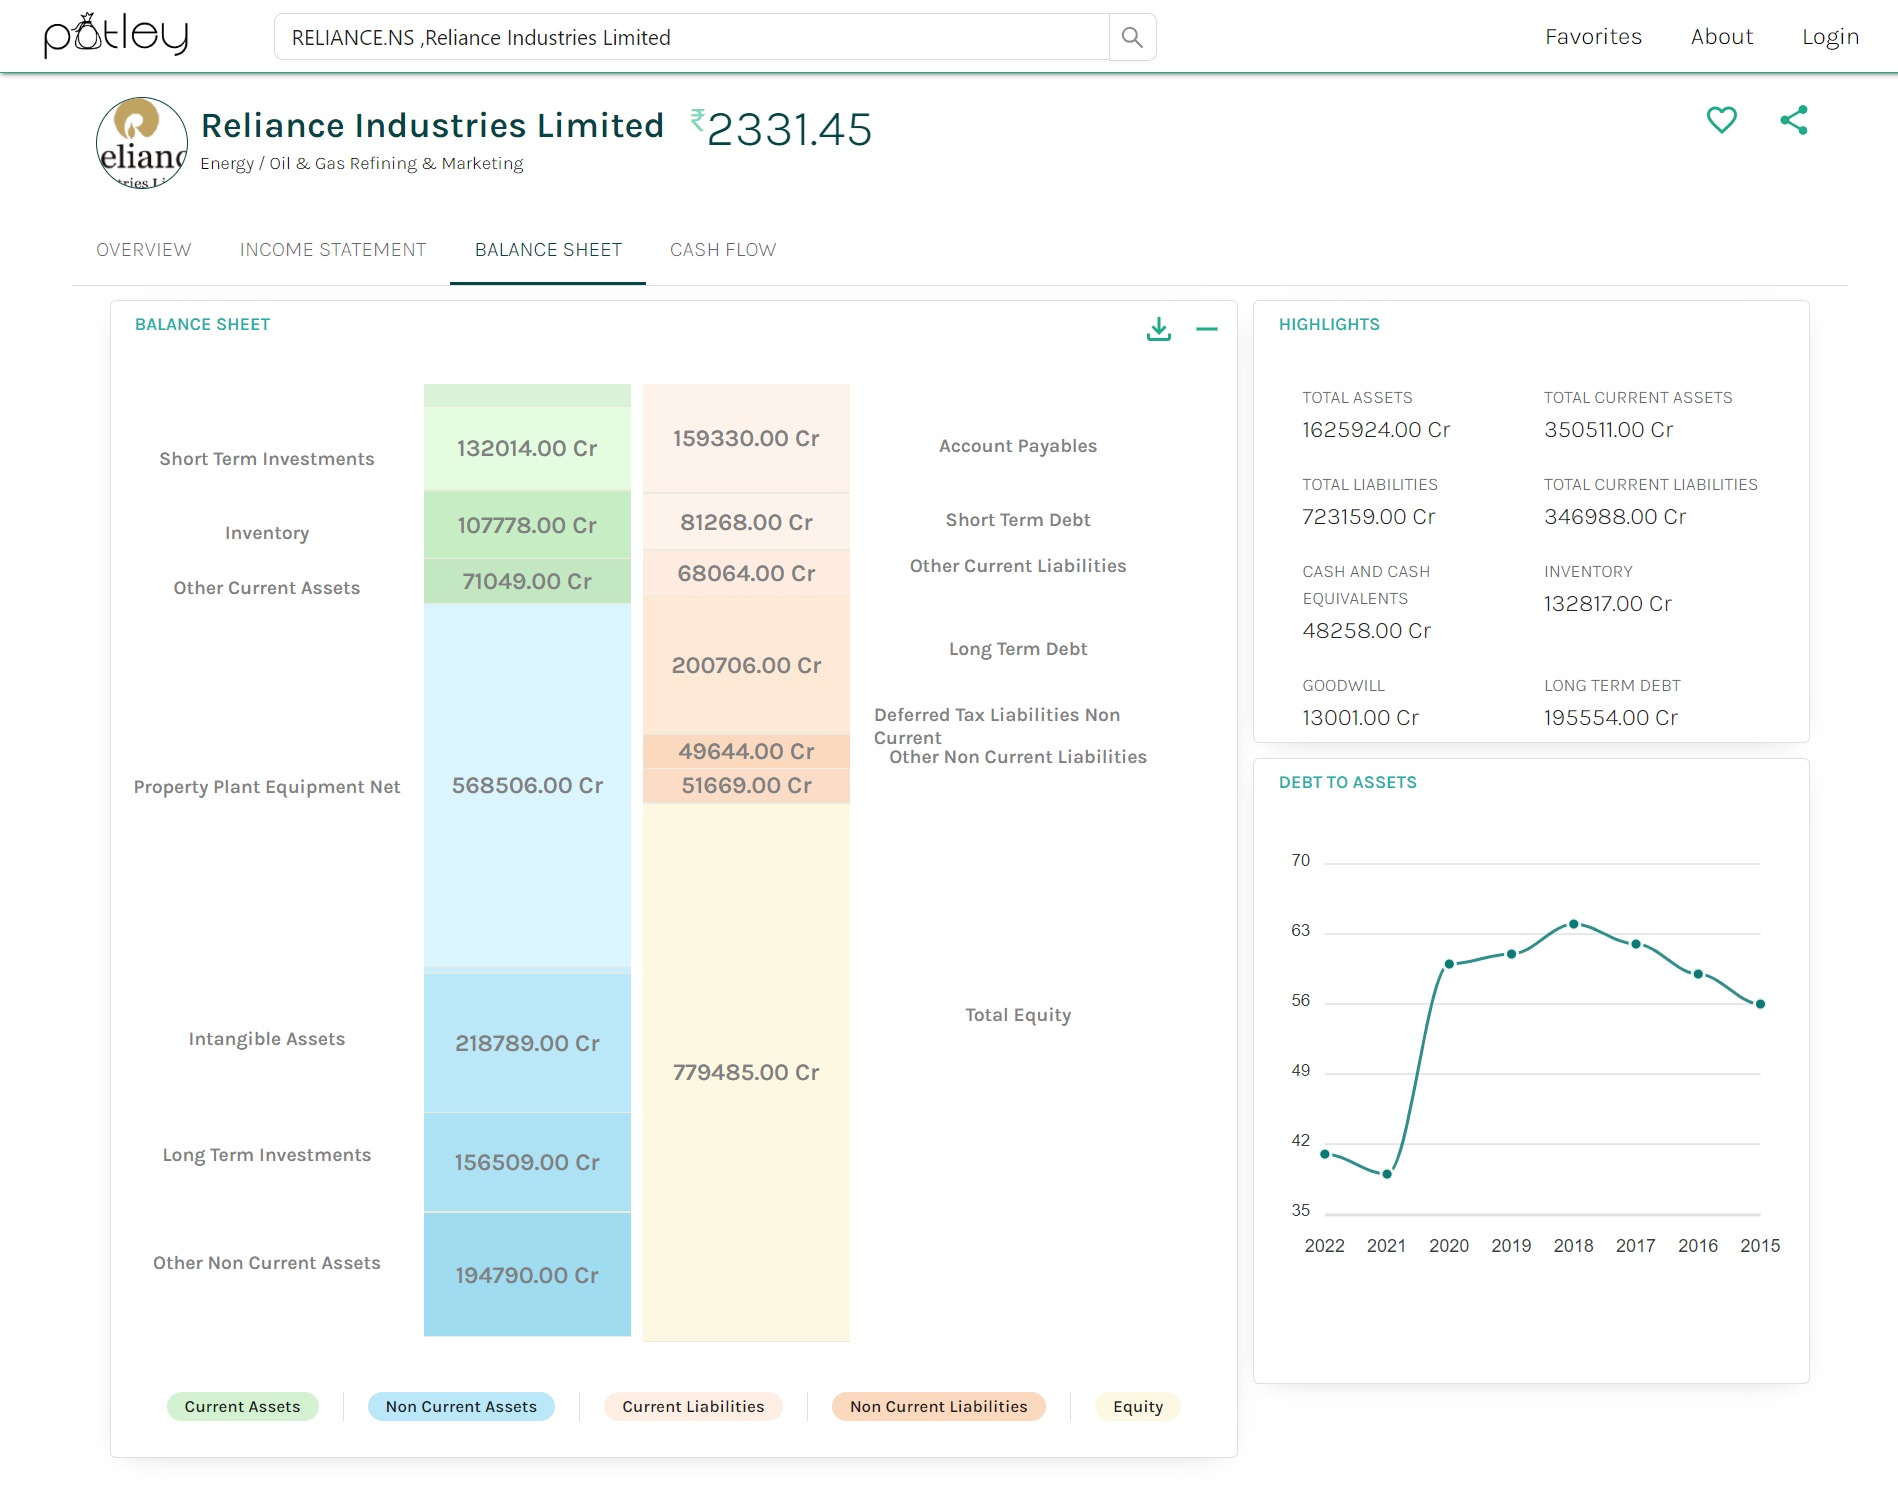
Balance Sheet: We believe the boring balance sheet numbers can be better visualized in nice graphical sections proportionate to the figures.

Potley supports US (and global) stocks! We felt the absence of a good portal with simple readable interface (like screener) for fundamental analysis of US based stocks.

Words are open to interpretation, but numbers are facts. But a common problem we ‘value pickers’ face is, when presented with a lot of numbers, we are boggled. To make the sense of these overwhelming numbers we have developed features where you can make sense of these overwhelming numbers at a glance!

The data is provided by Financial Modelling Prep API.

The site itself is in beta at the moment and we are continuously improving and launching new visualizations.

Please let us know your thoughts and if you have any ideas about any new features – send us at support@potley.in ! We will try to incorporate them as we get chance!

Happy investing!

31 Likes

It works beautiful. Amazing site with very good information and data.

1 Like

Congratulations!
Good start.I checked the data for a few companies.It has been presented nicely and precisely.Are you planning to add more features for screening stocks on various criteria?

1 Like

Love the fact that potley has financial information of both Indian & global Stocks.

Good luck!

1 Like

Idea seems good. It is incredibly hard to find a screener like website for US stocks. Two suggestions from my initial impressions of the website:

  1. You could add indentation and color coding of certain line items in the income statement.
  2. The format of balance sheet and cash flow statement seems confusing. I would personally prefer a screener like formatting of all three statements.

Overall, great job!

1 Like

Good beginning Ashish. Do you know if you are planning to build it for a particular cohort of users (or) if it’s a generic portal?

Some minor suggestions/ feature requests/feedback:

  • Noticed that there are some features - but they aren’t self-intuitive. For example, didn’t realise that charts can be dropboxed to zoom in. However, once I zoomed in, still do not know how to zoom out now.

  • Should there be units beside the titles? for example: Dividend payout (in %) OR Revenue (in Mn $)
    image

Another example is say under cash flow section where talks about Capex. Is it Capex for the last quarter? last year? entire history?

1 Like

Update: Discovered that the portal says “INR currency” on the left side - so now I guess the unit is Mn Ruppes.
This could be a design problem. Since now I will have to read information present everywhere randomly - this doesn’t help me declutter the information

1 Like

Hey Manoj!

Thanks for your feedback! Yes, we will try to keep adding features and the emphasis will be more on graphics, charts and visualization.

As far as the stock screening is concerned, we know screener is good enough for Indian stocks at least. We will try to add screening but it’s low priority for us at the moment because there are state of the art screeners for US stocks as well… but we will try to add a screener over the longer term.

Hey Prateek,

Thank you for your feedback!

Yes, we definitely see the scope to present the income/cash flow/balance sheet tables in an intuitive format, and we would address this shortly.

Hey @ChotuKatappa ,

Thanks for your feedback!

Yes, agreed that these features are not self-intuitive. To address this, we will try to create a video explaining the features and/or create tool-tips wherever it is relevant.

Yes, the dividend payout should have unit mentioned against it and it is lacking at other places as well for that matter. We will iron out these issues as soon we get chance.

For currency, we are trying to present all the numbers in Crores. We will soon convert it to crores wherever it is presented in millions.

Appreciate your attention to these details!

2 Likes

You’re welcome @petrolhead
Please do keep us posted. Would be happy to see the portal do better and grow :slight_smile:

Have made changes to the balance sheet and cash flow tables. Also tried to streamline the figures as per the currency of country. @prateekv @ChotuKatappa

2 Likes

Firstly Congratulations. I must say that the website is very crisp, precise and on point. Gives you specific information cleanly and very easily.

I just had few suggestions first one is regarding the Sankey chart, it might be helpful to add the source flow in the same color as the origination. I had created a similar chart for my college’s finance club, and I believe it would make the chart more informative if you added this feature. As you mentioned earlier, your focus is on visualization and graphs. Here’s an example

  1. If possible, could you add the calculation behind the numbers available on the website? For instance, if I hover over the ROIC figure, it could show how the ROIC was calculated. Similarly, for other numbers like gross profit, hovering over them could display which statement they refer to, providing a better understanding. This suggestion is based on the premise that the website is intended for people new to the investment game who seek a clean UI and specific, concise knowledge.

  2. Adding a dark mode option would be a nice addition.

Lastly, Good luck with your future work:)

@petrolhead

I want to express my appreciation for your exceptional work. Your platform has been of great assistance to investors.

However, I have noticed that the retained earnings section is missing, even though it used to be there. This was an important feature in your website actually.
Could you kindly investigate this and add it back if it was removed?

Thank you.

Excellent work!

Are you planning to make the code open source anytime soon? I understand if you plan to monetize the website, it might not be possible. I want to learn data scraping to build stock filters using technical screens.

@petrolhead and team, this is a great tool to start with, especially for US stocks, one was badly needed…Kudos.

Is there a way to download statements as excel? Will be greatly helpful.

Other suggestions:

  • comma separated values
  • ratios like margins, ROE/ROCE, efficiency indicators etc.

Thanks and good luck!

Thanks for your encouraging comments!

  1. The problem with source flow is the availability of the data… We have the data for few US companies and we will surely roll this feature out for at least the companies reporting this data.

  2. Sure - we definitely see the scope for adding this feature. We will work on it.

  3. This is really a low hanging fruit! You’ll see the dark mode really soon.

Thanks for your kind words! @johnsgeorge.cet

Unfortunately, there isn’t any export feature at this moment. We will work on this feature as it’ll be a real value add.

Yes, we are making these minor fixes as we are getting chance. Please keep an eye on updates!

Thank you again for this feedback and glad that you find this site useful!

1 Like

@petrolhead great work man, good stuff and graphical veiw.

@petrolhead - checked this thread after some days. Noticed that there is a data discrepancy between Potley and Screener at certain times
Example: Comparing the values for Ion Exchange
Market Cap: 8800 Cr(Screener) v/s 7400 Cr (Potley)
PE: 45 (Screener) vs 3.63 (Potley)

  • Ion Ex’s page on Screener - HERE
  • Ion Ex’s on Potley - HERE