Hi all,
I have one more thing ready. This is something that I think could be very useful for everyone.
The Export/Import data at present only has a higher level grouping. While it has been quite useful in tracking trends for things like Basmati Rice and Shrimps to some extent, there has been issues for some commodities that are made up of a lot of individual commodities with varying realisations, say organic chemicals or bulk drugs.
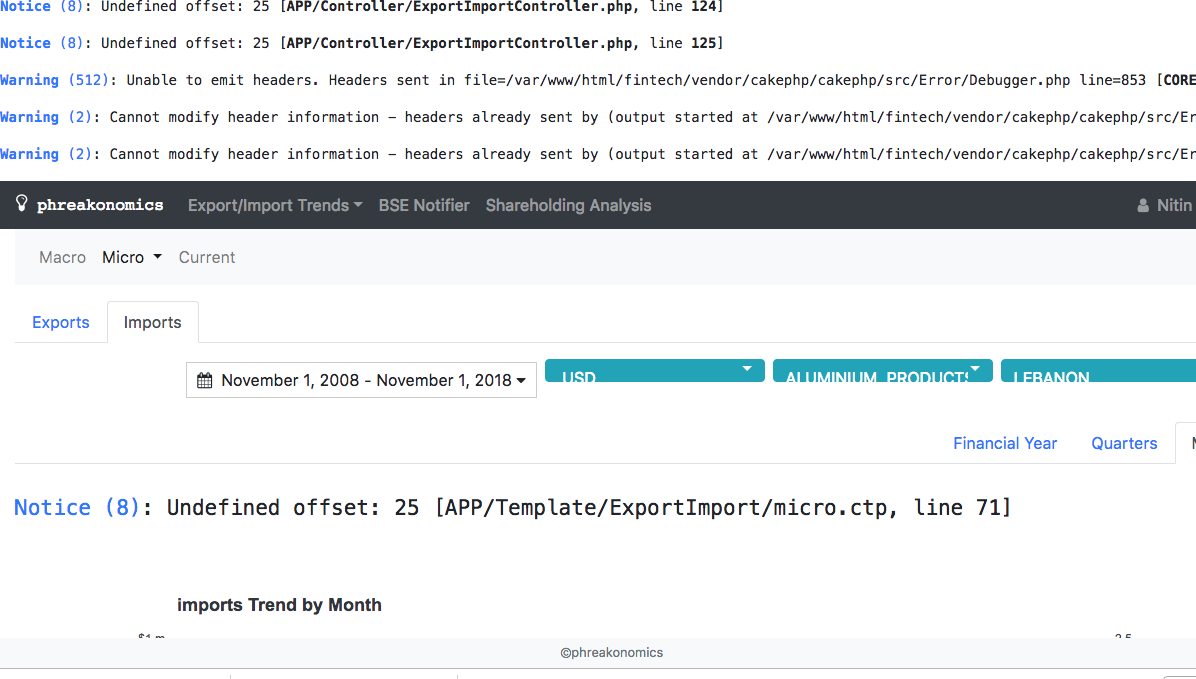
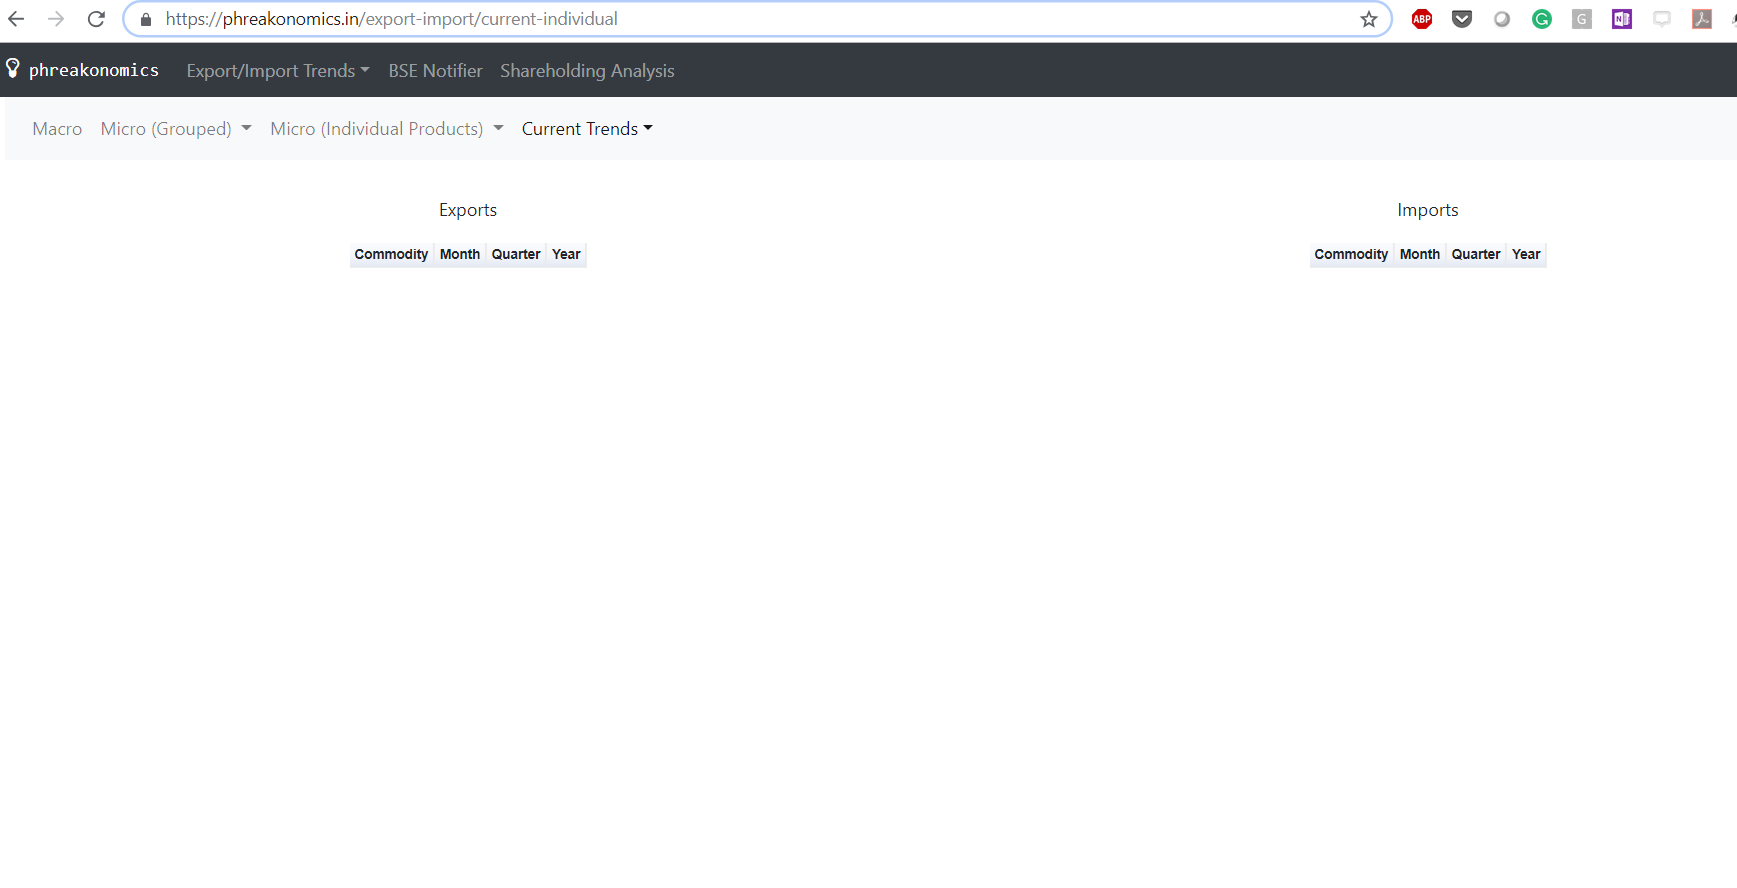
The new feature follows the same format as the “Micro” screen you are probably used to, by now but you can view Individual commodity exports.
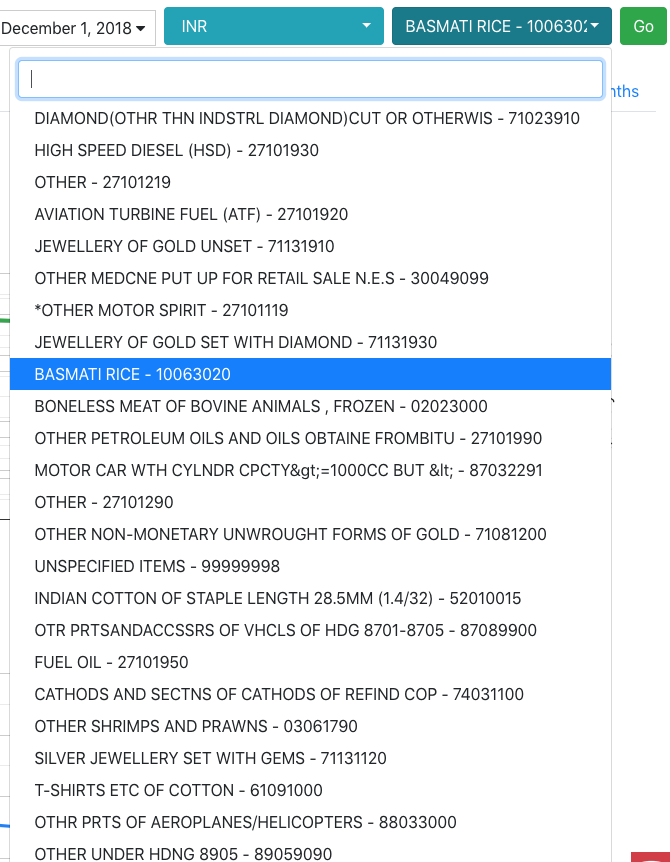
You can choose Individual Commodity from the dropdown at the top. You can search by name or HS Code.
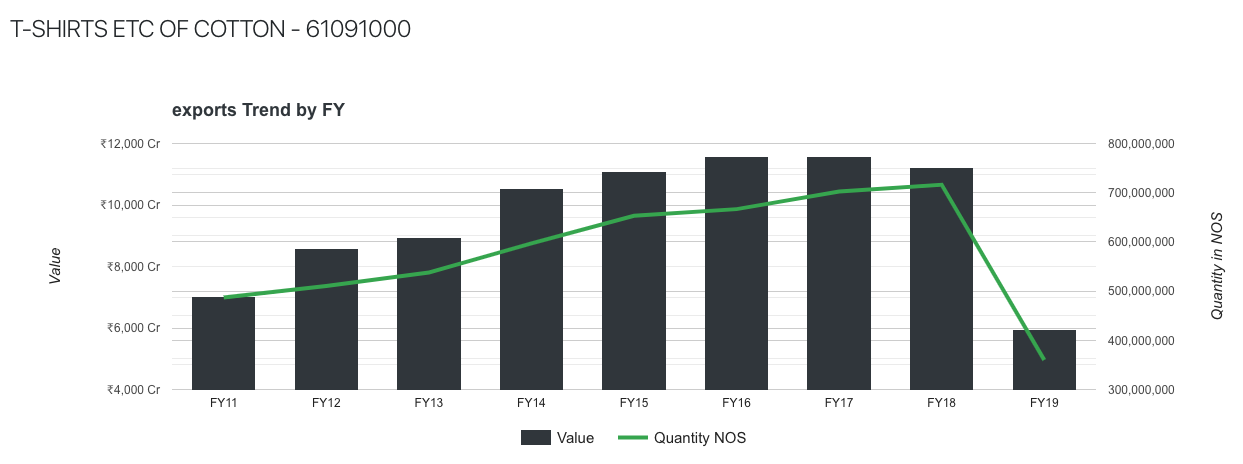
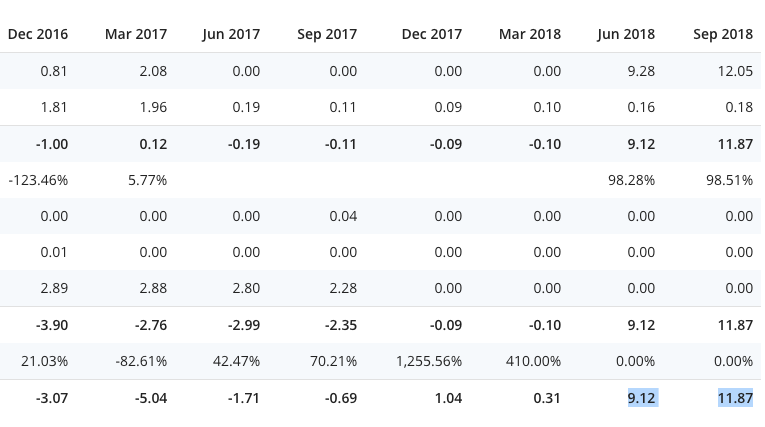
For eg. this is how the screen looks for exports of T-Shirts of Cotton,
One glance can tell you the trend is flat
With no pricing power
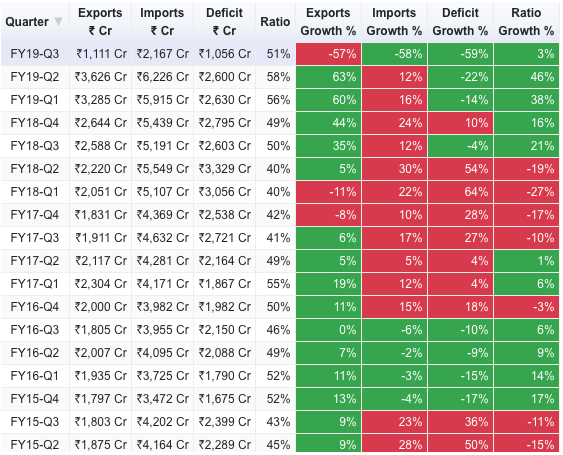
The numbers substantiate what’s visualised.
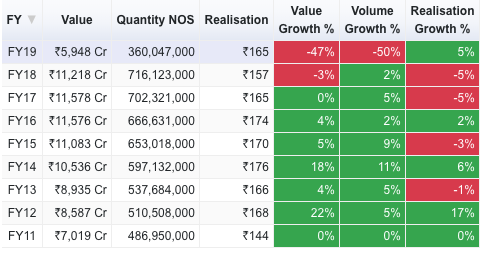
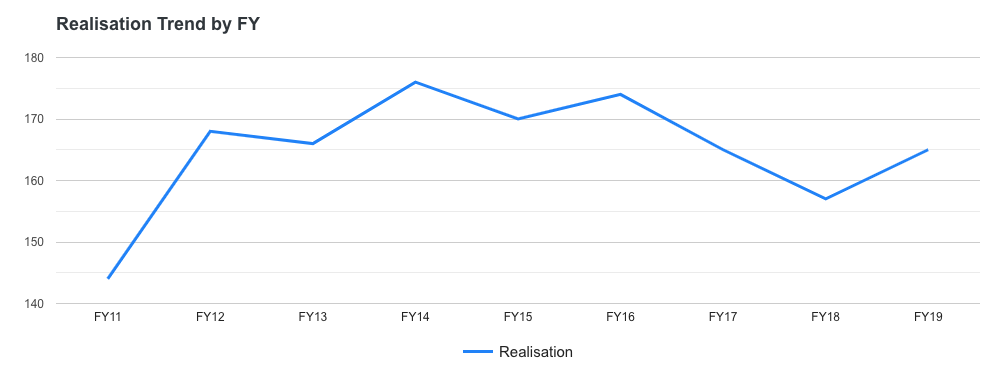
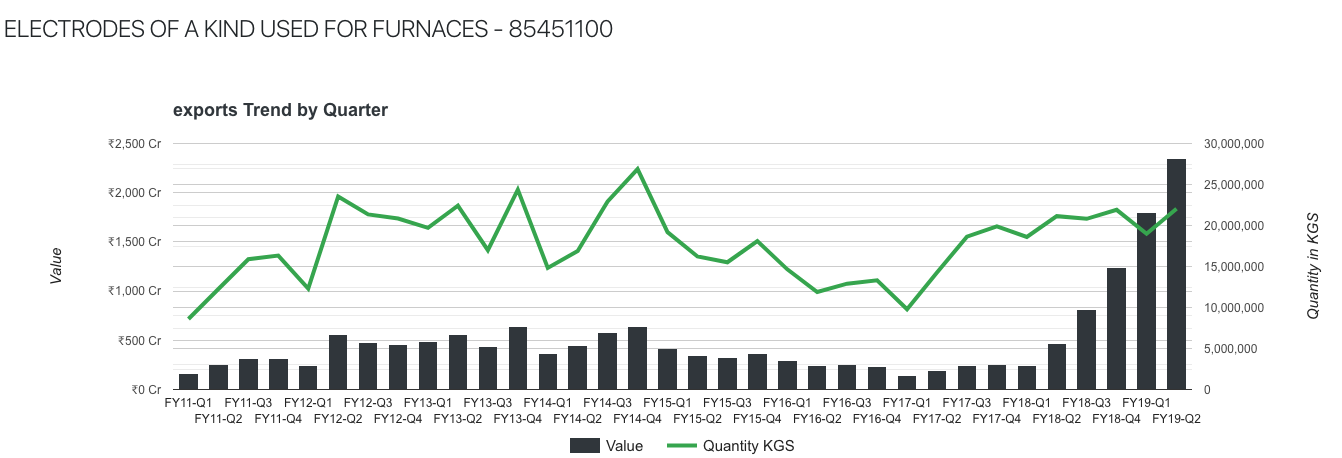
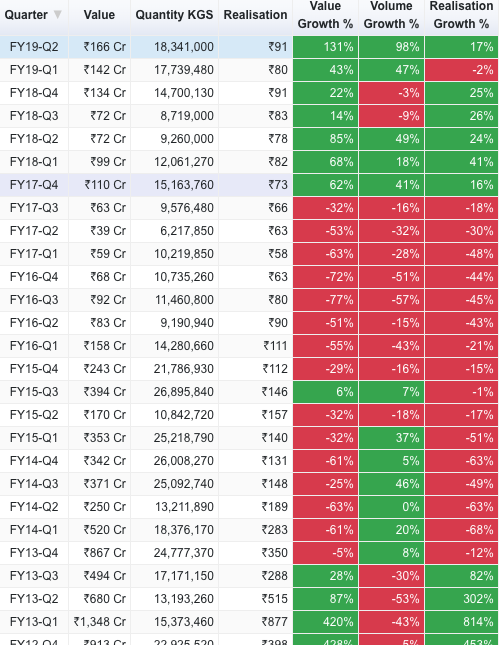
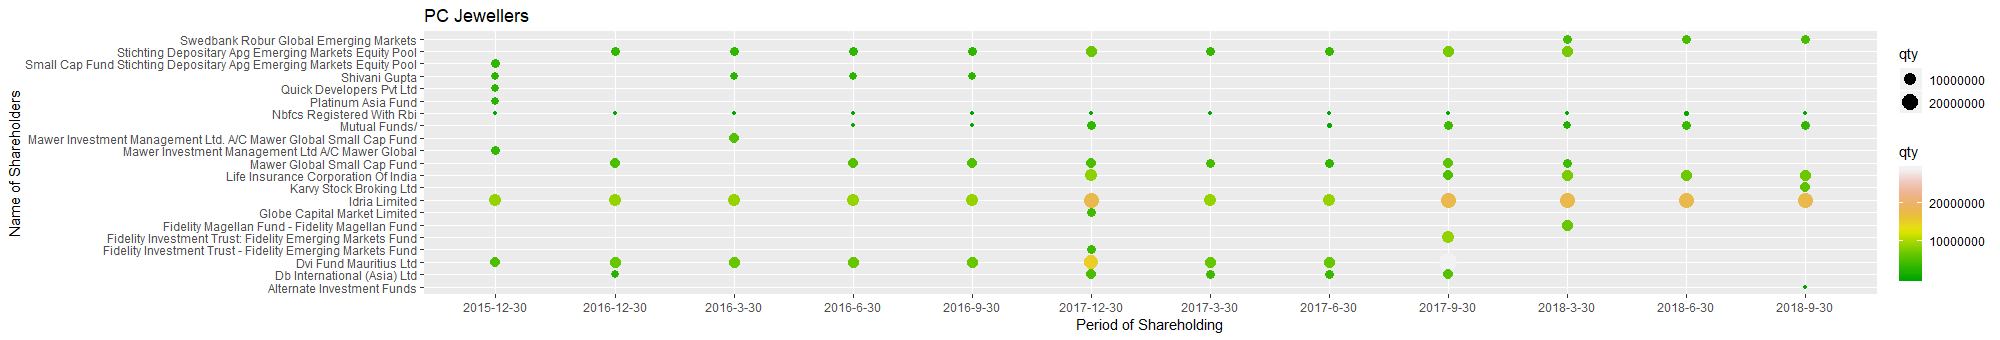
You can look up Graphite Electrodes and see the strong trend.
Exports have grown a lot in value while volume have stayed flat
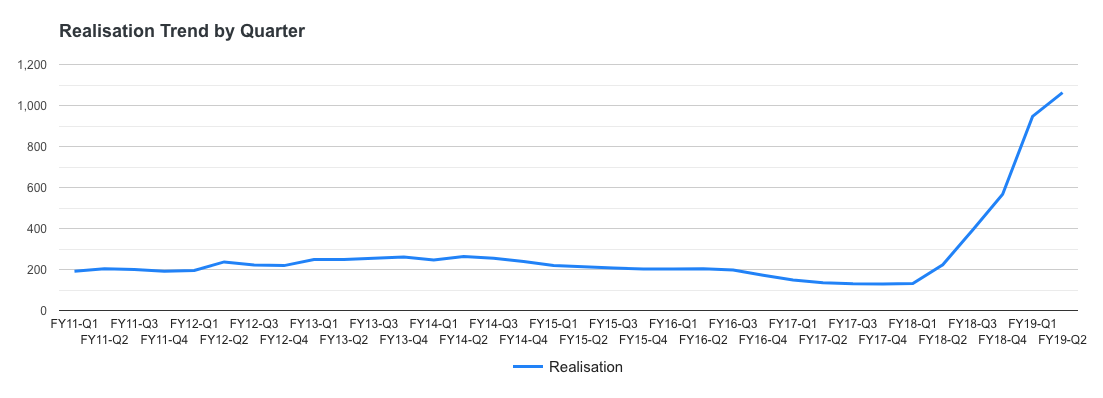
While realisations have gone through the roof.
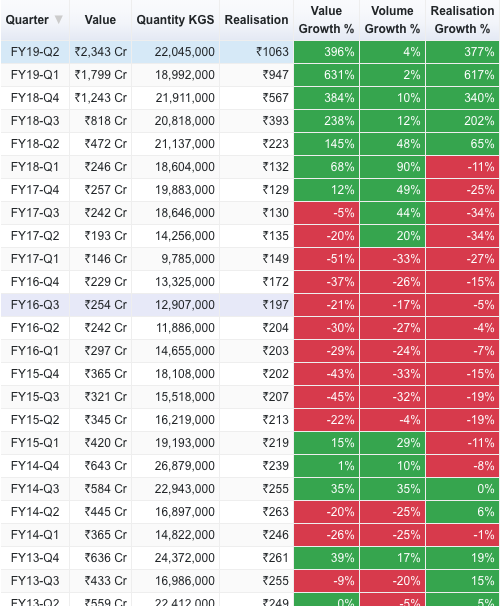
Substantiated by the numbers
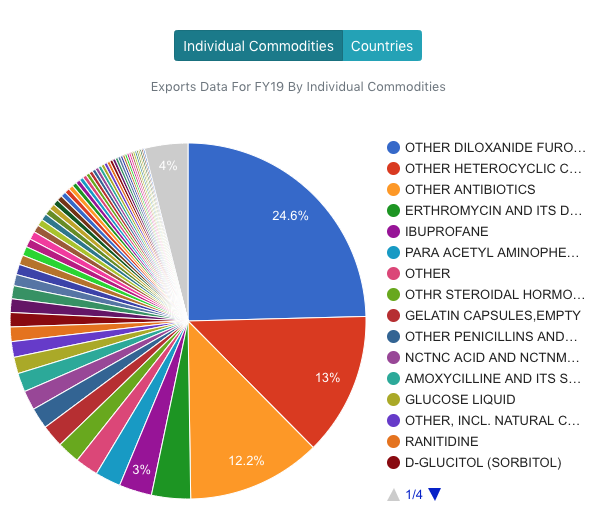
The new feature actually lets you drilldown from the “Micro” Screens to the individual commodities. By clicking on the slice of the pie, you can get to the screens for individual commodities and see their export/import trends, realisations, volumes etc.
Bulk drugs
Organic Chemicals
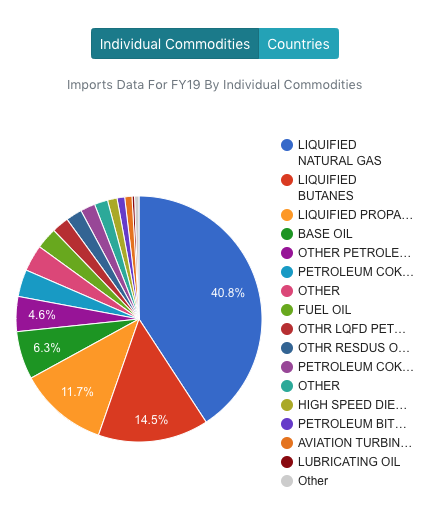
You can look at Individual commodity imports as well.
You would have seen Petroleum Products imports earlier but would have had no clue what comprised of it. But now you can see this information.
and of course, drilldown to say, LNG imports by tapping that slice of the pie.
Current Trends is also enhanced to see Current Trends of Individual Commodities.
Note:
- The Individual Commodity module data requires login. The signup is simple. This module might be priced at a nominal cost in the future but for now, it’s free.
- Individual Commodity data is only available till Sept
- The usual warnings/disclaimers apply. I am not responsible for any profits/losses you make by using this data and I cannot vouch for its accuracy as the information is represented as is.
- If you spot any early trends, please be nice and share.
- Like the earlier data was an indicator of where the sector was going, this is an indicator of where a commodity is going, benefitting from it would require identifying companies with good financials and management, so please use the data with caution. Also, this is just an indicator of topline. The margins will dictate if the company will be profitable or not even in a commodity showing good export growth.
- With a bit of work, import substitutions can be identified. I intend to do an Exports vs Imports (similar to what’s in the Macro screen) sometime in the future.
- This is meant to be used on a big screen. Nothing is optimised for mobile screens as I never use them for serious work.
- Please provide your feedback/suggestions and please let me know if you spot any bugs.