This is very surprising to see considering the number of frauds in the financial industry this past decade.
Source: tickertape.in
2 Likes
There is a case for investing in the PSU Banks as their balance sheets are becoming clean and they are considerably cheaper than the Pvt Banks. Bank of Baroda (BB) and Canara Bank (CB) are two, that are amongst the country’s premier PSU Banks after SBI. Syndicate Bank was merged with Canara Bank, while Dena and Vijaya Bank were merged with Bank of Baroda.
While a good rise in their stock prices has already been seen, the investment case still looks promising given the improvement in growth visibility, reduction in the Covid related risk and a clear demonstration of improvement in business metrics by the above two banks. Valuations also give a comfort, despite the rise
The attempt here’s to undertake a comparison of these two similar sized banks
| Amounts in Rs Crs | CB | BB |
|---|---|---|
| 9 Mths | Dec-21 | Dec-21 |
| Total Interest Earned | 51,549 | 51,707 |
| Total Interest Expense | 32,171 | 27,698 |
| Net Interest Income | 19,378 | 24,009 |
| Other Income | 12,035 | 8,962 |
| Total Income (NII + Other Y) | 31,414 | 32,971 |
| Employee Cost | 9,476 | 9,276 |
| Other administrative Exps | 5,050 | 6,941 |
| Total Operating Expenses | 14,526 | 16,218 |
| Cost To Income Ratio | 46.24% | 49.19% |
| Profit before Tax and Provisions | 16,887 | 16,753 |
| Provisions and contingencies | 9,064 | 9,266 |
| Exceptional item | 1,355 | - |
| PBT | 6,468 | 7,488 |
| Income Tax | 2,456 | 1,994 |
| Tax Rate | 37.97% | 26.63% |
| PAT | 4,012 | 5,494 |
While BB has higher NII, CB has reported higher other income. However, upon diving into the breakup, we find there is a significant “Others” in CB, which we don’t know
| Amounts in Rs Crs | CB | BB |
|---|---|---|
| 9 Mths | Dec-21 | Dec-21 |
| Fee Based Income | 4,221 | 4,562 |
| Trading Income | 2,070 | 2,592 |
| Recovery in Written off a/cs | 1,954 | 1,594 |
| Others | 3,790 | 214 |
| Total Other Income | 12,035 | 8,962 |
From the composition of the PBT we find that Corporate/Wholesale banking for BB has become profitable compared to CB. As against Retail making a chunk of BB profits, treasury profits comprise a significant portion of CB’s profits. However, BB has a huge Rs 4261 Crs of unallocated cost which hides the actual segment profitability. To note CB doesn’t have any unallocated cost
| Amounts in Rs Crs | CB | BB |
|---|---|---|
| 9 Mths | Dec-21 | Dec-21 |
| Treasury | 6,486 | 3,619 |
| Wholesale Banking | -4,135 | 1,802 |
| Retail Banking | 4,117 | 5,979 |
| Other Banking | 349 | |
| Total | 6,468 | 11,749 |
| Unallocated Cost | 4,261 | |
| PBT | 6,468 | 7,488 |
On the Balance sheet BB has lower equity, a plus. CB is also higher leveraged at present compared to BB
| Amounts in Rs Crs | CB | BB |
|---|---|---|
| 9 Mths | Dec-21 | Dec-21 |
| Share Capital | 1,814 | 1,036 |
| Net Worth | 48,102 | 61,161 |
| Asset Size | 11,94,727 | 11,97,054 |
| Deposits | 10,43,351 | 9,78,034 |
| Advances | 6,92,167 | 7,32,164 |
Looking at the key ratios we find that BB scores better on most of the parameters
| Amounts in Rs Crs | CB | BB |
|---|---|---|
| 9 Mths | Dec-21 | Dec-21 |
| Net Interest Margin (%) | 2.79% | 3.13% |
| CASA Ratio | 34.60% | 44.28% |
| Return on Assets | 0.45% | 0.62% |
| Cost To Income Ratio | 45.85% | 49.03% |
| % of Gross NPAs | 7.80% | 7.25% |
| % of Net NPAs | 2.86% | 2.25% |
Market also seems to be valuing BB better than CB
| Valuation Ratios on 7 February 2022 | CB | BB |
|---|---|---|
| P / BV | 0.75 | 0.71 |
| PE | 7.42 | 11.49 |
At P/BV of 0.75 there is an upside visible if the current scenario continues. Initial rise in the benchmark interest rates will also augur well for the banks as it will improve the NIM.
3 Likes
Came across this video explanation regarding banking and nbfc sector.
As a beginner, I find it very helpful to learn different aspects of the industry and what drives the valuations, risks etc.

If you find it helpful, do search his name on YouTube there’s another video which is 2 years old, even though there is a lot of overlap, there are different bits of insights in that one with omkara capital
5 Likes

1 Like
no one can predict markets.
after watching the (2 year old) SOIC finance video, everyone will be compelled to buy the private banks. the speaker also talks a lot about HDFC bank and its consistency.
in the last 2 years, public sector banks fared better than the picks of the think tanks.
since returns are relative to time, maybe in the future private may outperform public sector banks, (as always, no one knows)
(similar case with microfinance industry, eg: arman finance)
1 Like
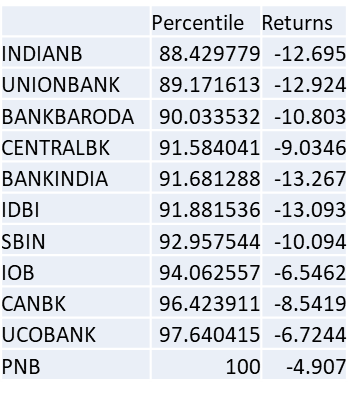
PSU Bank Percentile vs Returns since Qtr results
| Percentile | Returns | |
|---|---|---|
| IDBI | 72.65 | -7.94 |
| CENTRALBK | 74.77 | -6.61 |
| CANBK | 76.54 | -3.94 |
| SBIN | 78.18 | -3.65 |
| BANKINDIA | 80.74 | -8.21 |
| J&KBANK | 81.73 | -1.51 |
| BANKBARODA | 82.43 | 0.46 |
| IOB | 84.32 | -6.29 |
| PSB | 85.70 | -8.04 |
| PNB | 85.81 | 2.15 |
| UNIONBANK | 85.81 | 4.59 |
| INDIANB | 89.13 | -2.51 |
| MAHABANK | 95.36 | 0.66 |
| UCOBANK | 100.00 | -3.28 |
Private Bank Percentile vs Returns since Qtr results
| Percentile | Returns | |
|---|---|---|
| INDUSINDBK | 94.06 | -27.32 |
| ICICIBANK | 95.96 | 2.62 |
| AUBANK | 96.15 | -17.69 |
| CUB | 96.16 | 16.36 |
| YESBANK | 96.24 | 2.32 |
| KOTAKBANK | 97.47 | -6.81 |
| BANDHANBNK | 97.79 | -5.5 |
| HDFCBANK | 98.01 | 5.33 |
| RBLBANK | 98.10 | -25.56 |
| AXISBANK | 98.29 | -5.33 |
| IDFCFIRSTB | 99.33 | -5.83 |
| FEDERALBNK | 100.00 | 5.28 |
Based on P&L Quarterly&Annual, Balance Sheet, Cash Flow, Valuation, Share Holding and Momentum
1 Like
PSU Bank Percentile vs Returns since Qtr results
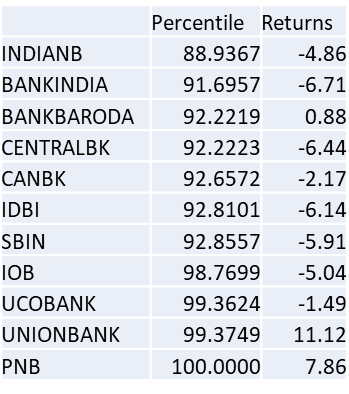
Based on P&L Quarterly&Annual, Balance Sheet, Cash Flow, Valuation, Share Holding and Momentum
1 Like
PSU Bank Percentile vs Returns since 12-Nov-24