Background & Investment Thesis
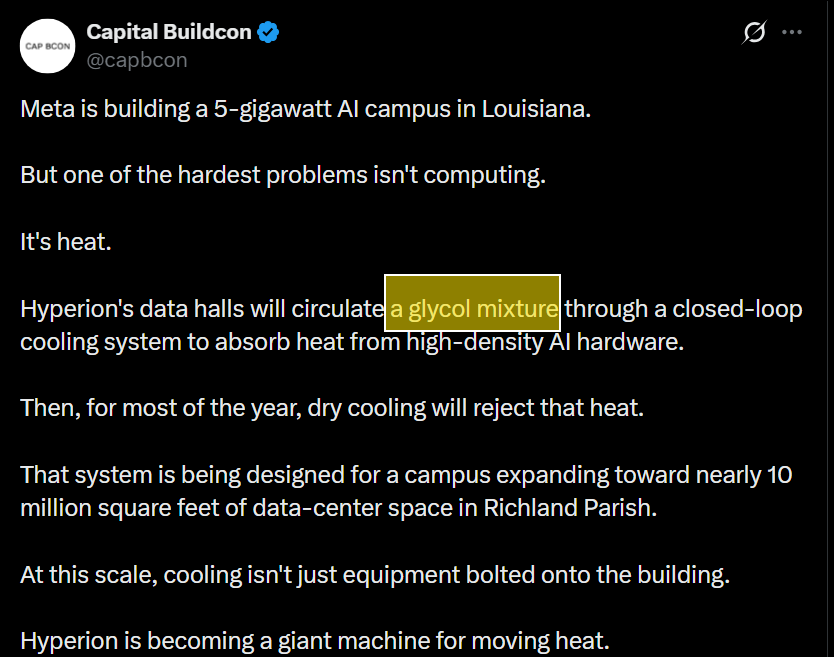
So we all know how Ukraine destroying Russian refineries, the Houthis destroying Saudi infrastructure, and the blockade of Hormuz has sent crude prices through the roof. And so many of the chemicals used in specialty and pharma companies are crude-based, so obviously with rising crude prices, commodities also rose, especially the crude-derived chemicals.
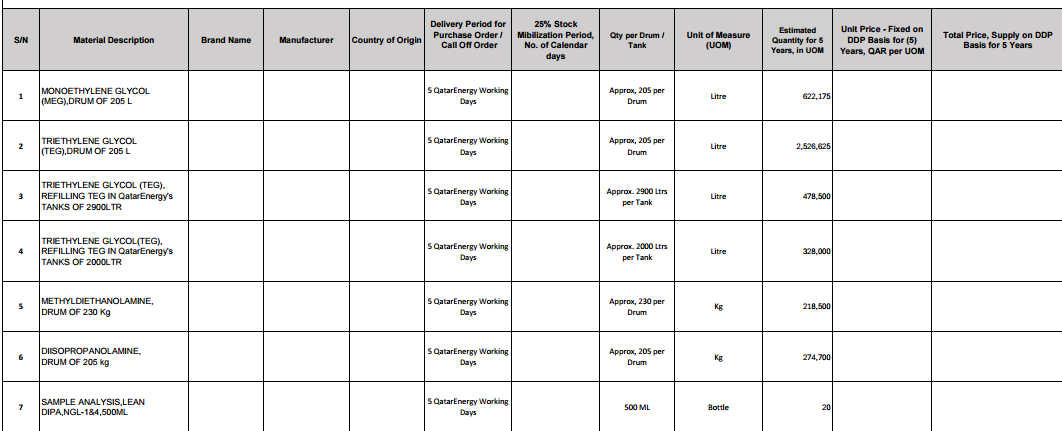
I was looking for an opportunity where I could capture this spread, as the rise in chemicals is way more than the rise in crude. I missed the sulfur crunch and the sulphuric acid spread, so I started searching for such chemicals. Then a news article I’d read some time back hinted that Mono Ethylene Glycol and Diethylene Glycol were going up. So I checked who was making these chemicals in India, and among the companies, the one I liked the most was India Glycols.
What I didn’t know was that I was in for a treat; India Glycols makes glycol not from crude, but rather from green (bio-based) substrates. Even though glycol made this way is more expensive, many pharma and cosmetic companies buy from them to gain ESG points. But since crude is getting more expensive, the price gap between green glycol and crude-based glycol has narrowed further, so they should get more sales. Yippee.
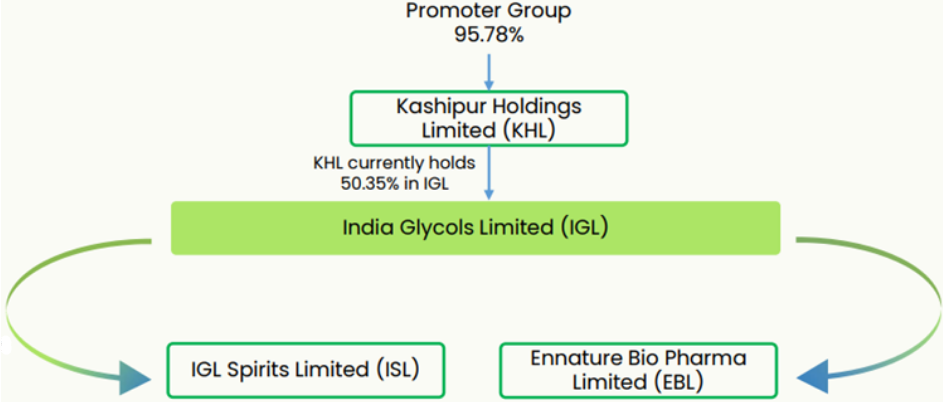
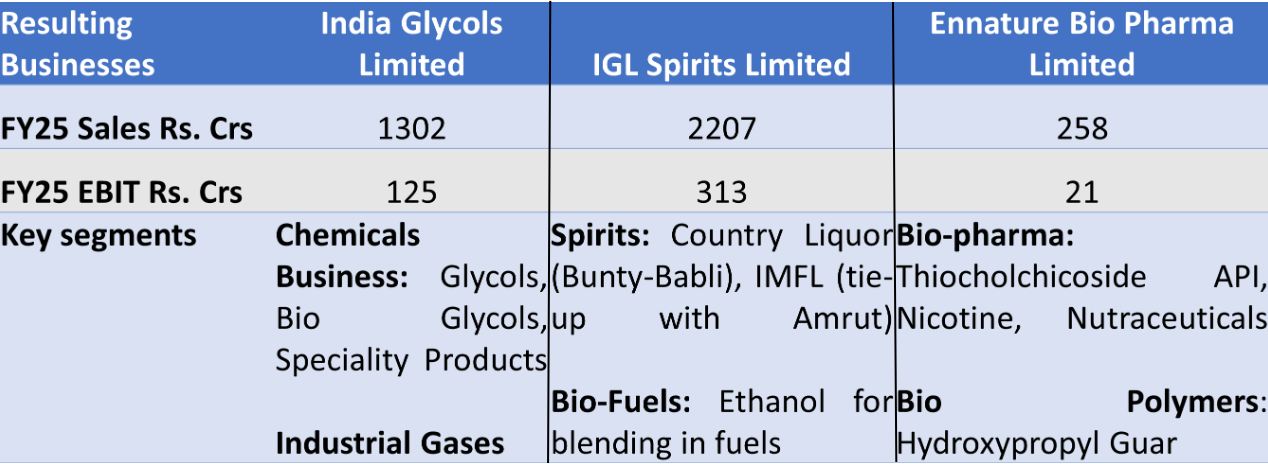
The company actually had three verticals, among them the glycol vertical, which is now the only listed entity that will be the discussion today (other 2 got demerged).
I’m not from a finance background, so I’m sharing all this in the hopes that I can discuss this opportunity with you all and learn from you all as well (also using LLM for formatting and grammar)
Business Overview & Segment Mix
India Glycols Limited (IGL) is a pioneer in green chemistry, having established the world’s first commercial production facility for Ethylene Oxide (EO) and Monoethylene Glycol (MEG) from renewable agricultural feedstocks (molasses and bio-ethanol) in 1989. Post-demerger (effective September 2026), standalone IGL operates purely as a specialty green chemical and industrial gas manufacturer.
Core Product Lines & Segment Portfolio
-
Bio-based Specialty Materials & Bio-Glycols: Monoethylene Glycol (Bio-MEG), Diethylene Glycol (DEG), Triethylene Glycol (TEG), Heavy Glycols, and renewable agro-route ethanol derivatives. Bio-MEG serves as a drop-in sustainable substitute for fossil-derived MEG in PET packaging and polyester textiles.
-
Ethylene Oxide (EO) Derivatives & Glycol Ethers: Ethylene Glycol Monoethyl Ether, Glycol Ether Acetates, and GE Esters. IGL is the only Indian producer using continuous Sulzer Chemtech technology for glycol ethers with integrated captive Bio-EO feedstock.
-
Specialty & Performance Chemicals: Bio-based amines, specialty ethoxylates, PO-derivatized guar biopolymers, green solvents, crop protection additives, wire enamel resins, and personal care/pharma ingredients. This segment includes IGL’s 49:51 joint venture, Clariant IGL Specialty Chemicals Private Limited, which operates as a leading producer of green specialty surfactants.
-
Industrial Gases: Liquid Oxygen, Liquid Nitrogen, Liquid Carbon Dioxide, Argon, and Sterigas produced as process adjacencies.
| Segment Line | Revenue Contribution (Run-Rate / Split) | Revenue Share (%) | Key Product Offerings |
|---|---|---|---|
| Bio-based Specialty Materials | ₹546 Cr | 51% | Bio-MEG, Bio-DEG, Bio-TEG, Bio-EO |
| Sustainable & Performance Chemicals | ₹474 Cr | 44% | Glycol Ethers (₹221 Cr), Performance Chem (₹56 Cr) |
| Industrial Gases | ₹46 Cr – ₹50 Cr | 5% | Liquid CO2, O2, N2, Argon, Sterigas |
| Total Retained Chemicals | ₹1,066 Cr – ₹1,070 Cr | 100% | Excludes Clariant JV Sales (₹419 Cr) |
Reconciled Historical Segment Trend (Bio-based Specialities & Performance Chemicals - BSPC):
-
FY24: ₹1,626.46 Cr (Segment EBIT: ₹132.63 Cr, 8.15% margin)
-
FY25: ₹1,341.00 Cr / ₹1,342.00 Cr (Segment EBIT: ₹121.11 Cr / ₹125 Cr, 9.03% – 9.3% margin)
-
FY26: ₹1,202.07 Cr / ₹1,203.00 Cr (Segment EBIT: ₹138.27 Cr / ₹141 Cr, 11.50% – 11.7% margin)
Reconciliation Note: The ₹1,066 Cr – ₹1,070 Cr run-rate table reflects the product-level net revenue snapshot from investor presentations, whereas the ₹1,202.07 Cr audited segment figure represents gross segmental top-line. Top-line contracted ~10.4% YoY in FY26 due to global destocking, but segment EBIT grew +12.5% YoY due to a strategic shift into higher-margin performance chemicals.
Core Product Lines & Segment Portfolio
-
End-Industries: Personal care, pharmaceuticals, packaging (sustainable PET bottles), automotive (brake fluids and wire enamels), textiles, agrochemicals, oil & gas, pulp & paper, metal/steel, and electronics.
-
Key Customers: Global FMCG brand owners, beverage majors, pharmaceutical formulation companies, agrochemical producers, and global specialty chemical marketers via the Clariant JV.
-
Raw Material Dependencies:
- Primary input: Grain-based and waste-based ethanol, sugarcane molasses, and agricultural feedstocks.
- Raw Material Shift: IGL has migrated towards grain-based ethanol and broken rice for captive chemical conversion, reducing exposure to volatile open-market molasses cycles.
- Crude Oil Linkage: Fossil-derived MEG/EO prices move with ethylene and crude oil prices. When petro-MEG prices fall due to low crude oil prices or global overcapacity, Bio-MEG spreads compress.
TAM / Market Sizing & Positioning
Company filings and the Scheme of Arrangement do not cite a single explicit numerical Total Addressable Market (TAM), although management does cite that ~90% of global chemical feedstocks were fossil-based in 2023. Global sustainability mandates target 20% bio-based feedstock adoption by 2050, with the addressable bio-based market expected to more than double by 2032.
Also:
- Decarbonization & Scope 3 Reductions: Global consumer brands are replacing fossil-derived PET and surfactants with bio-based alternatives to meet UNSDGs and net-zero targets.
- Regulatory Shift: Strict environmental regulations in Europe and North America favour bio-solvents, bio-amines, and non-toxic glycol ethers over traditional petrochemical solvents.
- Import Substitution: Expanding domestic demand in India for specialized ethoxylates, PO-derivatized guar polymers, and electronic-grade industrial gases currently met via imports.
Competitive Positioning & Named Peers
-
Bio-EO & Bio-MEG Leadership: IGL is the world’s first and largest producer of Ethylene Oxide and Monoethylene Glycol via the renewable agro-route.
-
Glycol Ethers Dominance: IGL is India’s sole manufacturer of glycol ethers using a continuous Sulzer Chemtech process integrated with captive Bio-EO.
-
Bio-Amines: IGL operates as the world’s first commercial manufacturer of bio-based amines.
Capacity & Utilization
Installed Capacity Allocation (Scheme of Arrangement & Filings)
- Performance Chemicals Capacity: 35,000 MTPA across ethoxylates, esters, and formulation lines.
- New Speciality Unit (NSU Phase I & II – Kashipur): 7,500–10,000 MTPA installed capacity dedicated to carbon-smart and high-value green specialty chemicals, completed at a capex of ₹82 Cr.
- Bio-MEG / EO Plant Capacity: Historical base capacity exceeding 100,000 MTPA of combined EO equivalent at Kashipur, Uttarakhand.
Utilization Rates & Historical Trend
- Bio-MEG / Commodity Glycols: Historically operated at moderate utilization (50%–65%) due to petro-MEG supply dumping from Asian and Middle Eastern petrochemical crackers.
- Specialty & Performance Chemicals: Utilization has remained high (75%–85%+), driving management’s strategy to divert captive Bio-EO away from commodity MEG into high-margin specialty ethoxylates and glycol ethers.
Announced Capex & Expansion Timelines
- Specialty Conversion Capex: Ramping up utilization of NSU Phase II and value-added derivative units through FY26/FY27. Planned total company capex for FY26 was ₹150 Cr.
- Capital Allocation: Future capex is focused entirely on niche green molecules, bio-polymers, and application-led specialty chemicals rather than bulk commodity glycol expansions. Surplus accruals are directed to debt prepayments
Financial (Standalone, Post-Demerger)
Because pre-demerger PAT includes Spirits and Ennature, standalone chemical PAT is not reported separately. Taking BSPC Segment EBIT (₹138.27 Cr) + Clariant JV PAT share (₹46.42 Cr) = ₹184.69 Cr PBT/EBIT, and deducting estimated standalone tax/interest (est. ₹60 Cr), Estimated Standalone Chemical PAT is ~₹124.69 Cr, yielding an Estimated Standalone Chemical EPS of ~₹18.61/share.
| Metric (₹ Cr) | Q4 FY25 (31-03-2025) | Q3 FY26 (31-12-2025) | Q4 FY26 (31-03-2026) | Full Year FY25 | Full Year FY26 | |||||
|---|---|---|---|---|---|---|---|---|---|---|
| Segment Revenue | 253.59 | 312.98 | 302.55 | 1,341.00 | 1,202.07 | |||||
| Segment EBIT | 26.76 | 41.13 | 34.47 | 121.11 | 138.27 | |||||
| Segment EBIT Margin (est.) (%) | 10.55% | 13.14% | 11.39% | 9.03% | 11.50% |
Table (i): Standalone Bio-Based Specialities & Performance Chemicals Segment Performance
| Balance Sheet Line Item (₹ Cr) | FY25 (31-03-2025) | FY26 (31-03-2026) | YoY Change (%) |
|---|---|---|---|
| Retained Chemical Segment Assets | 3,543.43 | 3,595.99 | 0.0148 |
| Retained Chemical Segment Liabilities | 929.71 | 737.05 | -20.72% |
| Net Retained Capital Employed | 2,613.72 | 2,858.94 | 0.0938 |
Table (ii): Standalone Chemical Segment Assets & Liabilities Summary (NCLT / Segment Report)
Debt estimated below
Forward-Looking Guidance
-
FY27 EBITDA Guidance: Management targets standalone chemical EBITDA in excess of ₹200 Cr for FY27, ramping up towards ₹400 Cr in the medium term.
-
4-5 Year Top-Line Target: Aspiration to scale standalone chemical business revenue to ₹2,000 Cr – ₹2,500 Cr.
-
Margin Trajectory: Target EBITDA margins of 16% – 20% (up from current ~11.5%) driven by NSU commissioning and high-value derivative sales.
-
Debt De-leveraging: Progressive debt reduction using internal cash generation to establish a debt-free operating model by FY28
(refer from page 9)
35d29fa8-a796-48f0-946c-1115f6beb401.pdf.pdf (859.5 KB)
Key Swing Factors and Risks
- Crude Oil & Naphtha Price Linkage: Petrodollar fluctuations directly affect petro-MEG prices, impacting IGL’s pricing power on Bio-MEG.
- Ethanol / Grain Feedstock Cost: Raw material costs depend on domestic ethanol blending allocation prices and sugarcane/grain availability.
- Export Container Freight Disruption: Profitability in export markets is sensitive to global shipping rates.
- Clariant JV Synergies: Upstreaming dividends and profit share from Clariant IGL Specialty Chemicals JV (contributed ₹46.42 Cr PAT share in FY26).
- Demerger Transition & Operational Separation Risks: Restructuring shared manufacturing facilities, utilities, and corporate overheads across Kashipur operations may introduce short-term operational frictions.
- Standalone Treasury & Credit Rating Re-assessment: Transitioning to independent bank limits and debt facilities while CARE Ratings keeps the company’s credit rating (CARE A-) on watch with developing implications.
- Raw Material Price Volatility & Spreads: Margins are highly dependent on the spread between ethanol procurement costs and fossil-derived ethylene/petro-MEG market prices.
- Customer Qualification & Approval Delays: Ramping up specialized ethoxylates and carbon-smart green molecules requires lengthy customer validation timelines with global FMCG and pharmaceutical clients.
- Export Logistics & Shipping Freight Volatility: Disruption in international ocean freight routes directly impacts export margins for green chemicals.
Back of the hand calculation for valuation
Inputs:
- Current Market Price (CMP): ₹380.00
- Shares Outstanding: 6.70 Cr shares (6,70,26,765 shares)
- FY27E Standalone EBITDA: ₹200.00 Cr (Management Guidance Baseline)
- Core EV/EBITDA Multiple: 14.0x (25% discount to 18x–25x peer average)
- Clariant JV PAT Share: ₹46.42 Cr (FY26 Share of Profit)
- JV P/E Multiple: 18.0x (Specialty Surfactants peer multiple)
Step-by-Step Calculation:
- Core Chemical EV: ₹200.00 Cr EBITDA × 14.0x = ₹2,800.00 Cr
- Clariant JV Equity Value: ₹46.42 Cr Profit Share × 18.0x = ₹835.56 Cr
- Total Enterprise Value + JV Stake: ₹2,800.00 Cr + ₹835.56 Cr = ₹3,635.56 Cr
Fair Value Derivation:
Out of the ₹1,561.06 Crore total liabilities remaining in India Glycols Limited, the borrowings are approximately ₹470 Crore (GeminiPro did the calculation). Management also said in the Q4FY26 concall that the standalone chemical entity’s annual interest cost will remain in the ~₹25 Crore range. At a 7% blended low-cost interest rate, ₹25 Cr in interest expense corresponds to an underlying loan balance of ~₹360 Cr. Therefore, assuming Net Debt = ₹400.00 Cr
- Implied Equity Value = ₹3,635.56 Cr − ₹400.00 Cr = ₹3,235.56 Cr
- Fair Value per Share = ₹3,235.56 Cr ÷ 6.70 Cr shares = ₹482.92 / share
- Upside vs CMP ₹380.00: +27.1%
Stress Testing & Commodity Price Sensitivities
Ethylene Glycol (EG / Bio-MEG) Market Spot Data & Trend Analysis
Per commodity tracking data from SunSirs as of September 24, 2026:
-
Spot Price Rally & Pullback: Domestically produced oil-based Ethylene Glycol spot prices surged by 68.77% YTD (from 3,864.17 RMB/ton on Jan 1, 2026, to a 4-year peak of 6,708.33 RMB/ton in mid-September), before pulling back 2.78% to 6,521.67 RMB/ton (~$925–$930/ton) as of September 23, 2026.
-
Historical Low Port Inventories: Spot inventories across major East China ports plunged from 926,400 tonnes in March 2026 to an all-time low of 99,000 tonnes by late September 2026 (a reduction of 827,400 tonnes).
-
Downstream Polyester Squeeze & Negative Feedback: High raw material prices squeezed PET bottle chip and staple fiber margins into negative territory, forcing downstream polyester operating rates down from historical peaks to ~74%.
-
Forward Structure: Near-month paper contracts maintain a firm basis (+1,200 to +1,600 RMB/ton), but forward late-October basis narrows to +390–410 RMB/ton as domestic coal/oil-based plants restart (operating rates rising from 76.8% toward 80% in October 2026).
Price Trends & Margins for Other Key Portfolio Chemicals
Ethylene Glycol Ethers (E-series vs P-series):
-
Market Trend: Global E-series ethylene glycol ethers experienced price headwinds and export volume pressure due to low-cost petro-based Chinese exports (butyl and propyl glycol ethers) supported by cheaper Chinese feedstock.
-
Margin Impact & Recovery Strategy: Global glycol ether demand is expanding at 5.5% CAGR. IGL is mitigating Chinese petro-based price dumping by positioning its bio-based glycol ethers as ISCC-certified green solvents with lower carbon footprints to command a 10%–15% green premium in European and Asian electronic/coatings markets. This allows segment EBITDA margins to recover toward historical double-digit levels (12%–13%).
Ethylene Oxide (EO) Spreads & Reliance Industries (RIL) Benchmark:
- Spreads & Competitiveness: In India, IGL’s Bio-EO prices compete against Reliance Industries’ petro-derived EO. During periods of low crude oil ($60–$70/bbl), Bio-EO faced a price disadvantage. However, in 2026, as Asian ethylene benchmark prices climbed to 4-month highs (~$1,020–$1,030/MT) due to Middle East supply/shipping tensions, petro-EO prices moved higher, making IGL’s Bio-EO prices competitive or lower than RIL’s prices. This has restored full off-take from the Clariant JV and expanded captive ethoxylate gross margins toward 50%.
Bio-Ethanol Feedstock Costs:
-
Cost Trajectory: Bio-ethanol spot prices in India peaked near $815/MT (~₹68–₹70/L) in Q1 2026 driven by OMC fuel blending mandates.
-
Margin Mitigation: Domestic grain-based alcohol prices stabilized, and IGL’s dual-feedstock flexibility (grain, broken rice, molasses) allowed it to stop expensive ethanol imports and utilize lower-cost domestic grain alcohol as chemical intermediates.
Because IGL has shifted ~44% of its retained chemical portfolio into value-added Performance Chemicals and Glycol Ethers, its sensitivity to bulk MEG spot prices has significantly reduced compared to prior cycles. Even under a severe Bear Case (MEG dropping below 4,500 RMB/ton), the standalone entity is expected to generate ₹130–150 Cr EBITDA due to high-margin ethoxylates, bio-amines, and industrial gases.
disclaimer- lots of LLM was used to extract information from cooperate documents pertaining to demerger and AR, invested