IDFC First Bank has become a FOMO investment for many, including myself largely because of the trust investors have in Mr. V. Vaidyanathan’s past track record.
After doing my own analysis as a relatively new investor, I noticed both pros and cons worth highlighting.
Pros & Positives
1.GNPA < CAR and GNPA < NIM
The bank has consistently maintained this.
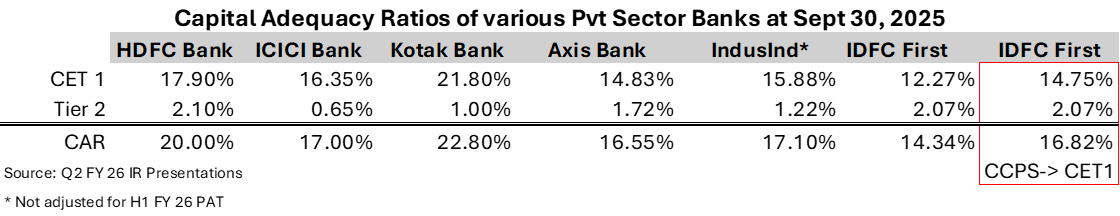
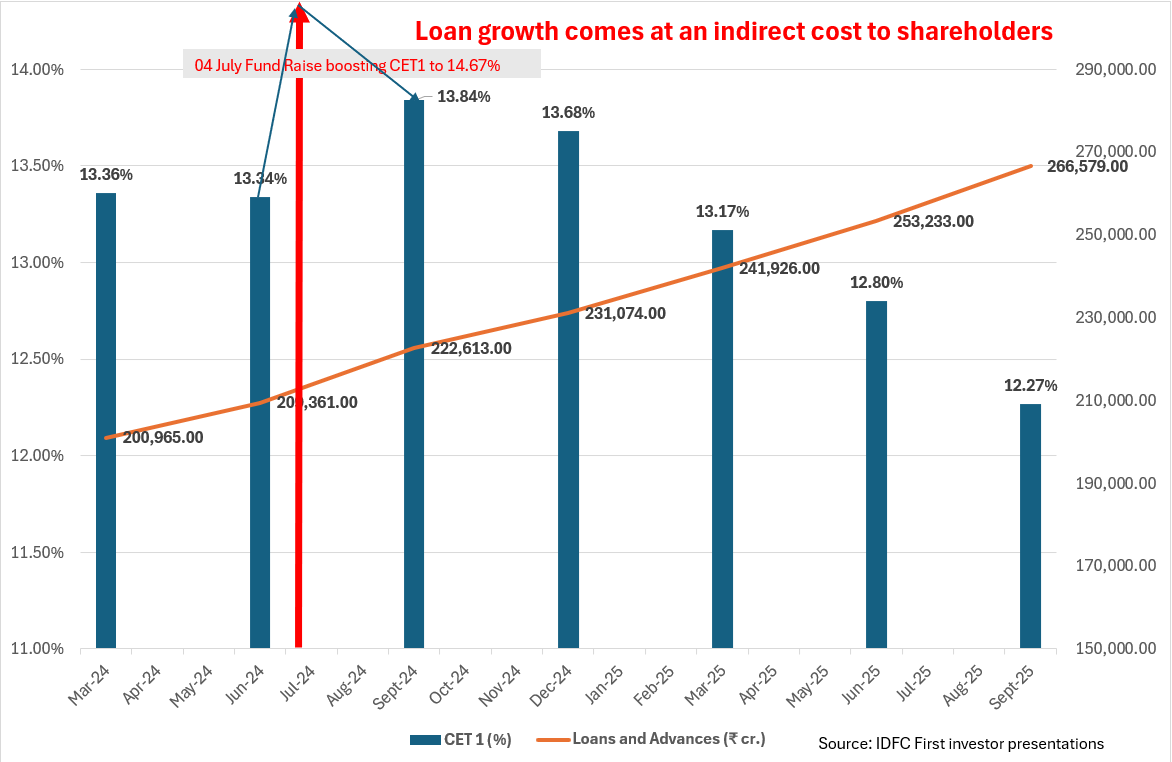
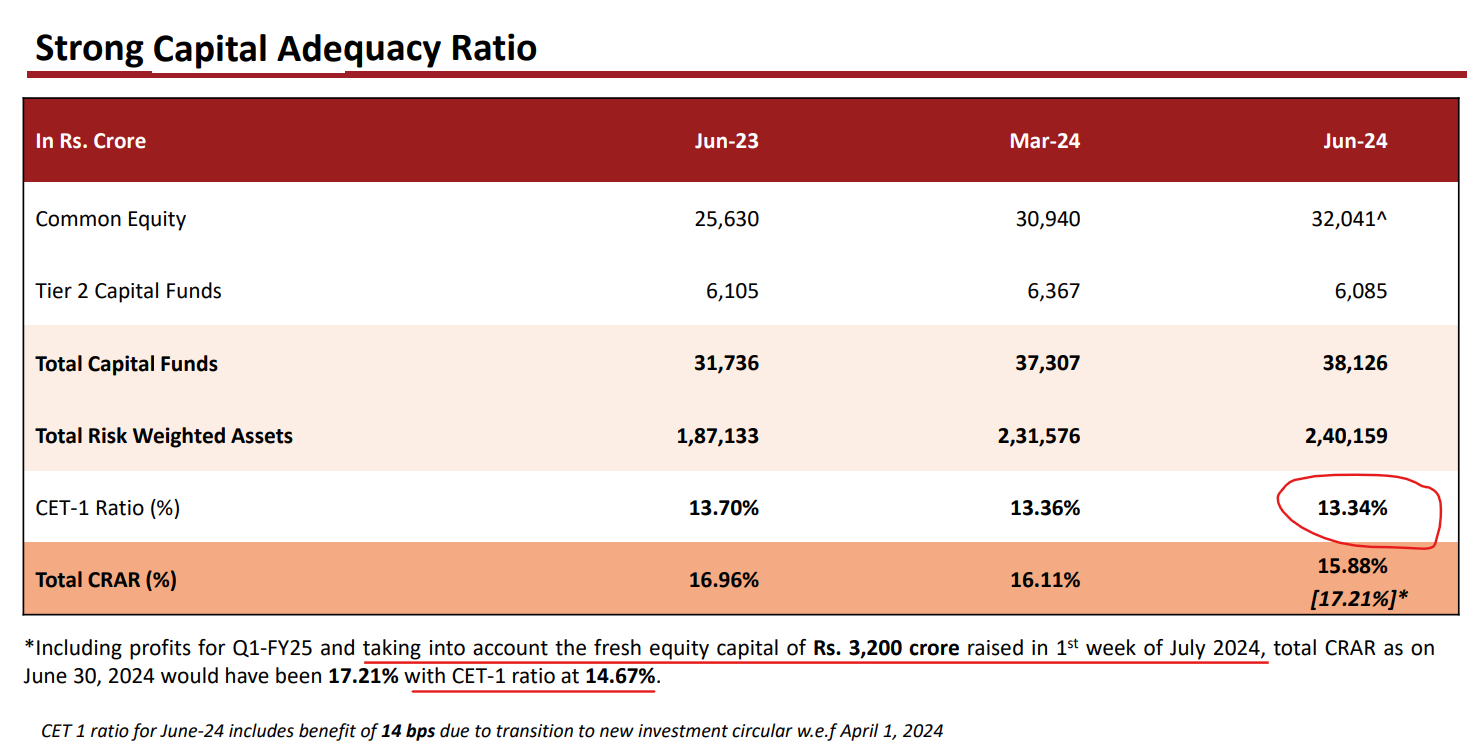
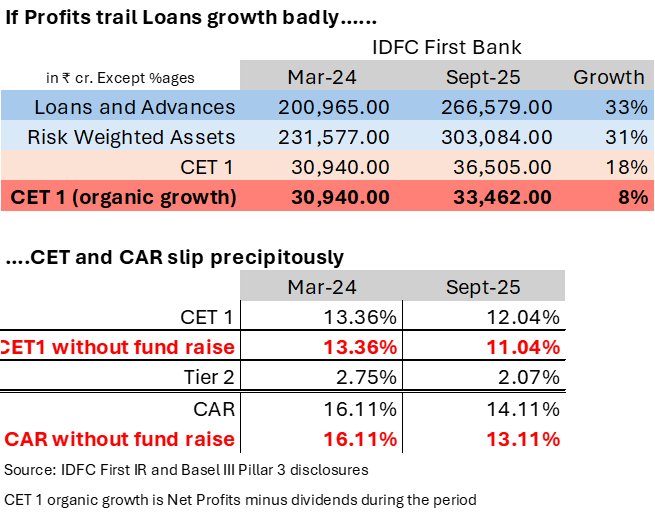
However, CAR has been declining for 3–4 years and is being propped up via capital raising.
But NIM improvement depends heavily on the cost of funds, which hasn’t reduced yet.
2. CASA Growth
CASA growth remains strong, a good sign.
A growing CASA base supports cross-selling and higher fee income, which is currently ~14%. I expect this could touch ~18% in the coming years.
3. Concentration Risk
Top 20 advances, depositors, and exposures look well-distributed.
4. Divergence
No divergence reported since 2019, a healthy indicator.
5. Yield on Advances
Currently around 15%, which is good. It would be even better if it moves toward 18%.
Mixed Bag – Areas to Watch
1. Secured vs Unsecured Lending
The bank’s secured lending ratio has been 50–60% for the past 5–6 years.
While some reports and rating agencies show 70–80%, the Annual Report (Schedule 9 – Advances) indicates otherwise.
A higher share of unsecured loans can:
- Make NIMs volatile
- Pressure CAR
- Limit aggressive future lending
So, while risk management is often praised, the real mix deserves a closer look.
2. Loan-to-Deposit (LTD) Ratio >100% since 2023
This should raise eyebrows, as it can signal tighter liquidity and reliance on borrowings.
3. Provision Coverage Ratio (PCR)
Was below 70% historically; now around 72% (FY25).
It would be more comforting to see this consistently above 75%.
4. Cost-to-Income Ratio
Persistently high at 70%+.
Despite guidance to bring it below 65% by FY25, it hasn’t materialized yet.
Concall explanations have been unconvincing so far.
5. Contingent Liabilities
Consistently over 100% of total assets, making the balance sheet riskier.
Also, since 2023, there’s a ~50 bps difference between ROA and Return on Risk-Weighted Assets worth monitoring.
6. Financial Leverage
Historically above 9x, now at 8.21x.
Would be healthier if the bank sustains growth with leverage between 7–8x.
Other Metrics
- Slippage Ratio: Improved from ~3% (FY23) to 1.85% now. Aiming below 2%/1.8% would be ideal.
- Credit Cost: ~2%, I am okay as this is a young & growing bank(at snail’s pace).
- Employee Turnover: Manageable; not a major concern for me yet.
- ROA: Only crossed 1.1% in FY23–FY24. Only a sustained ROA >1.1% for a few quarters in the future will make the market to assign >2x book valuation. Else it gonna trade 1.2x to 1.5x for many weeks.
- ROE: Naturally tied to ROA; leverage is in line.
- Dividend: Surprising, given the capital needs reinvestment might have been better.
Valuations & Outlook
- Book Value per Share: ₹54.20
- Given the current risks and the bank’s early growth phase, I assign a fair multiple of 1.1–1.2x Book Value.
- Until the bank demonstrates sustained NIM, CAR, and cost control improvements, I expect it to trade between 1.1x–1.5x book.
- Once it crosses 1.5x, many long-term investors (considering opportunity cost) might start booking profits.
Disc: I entered due to FOMO and have held it for ~1.5 years now, initially a small tracking position, now around 5% of my portfolio after averaging near book value.
I’ll reassess after the next few quarters’ results with a deeper dive into capital adequacy, unsecured lending trends, and cost-to-income metrics.
This is just my understanding, open to corrections or additional insights from others.