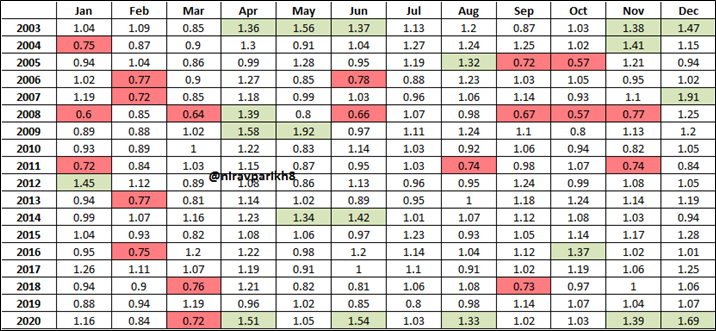
Red Box – Weak Breadth < 0.8
Green Box – Strong Breadth > 1.3
Observations
2020 has been preceded by rare event of 2 years of negative broad market returns. Such breadth thrust in 2020 is understandable and many comparisons have been drawn to 2003.
Back to back green box aren’t common and have happened in the years of market bottoms – 2003, 2009, 2014 and Now. Periods following such strong breadth thrust (even as start of bull market) have faced sub-par returns.
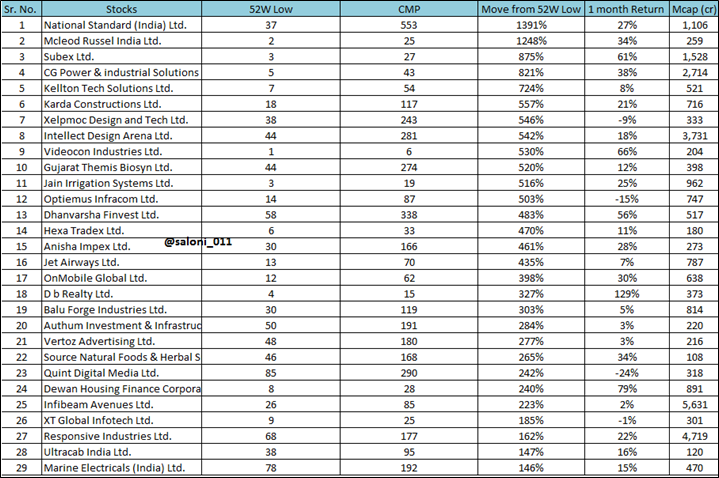
2. Junky Move
Junk stocks – largely defined as speculative stocks with business lacking fundamentals, CG issues, Broken Balance Sheet, etc.
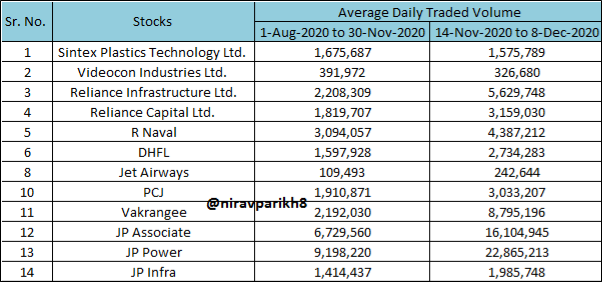
3.Market Participation
Market participation is being largely defined as BSE Traded Qty (Volume not Value). This removes discrepancy which can be caused by price spikes. It’s pure market activity.
BSE Volume – Qty Traded (Crores) (Daily Average)
Observations
Election years/events tend to have volume spikes. (April – June 2009, May-June 2014).
Similarly, markets coming out of bear markets tend to have high volumes following market bottoms. (June-Aug 2020).
Other periods of high market activity have resulted in large market correction in following months.
Persistent volumes over few days to couple of weeks over 40-50 crore shares have high probability of large correction being followed. Key is persistence – It shows market participation.
Conclusion Breadth + Junky Move + Volume Thrust indicates high probability of significant risk to the downside.
If you torture data long enough, it will confess anything.
For example, look at the counterview. As per your marketbreadth data, this year has five green boxes just like 2003. Similar to 2003, this year also we are coming out of multiyear bear markets. So it makes even more sense.
Moreover, anecdotal evidences like multibagger calls from Indore, high profile market coverage in general news cycles or complete strangers talking about their market kills are still absent from the market which is always evident during market peaks.
So, my personal feeling is that market may go for correction/consolidation for couple of quarters but it is highly improbable that this is the market peak. The winners may keep rotating but globally the markets are in a bullish cycle with abundant liquidity flow.
Data of three decades suggest that benchmark indices witness big correction after every 3-4 years. Or we can interpret that they rally for good 3-4 years (in a non-linear fashion) before taking a halt.
Major Correction Periods:
1991-1992: Harshad Mehta Scam
1995-1996: Rupee Depreciation
2000-2001: Dot Com Bubble Burst
2003-2004: Election Result - outgoing incumbent government
2008-2009: Global Financial Crises/Floor test of UPA
2012-2013: Taper Tantrums/Rising Deficits/Crude Price Surge
2016: China Production Slowdown Fears/Demonetization
2019-2020: Economic Slowdown/Covid-19
Likewise, on equanimity grounds, we can pull reasoning for major market rallies happening between these large correction periods. Value lies in the eyes of investor.
Stock market predictions are like earthquake forecasts. No one can tell what will be the degree and timing of upcoming catastrophe.
Note: The above trend is only an indication, not a confirmed signal for timing upcoming corrections. Future is an uncharted territory. It is always good to remain a student of “I don’t know” school and focus only on what we can know - strength in business of portfolio companies.
I would be equally concerned had junk ONLY been doing great. But look at what has been happening.Pharma was the first sector to make a bottom and rally from March lows.Chemicals,Agri were next in line.Then the rally in each of these sectors spread lower down the marketcap ladder.Back then the narrative was that the rally is “narrow” and led only by Reliance so it can’t sustain.Soon,Auto and IT sector started rallying.And IT gave good support to the upmove.Right uptil October financials were very weak and then post Q2 results and commentary they also started surging.I think in November itself,Bank Nifty went up 20%+.As of now,almost all sectors are doing well and a lot of “quality” names are doing well too.Today itself FMCG majors like HUL,Nestle,etc. have made a strong comeback.So why should a random JP Associates going 3x or 4x disturb the whole rally? If anyone remembers,this year itself Alok Industries went 20x+ from April to July.It is a known “junk” stock and stock went up extremely fast.Stock is now down 60% from it’s high of 58 but it hasn’t disturbed the market in any manner.What will happen is that Nifty or broader market will correct 10-12% and stocks like JP Assoc will fall much more and that will correct the excess.I don’t see why Unitech,etc. moving strongly should signal a market top.Had these stocks been rallying in isolation while “quality” laid low or went down then it would surely be scary imho.
Disc.: I remain almost fully invested and I didn’t get the market top of 2018 right so take my views with a pinch of salt.
Interesting views derived from long term historic data! Here is another view which looks at long term market data as well, but takes a statistical view of it, to hint at its inferences. Worth a read.
We don’t get anything useful from past data apart from experience. each time is unique so can’t map and predict future with past data. In that article they used 200 DMA to predict future. Analysing with 200 DMA and thinking price coming back to it is a flawed thinking. Actually it’s opposite, 200 DMA always follows price and when rate of change slows down it touches the price. Price never follows 200 DMA. It’s always lagging indicator not a leading indicator. It’s kind of illusion.
I think these days when algorithms and technical traders are in millions, lagging indicators like “Moving Averages” are maybe made a less lagging indicator. It still is lagging, but many lead their moves based on it, and when this is the case enmasse, what does that make it?
More recently, I have been using simple indicators to trade (3-6-9 months time frame), and notice that it is a rather good strategy in large cap compounders(20,000cr + mcap) where ROCE is a consistent 25% + in 3 & 5 & 7 years.
Basically in my experience, where business is stable and good and big, technical indicators work good, better than ‘buy and hold’ because in most cases these large caps runup and pause with a start-stop behavior.