Hi Hitesh bhai,
1 If one buys a stock on techno funda and target is achieved, can one hold for long term if prospects are good or one should adhere to the levels ? Also can both the strategies be combined i.e long term and technical ? If not, how to resist the temptation to convert techno funda picks to long term ?
2 Could you please suggest on how can one do detailed scuttle butt to know the sectoral trend?
And how does one detect sectoral trend reversal timely ?
Which other patterns can one follow apart from the ones you listed but which arent technical indicators ?
You can go back a few posts of this thread and go through 52 weeks high thread. All answers to your questions answered. No use repeating the same thing again and again…
And I agree with @StageInvesting when he expressed his views that not many boarders want to do the hard yards of reading a few books, reading threads properly and try to gain knowledge.
The aim of the forum is to try to educate investors so that they can take mature informed decisions on their own, and hopefully be on their way to financial freedom. Instead we get a lot of one liner questions like “What’s your view on X company” or something similar like it.
That’s an excellent answer. No stock tips but provide informed information which is helpful to analyse a company/or latest trend in any sector. Thanks Hitesh bhai.
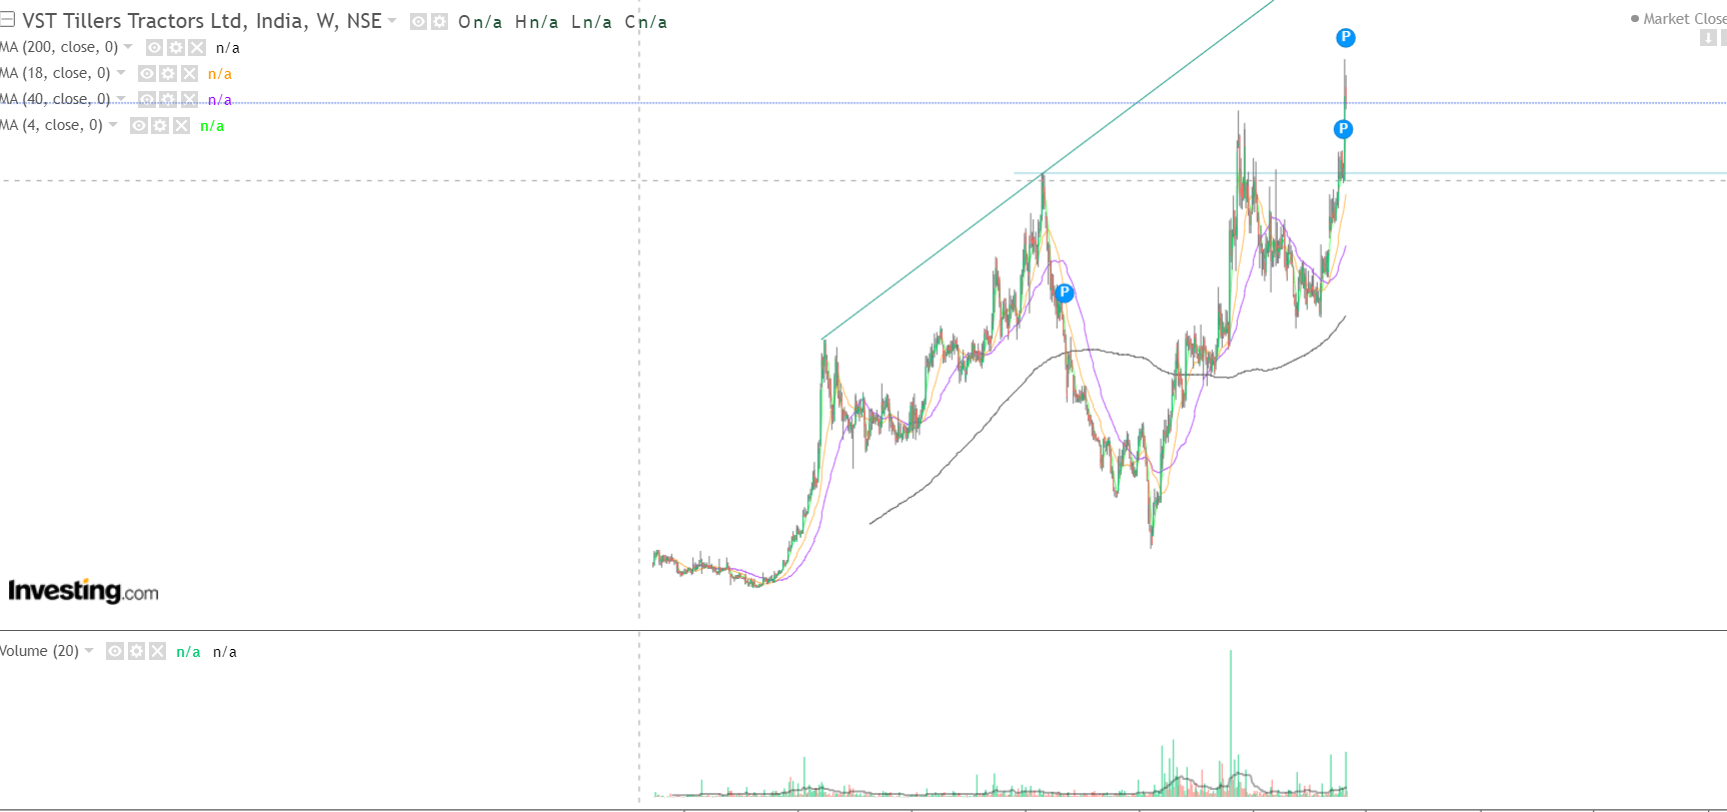
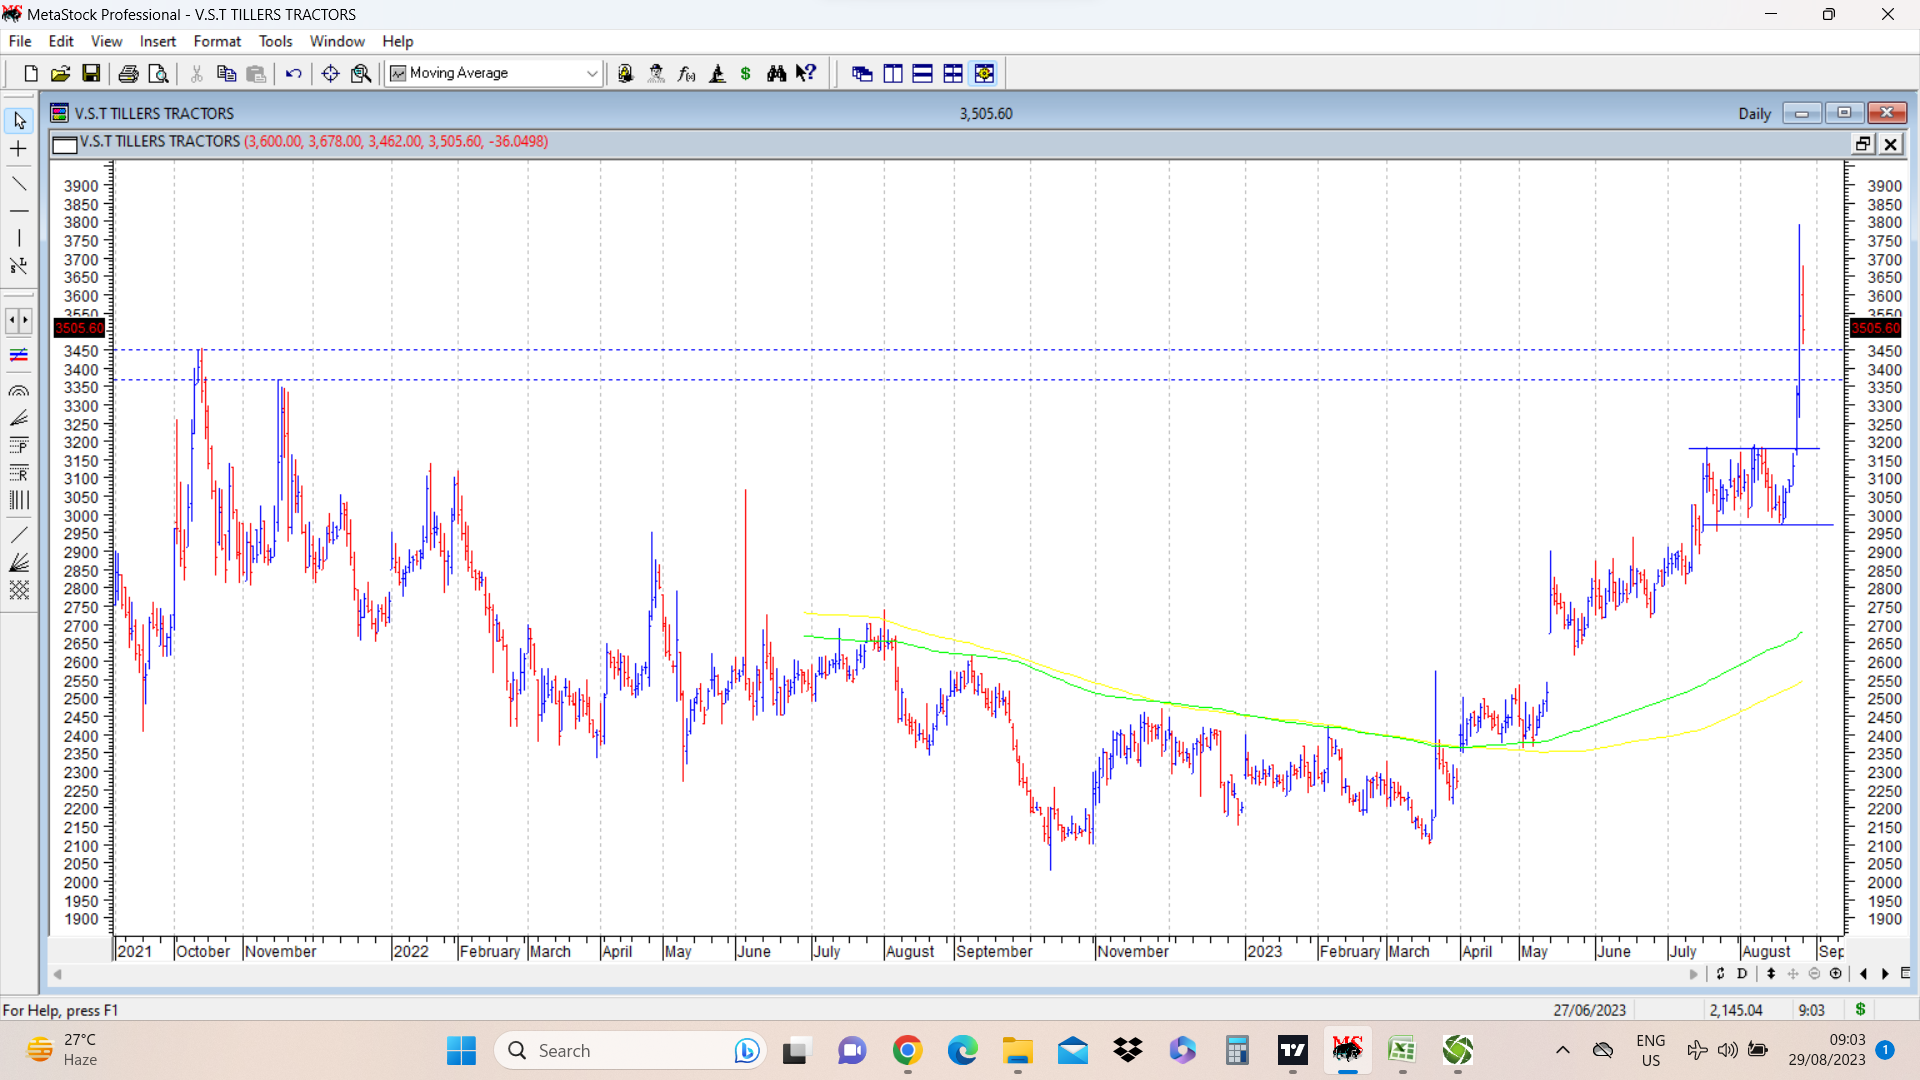
Hello sir, I have entered in this stock VST tailors when it broke 3458 life time high. I heared their Con call they looked exicted and slightly over-confidant. From tachnica target looks like 5000. IF you’re tracking this stock can you add your input. If youre not tracking this, Can you confimed my chat analysis.
VST Tillers completed and crossed a rounding bottom pattern above 3450 on daily charts. At the time of breakout it went up to a swing high of 3790 and is now retracing. Stock price consolidated between 3000-3200 for a few trading sessions before the latest breakout. Range of rounding bottom is from 2200 to 3450 which provides a distance of 1250 from bottom of pattern. Adding that to breakout level of 3450 provides target of 4700. Usually these are rough back of the envelope calculations and actual targets may vary from these levels. On longer term charts too it posted all time highs and is consolidating now. I do not track it fundamentally so not much idea, but any stock that clears all time highs bears watching closely.
Hi Hitesh,
I understand you don’t try to time the market &are always fully invested.
I agree entirely that timing the market is futile & have missed a few rallies in the past.
My post is only for educational purposes since I happened to read William J o’Neil’s “How to Make Money in Stocks”. & co-incidentally observed a few things from his Section on the Market direction, which seem to be aligning with the current market.
Observations with respect to the books are as follows- Market Direction (downtrend)
Distribution- Focus on 4 to 5 indices (daily price/volume action) that cover most of the market. However, if the observations are true to even 1 index, should be considered good enough evidence to take action.
Things to observe-
i. On one of the days in the uptrend, volume for the market as whole will increase from the day before, but the index itself will show stalling action (a significantly smaller price increase for the day compared with the prior day’s much larger price increase). Heavy volume without a further price increase. The average does not have to close down, however, in most cases, it will.
ii. The market comes into distribution when it is advancing. That is why very few people recognize it|
iii. Normal liquidation near the market peak will usually occur on three to six specific days over a period of four or five weeks.
iv. More accurately the distribution days of four days over two to three weeks are enough. However, this can be up to 6 weeks if the market attempts to rally back.
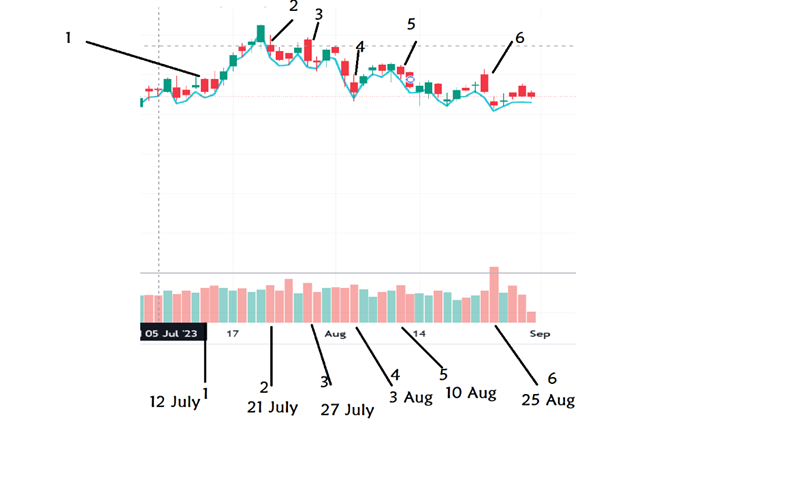
Currently, I see all of this holds true. (Picture below)
Observations-
1st Distribution day can be seen on 12th July, during the market advance, followed by 2nd, 3rd & 4th, within three weeks. Which should be enough to make the conclusion.
However 5th and 6th distribution is also visible further.
Rally Attempts after initial decline.
There can be feeble rally attempts. Currently, we can see for many days the market has been opening positively however over the end of the day, it either makes negligible gains or trends marginally negative.
Other Clues as per the book-
Leading stocks (e.g. Britannia, HUL) have stalled & are trading below their 10-year PE, while shady companies like (e.g. Suzlon/India Bulls Housing/Moreoen Labs) are making spectacular gains.
Recent buys in one’s PF are not moving much in either direction.
Personal observations on Indices disparity (not from the book)
Small Cap/Mid Cap indices are trending higher, irrespective of their larger peers like Nifty50/Nifty Bank. We understand from the Mutual Fund industry there is euphoria in small and Mid-caps currently. I personally see people churning completely from other caps to small caps MFs because of the spectacular gains they can see.
Thanks for a very insightful post full of relevant observations. It’s a thought provoking post.
The issue I see with observing only the Nifty/Sensex is that it is dominated by stocks like HDFC Bank, ICICI bank, Reliance, Infy, TCS, Hind Unilever etc. These are the very ones that are under pressure since many trading sessions.
From the volume bars of dates pointed out , I can see abnormally high volumes only on 25th July. Rest of the days marked seem more or less similar with a little variation here and there.
We have had a strong rally from March 23 lows of 16888 to July highs of 19991 , a rally of nearly 3000 points on Nifty and since then we have been in a corrective phase. Here if you see, we have been in a correction since 5 weeks and have not lost even 5% from the index highs. That fact broadly indicates that we are in a routine time correction kind of phase, where the index pauses to catch its breath. The nifty has been holding above its 10 WEMA and well above its 30 WEMA. Retracement wise, we have been broadly managing to hold on to the 23.6% retracement level to the entire previous rally.
And all this while, there has been strong strength in broader markets. On one thing I agree, that a lot of junk stocks have started flying and have rallied in recent past too, but that’s to be expected in a bull market.
So while there can be some observations which might fit in with William O Neil’s theory, the overall picture seems to be okay till now. Though I would like to keep an eye on possible negative markers of major correction if visible.
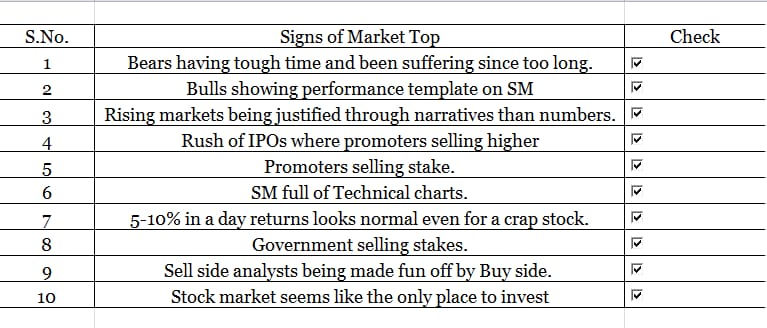
I sort of agree with @sandesh1893 purely from the observations’ point of view. I have a template and most of the things in the current environment fit in the template. Most of these held true even at the beginning of the 2018 bear market in small and Midcaps.
Nifty closed positive for the week with a bullish candle as shown in the charts. This was observed after 5 weeks of bearish candlesticks. Broadly speaking, 19200 seems to be acting as support as of now.
This level assumes significance because it is close to
23.6% retracement level to previous rally.
10 WEMA.
Weekly gap up (19201.70-19234.40) seen between weekly candle ending 30 June 2023 to 7 July.
Lows for last 3 weeks.
If we see the weekly candle for week ending 25 th August, there is a big upper wick with high at 19585, which remains the level to watch out for going into next few weeks.
So important levels for us to watch out for going ahead are 19200 on downside and 19600 on upside. Markets have a mind of their own, so they may go above or below these levels, or might consolidate for a few weeks between these levels. My expectations are to see the markets go up gradually and once the overhead resistance is overcome, resume uptrend. ( One of the reasons is the double bottom breakout which got confirmed on Nifty weekly chart on break above 18880)
Also marked on the chart can be seen the expanding triangle like structure that existed between Sep 2021 to August 2022, a period of 11 months which left everyone clueless as to the direction of the overall markets. This was followed by a double bottom formation (marked within blue horizontal lines) at 16800 which got confirmed once the intervening peak at 18880 was crossed. Potential target if this double bottom pattern plays out is 20800 range.
As mentioned many times before, PSU stocks have shown tremendous resilience during weak markets in the past and now have started showing strong upmoves. Last week it was the turn of BHEL to do its bit.
@Shakti_Srivastava I have expressed my views on selling strategy before on this and technical analysis thread . Selling is a difficult art and I am still in the process of learning and hence I do not have any definite views to offer. Whatever I have felt about the subject, I have expressed earlier, nothing more to add.
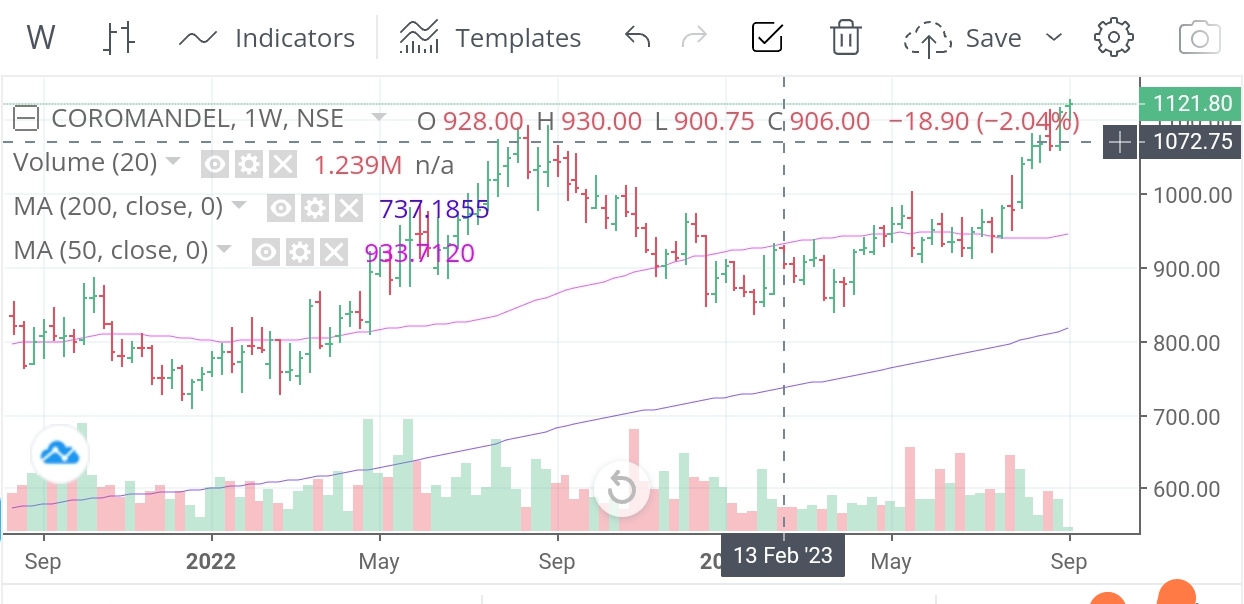
Fundamentally stock growth was lagging sales and profit growth as I believe it was not In a favoured sector of late. If this qualify for a pattern what would be the pattern target? Will it be the height of the cup from the base to the top ?
Thank you for all the education and guidance.
Coromandel intl chart is more of a rounding bottom breakout. There is no handle that is associated with a cup and handle pattern. But overall chart structure is bullish.
@Mayank14 Within the EMS sector, I track and own only HBL Power and remain bullish on it. If you want to study it, you can go through the thread on VP and company’s latest annual report which is published recently. Stock price has run up a lot in the last 3 months so valuations would appear expensive. But that is usually the case with favoured stocks in sector in fancy.
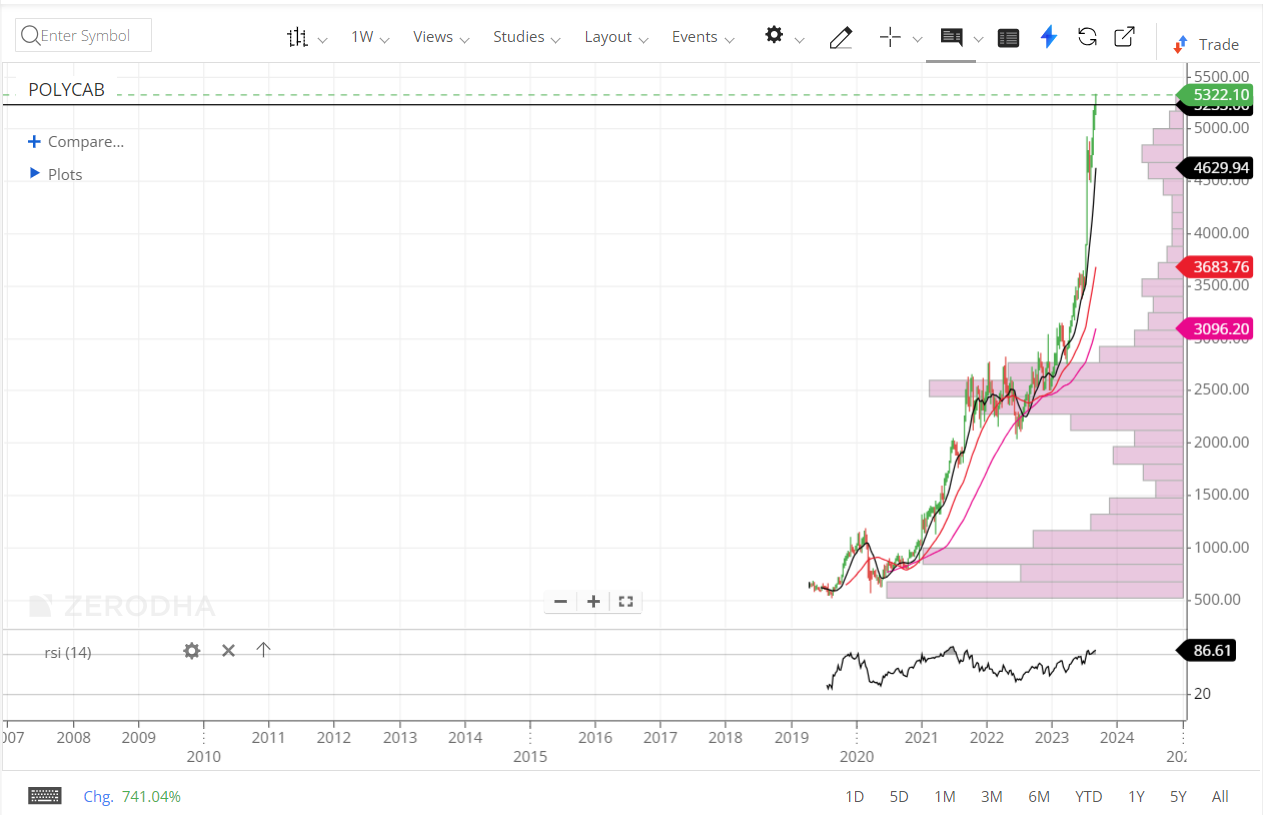
My question is on RSI. How long can an RSI remain overbought historically? The point in this case is Polycab which continues to remain in the overbought zone since July (above 80, currently 86 weekly). The Company’s mcap is just 6% short of the Havells.
Hitesh bhai a question on current market scenario. There has been a good run up in small and midcap. We may see correction at some point of time. My question to you is
How should one look at buying when market starts to correct. Should one look at strong stocks from ones watchlist or wait for matket to give indication as generally post the fall a new sector or theme emerges.
Sir… textile sector stocks showing reversal on charts…but news flow around is very bad about textile sector…
Stock specific Sportking India Ltd looks good on charts…
I’m confused what to rely on?
RSI can remain at elevated levels for long periods of time… Many a times when a stock reaches extreme overbought levels on RSI, it can do either of two things… First is go into sideways mode, consolidating within a range without giving up too much. Other is correct . When company in question is experiencing strong tailwinds and markets are convinced about the same, The former happens.