Hitesh portfolio

Thank you so much hitesh Bhai for sharing your thoughts on the framework that works for you.

Would like to know how you deal with fall in prices of the stocks after you buy. Since you bet heavily where your conviction lies, i believe major part of your capital may have gotten blocked in that stock. So what’s the exit strategy. Do you add more when price falls because you have conviction there based on fundamentals or think of exiting with a traders mindset or do nothing.

1 Like

Hello Hitesh sir,

Hope you are in good health. Before my query, again a big thank you for being so selfless in sharing knowledge. Would love to be amongst the first to be your student in case you formally provide coaching in future :slight_smile:

My question is regarding Poly Medicure -

  • March quarter has recorded highest sales ever though the OPM is 22% which seems good too. After reading concall and thread forum, the management aims to achieve 30% margins in next 2-3 years.
  • Valuations were peak at ~1200 in May’21 have now fallen to ~760 levels and PE is below 1 year median PE (source - Screener)
  • What I know is medical equipments can be good proxy play to both diagnostics and hospital industry as I don’t have to think about unorganized sector these 2 industries have.

Would like to know your views on scope of growth in this sector given you are a medical practitioner and valuation comfort in Polymed now?

6 Likes

Hello hitesh bhai,

Are your tracking paradeep phospate and devyani intl?

1 Like

@ram1984

In the stocks that occupy your top allocations, it is imperative that you know a lot about the business and more than most people. So I have to understand the business by reading the annual reports, going through the presentations, concalls etc… Plus I regularly read the relevant thread on VP and if I find that it would be enlightening to get the view of someone active on the thread, or someone who started the thread, I try to connect with that person. That helps in better understanding of the business.

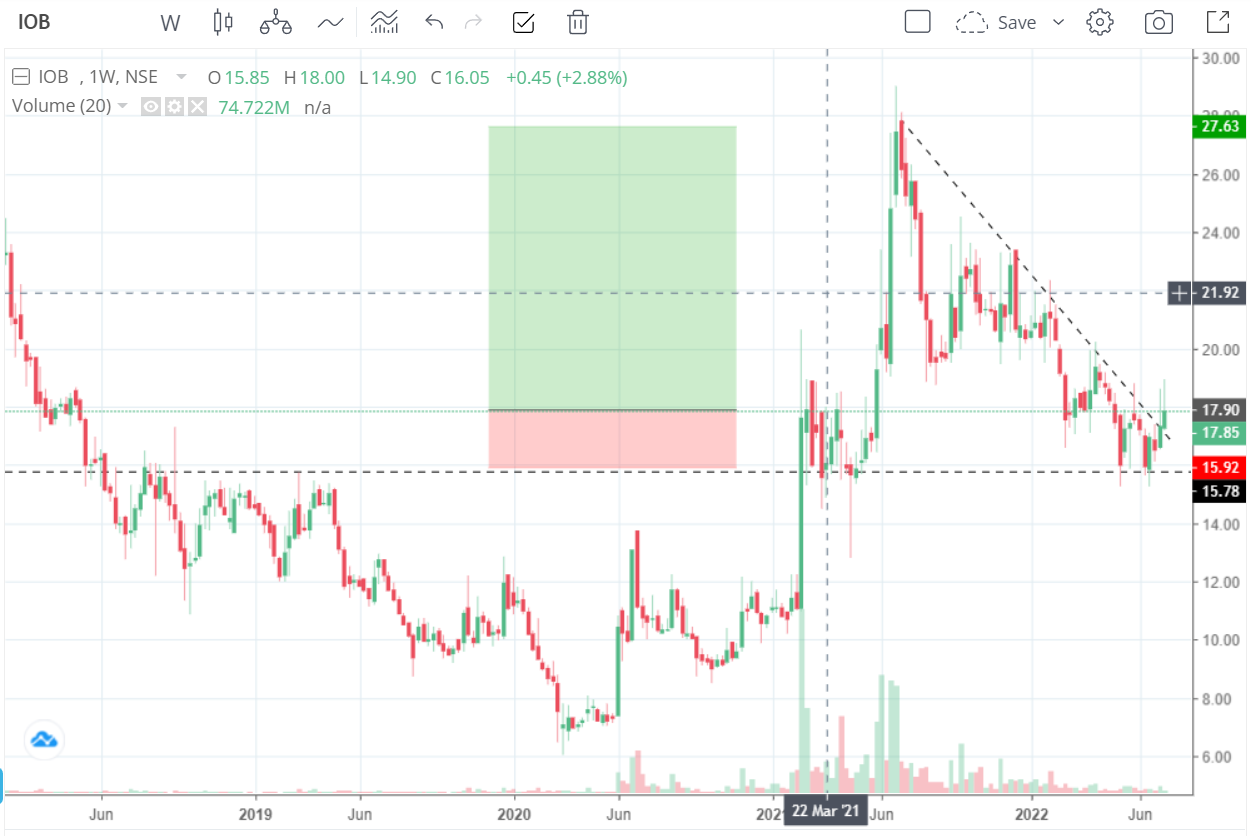
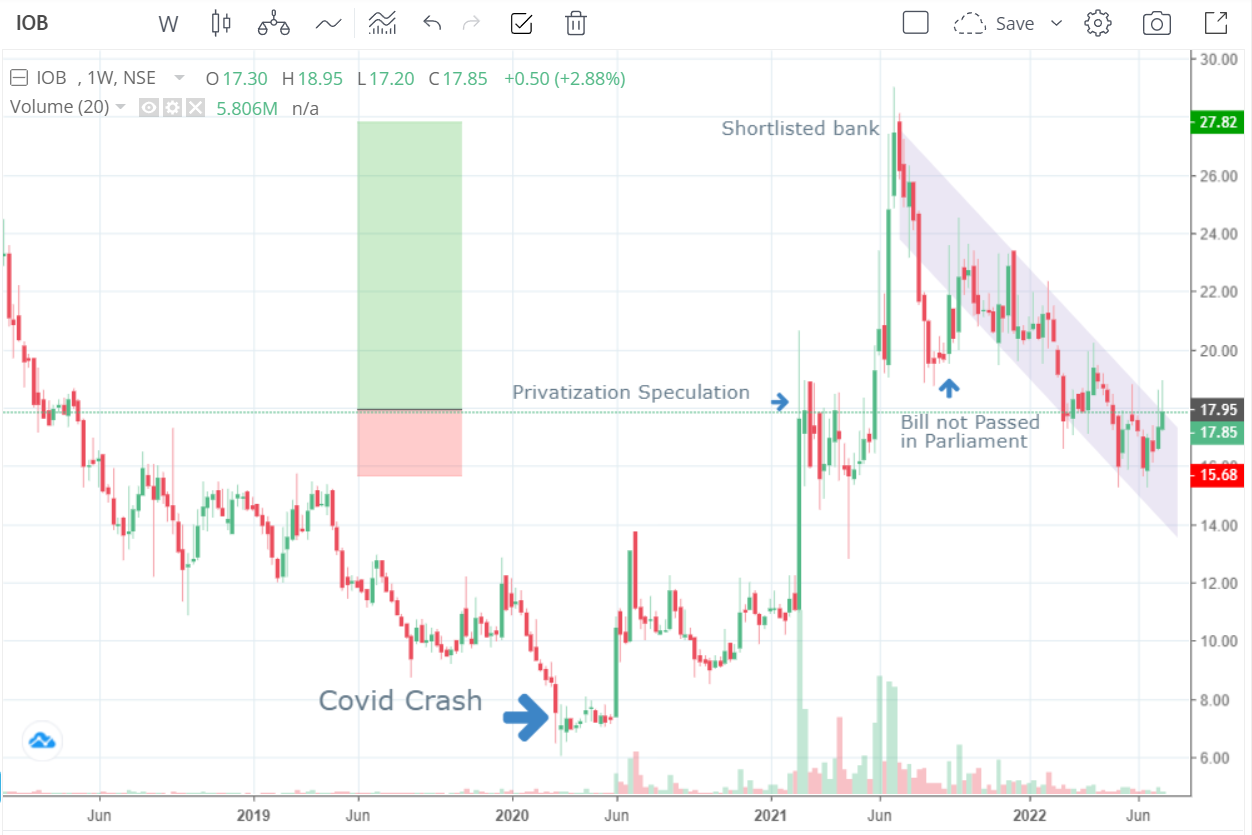
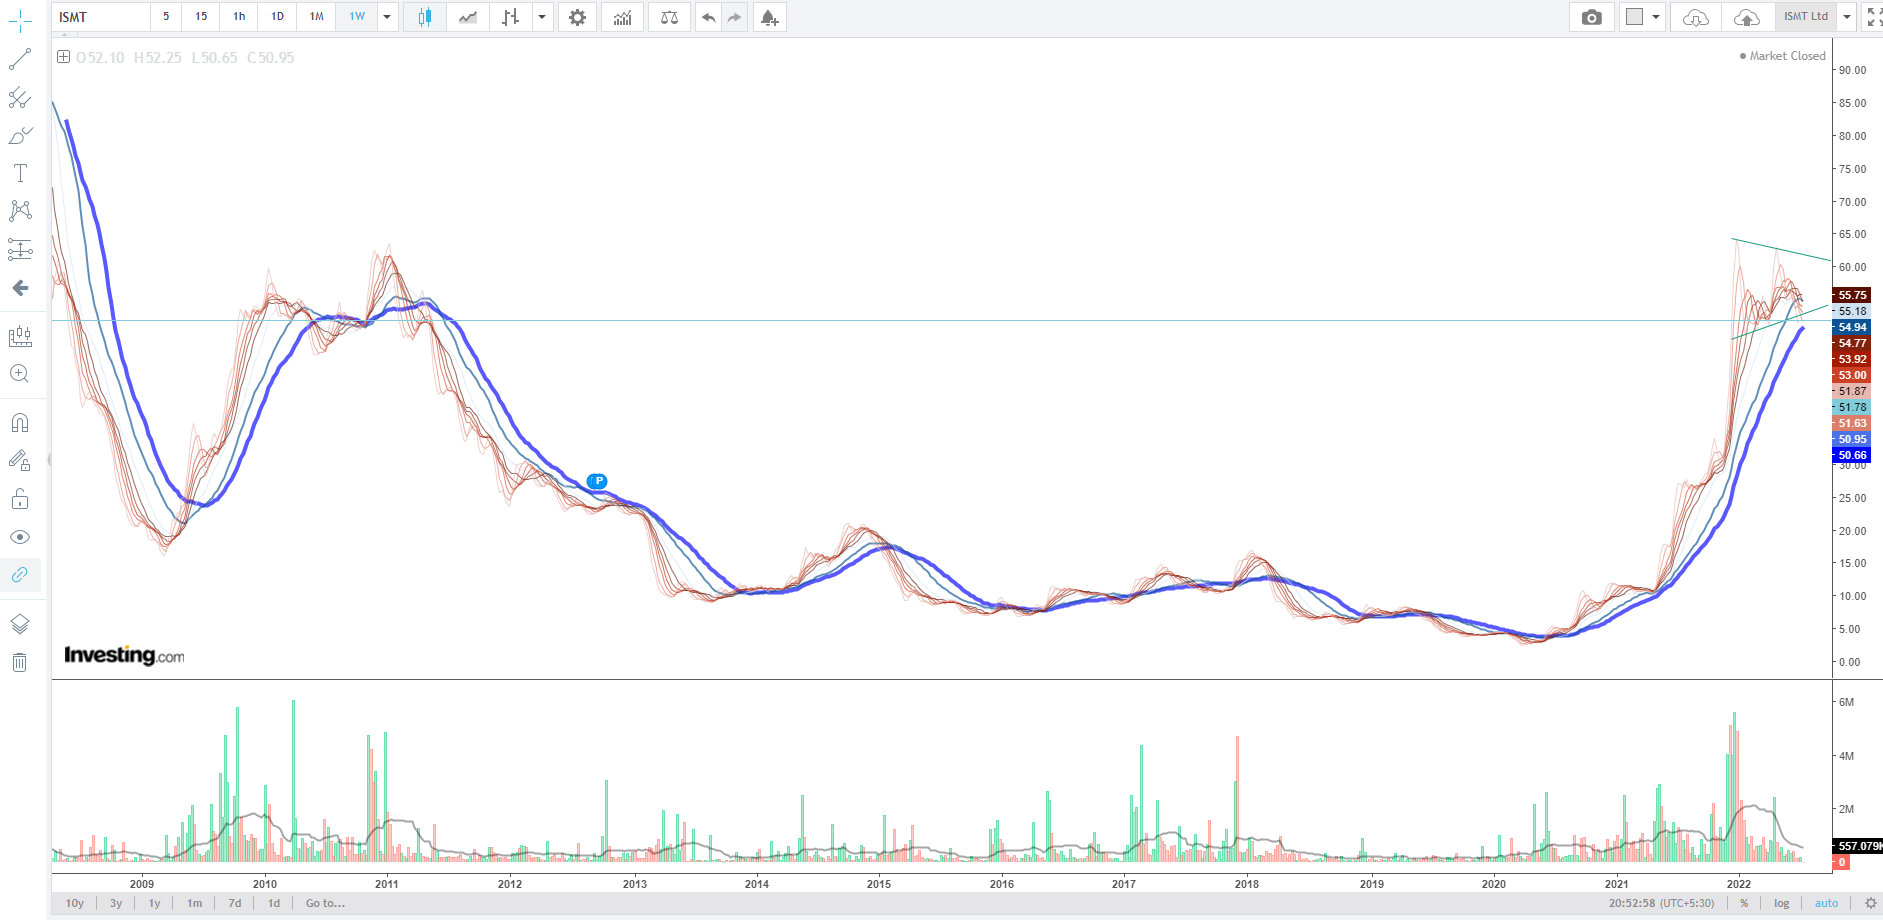
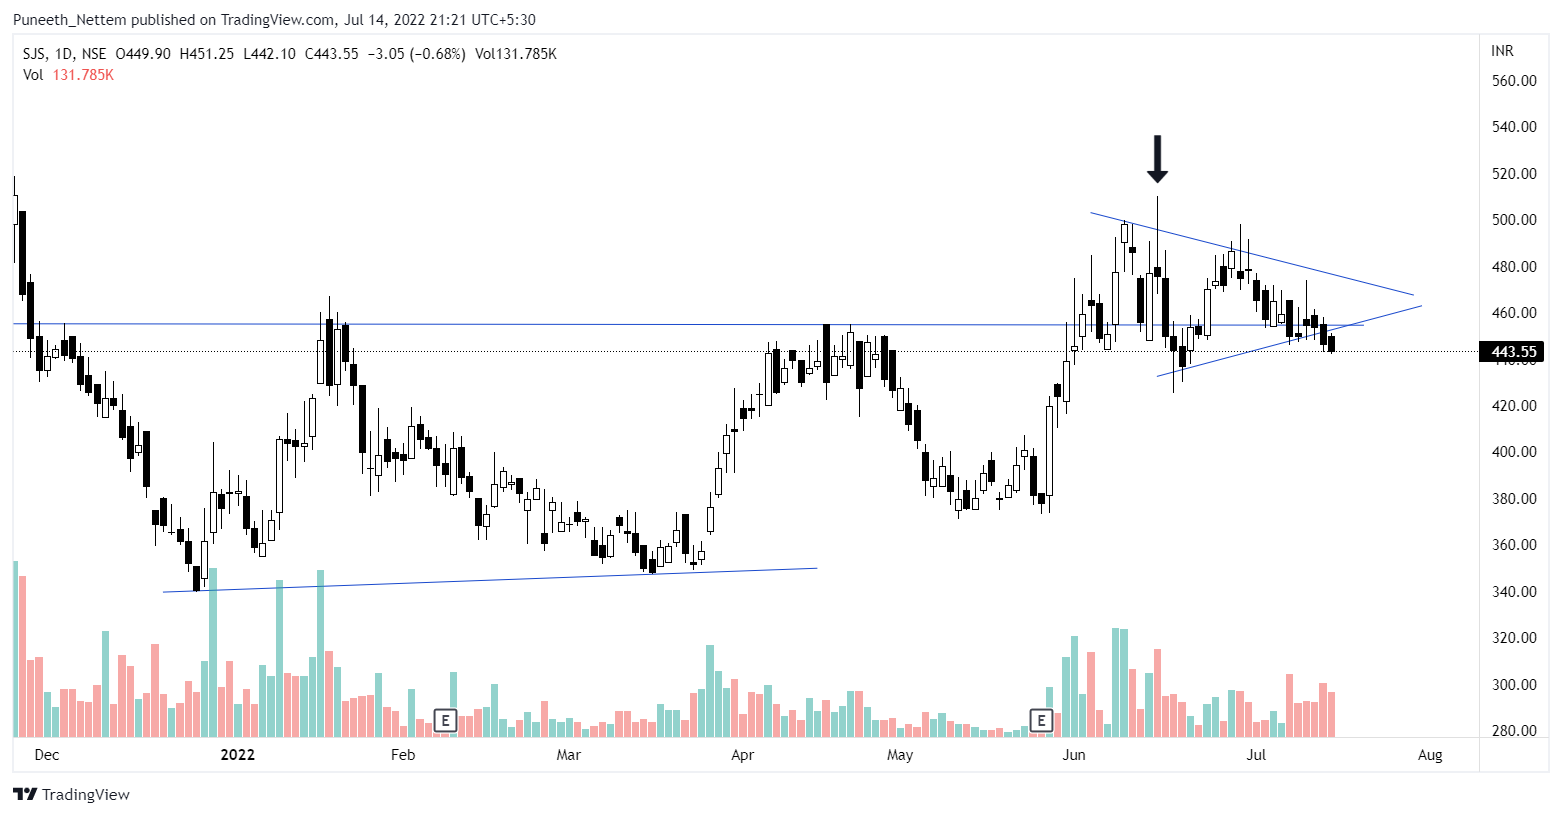
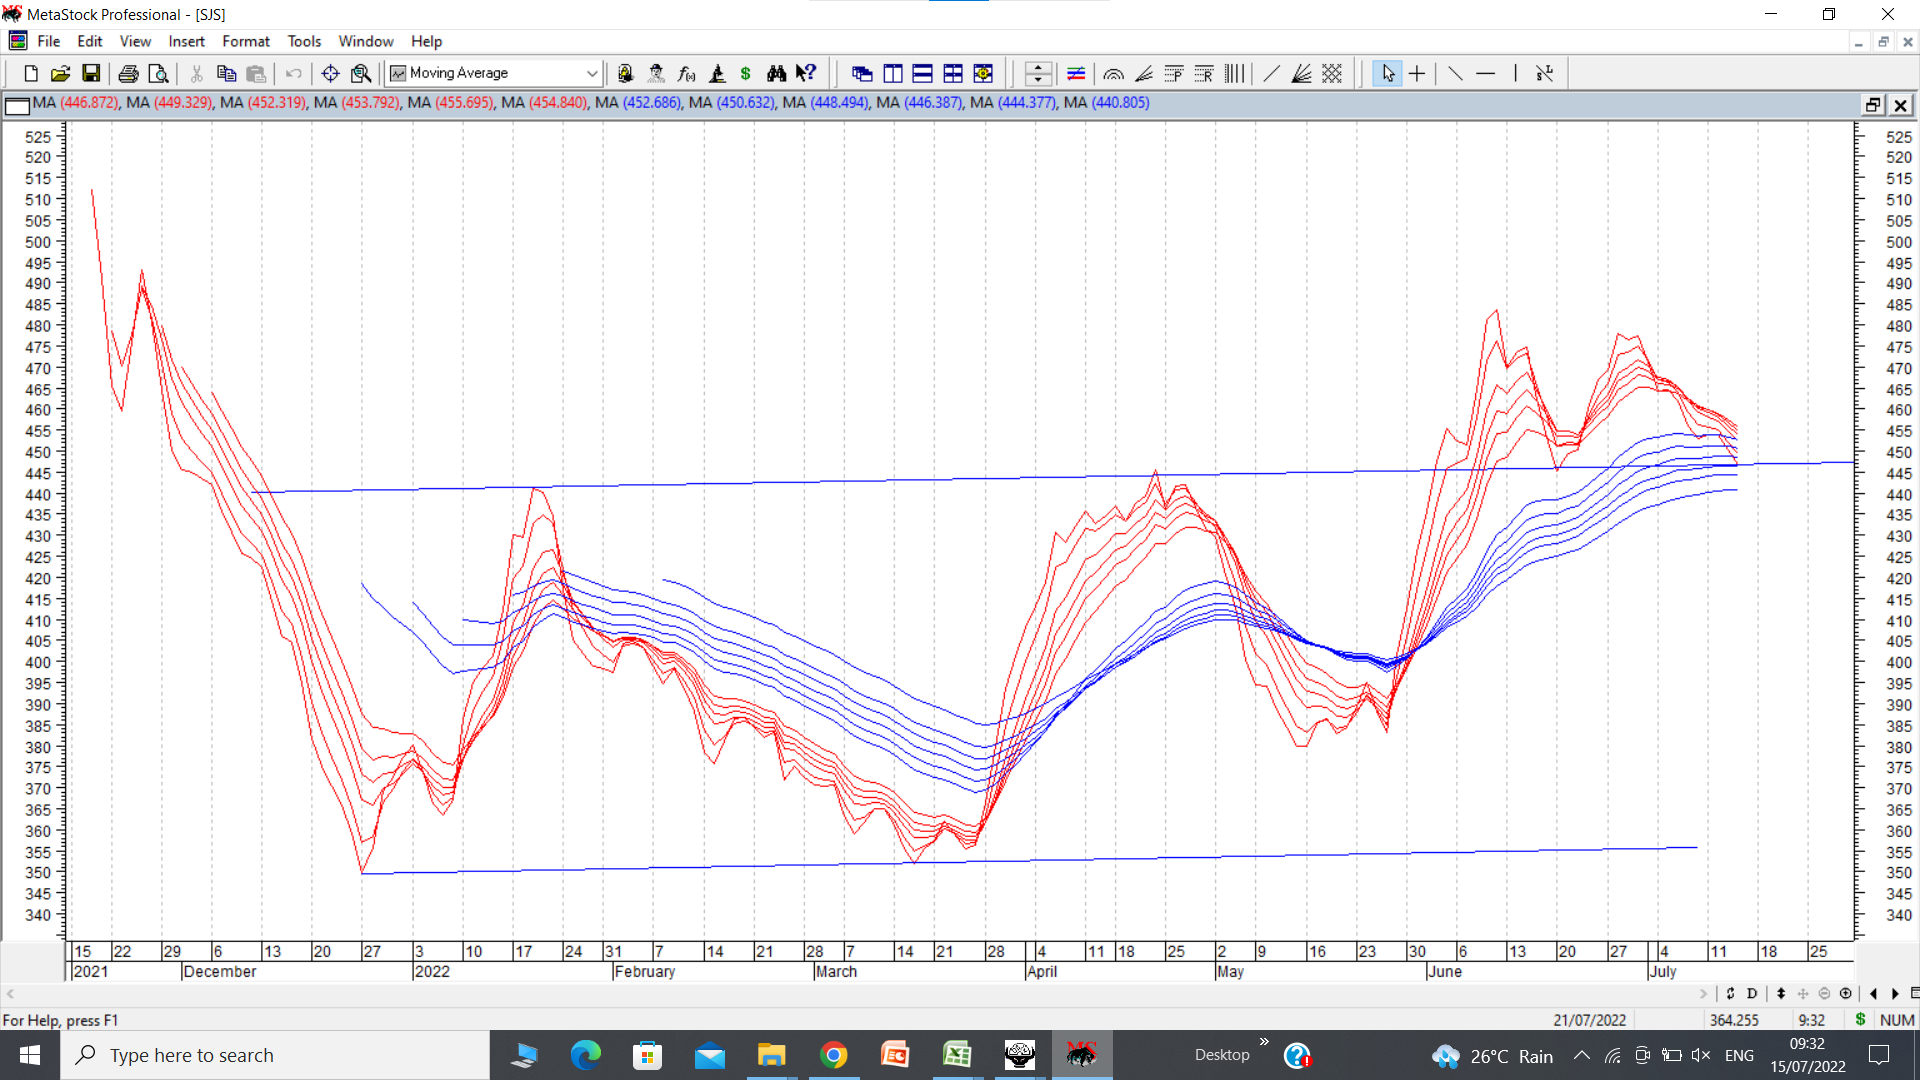
Besides this, there are of course my charts to fall back on, where often the story is often clearly written. That helps in building additional conviction.

And still if the stock price falls, the first question I ask myself is whether the fall is due to general market weakness or is it company specific reason.

Just to give you recent examples, I had positions in Vimta Labs and RBL Bank. Now Vimta labs also corrected from peak of around 450 to slightly below 300 albeit temporarily. But having listened to the concall and interacting with other friends who tracked the company, I could easily figure out that this was a routine correction in stock price which was more due to the meltdown in overall markets and not too much company specific. So I held on to my position. In case of RBL bank, it gapped down below 100, (well below its all time lows) on news of appointment of new CEO. Now that for me was a company specific news even though overall markets were not so strong. So for me the decision to exit was quite easy. I booked my losses and tried to move on to my next best idea and worked hard on it.

If you have a concentrated portfolio, you cannot afford to make too many mistakes and if a mistake is made, it has to be realised and corrected immediately. Otherwise we can get hurt badly.

@hitusohi1 I don’t track either paradeep phosphate or devyani intl.

@paramjeetsingh I do not track Polymedicure.

@Jasmeet Both auto axles and kkcl are strong charts and seem to be showing good strength in current markets.

@Mandar_Chatufale I don’t track any of the companies you named, viz. divis, pi inds, astral, apl apollo.

28 Likes

Hi Hitesh sir, what are your views on IIFL, M&M Finance and Usha Martin?

Regarding RBL, does the change in CEO warrant an exit? Or was it based on the technical analysis? At what point would you consider re-entering RBL?

1 Like

I have a follow up on this reply. I will ask my question on IOB initially from a technical stand point with some background on the investment.
My family pf consists of a very well diversified pf of stocks. Most concentrated position is in IOB at close to 13%. Father is an extremely patient investor with huge capacity to suffer. He has been holding few like TCS / Reliance since IPO with occasional sale and keeps remaining shares using Free Share concept and lets time do its magic. By nature very passive, extremely patient and Averse to Selling.

I wanted your Technical views based on the two charts. I am in my mid-twenties and have my own pf since 2021. Charts show two tales based on my limited understanding of Technicals.
Most of them were acquired through my mother’s Esops at ₹11.90. Went through ₹7.50 and was not agile enough to sell at ₹29.

  1. Weekly Bearish Descending Triangle: Green/Red (Target / SL)
  2. Weekly Bullish Flag Pattern:

Asking fundamental questions as a reply to this query

1 Like

Fundamental questions on IOB
Rating Rationale (crisil.com)

  • GOI going to raise capital of ₹1000+200 Cr(ESOP) in FY23. Dilution of 6%
    image

  • GoI has infused ₹ 22,974 crore in IOB over the past four fiscals,.

iob q4 results: Indian Overseas Bank clocks 58% rise in Q4 net profit at Rs 552 crore - The Economic Times (indiatimes.com)

Concluding thoughts:

  • It appears worst phase is over. Still concerned as this not an Investment I would have made

  • Can’t decide if raising capital is good or bad

  • Rough Valuation : BV * P/B * Earnings growth
    Case a: 12 * 1.5 * 1.20 = ₹ 21.6
    Case b: 12 * 1.8 * 1.25 = ₹ 27

Please share your valuable insights. Kindly excuse the use of links as vp thread has been quiet for this one

@pcygnii

I own and track Usha Martin and it seems to be well placed to capitalise on the infra growth wave. Results till date have been as expected. I don’t track IIFL or MM finance.

RBL bank logic of exiting already explained. When a stock breaks down below its all time lows especially with a big gap down, with huge volumes, if you believe in technicals (and even if you have rudimentary knowledge of technicals) you shoot first and ask questions later. That’s what I did on the day it broke below 100. Re considering it would take a lot. Maybe if it gives a couple of quarters of decent numbers and stock price reflects strength, then it could be considered. Maybe market logic is that a new CEO has been appointed to clean the filth if at all there is any in the bank. Or some other reason. But with the kind of price drubbing it received, I did not want to look out for reasons to sell. Price movement was enough of an indication for me to sell. And markets are flush with good options, so I don’t feel the need to saddle myself with non performers.

9 Likes

@keerthan_bs

I could not get your question completely. But I guess you want my view on technicals of IOB. First of all, while looking at flag, we do not want the flag to be too droopy. The flag part of the chart indicates largely a mild correction, or a sideways correction which is more of a time correction than a price correction. So its usually preferable if the bottom of the flag does not correct more than 50% of entire rise of the flag pole. I see a lot of guys making up flags to suit their technical thesis. Idea should be to learn only a few of these patterns, but the learning should be absolutely complete and infallible.

It takes only a few days to read up on flag, cup and handle, inverted head and shoulders etc. Even a google search would provide the most important characteristics of the pattern.

IOB may some day make a comeback, especially when PSU bank pack moves big time. But I feel this is not a company worth holding for long term. There are plenty of better options for longer term holding.

Fundamentally I don’t even feel like looking at IOB. I don’t feel its worth the effort. Someone wanting to own or already owning might want to go for it and do detailed analysis, but I would prefer to give it a miss.

9 Likes

Hitesh Bhai -

What’s your view on the below chart from ISMT Ltd.?
After forming a rounding bottom over a period of 12 Yrs., it’s been coiling in a Sym. triangular formation from the last ~7 months. As of now it’s resting just above 40WMA. While coiling in this formation, volumes are relatively quiet when price touches the lower trendline as compared to the action towards the upper trend line. The chart got me interested to read further, notes shared below for your reference. Fundamentally, I think market has already built in base case scenario [6~7% NPM].

Background:
ISMT Ltd. is India’s largest integrated specialist seamless tube producer. ISMT is one of the world’s most diverse makers of specialist seamless tubes, with tubes ranging in diameter from 6mm to 273 mm. The company has an alloy steel making facility in India that manufactures a wide range of alloy steels with diameters ranging from 20mm to 225 mm.
During the year KFIL (Kirloskar Ferrous Industries Ltd.) acquired around 51% stake in Indian Seamless Metal Tube (ISMT) Ltd thereby taking the management control of the same. Financing from this acquisition strengthened the B/S of ISMT Ltd. Borrowings of 2000 Cr. is knocked off. Net worth became positive, which qualified it to start participating in PSU tenders. Per my math, existing spare capacity could bring in additional revenue of ~2000 Cr on the existing revenue of 2000 Cr.

Top line boosting factors:

  • Eligibility to participate in PSU tenders
  • Opportunity to mine customer base of Kirloskar group
  • Anti-dumping duties for imports from China for tubes is in force by Indian government till 2026

Cost Optimization Factors:

  • Synergies with in group companies- KFIL’s Pig Iron output as input for ISMT.
  • Cost reduction on power bill, which is at 17% of overall revenue.
  • COGS cost shall trend downwards with the financial backing and business acumen of the parent company.

Key Risk:
Lack of pricing power - Sales/Ton seems to be market driven as they are unable to increase sales price at the rate of COGS CAGR.

Hidden Risk:
Upkeep of Plant and Machinery in the last few years may have been below par seeing the amount of capex and expenses on ‘Repairs Maintenance to Plant and Machinery’ done in the last 6 Yrs.

Above all -
I sense that Kirloskar group seems to be a decent owner operator. Their listed businesses (beside this 4 of them) have been always in black, for the history available on screener, and reward shareholders with decent and consistent dividends.

3 Likes

Sir from where did you study about Usha Martin. The company doesn’t do any concall and I find it difficult to research companies not having concalls. Can you please tell some sources for research?

1 Like

Hello @hitesh2710 sir!

What are your views on GPIL? Although it is a commodity stock, it seems that its profits are going to be consistent and there is a high probability of rerating.

1 Like

@valorem Hiteshji has been kindly and selflessly responding to every query here, the least we can do is search the thread before asking more of his time. If I recall he has talked earlier on gpil, kindly look for it and see if it answers your query. My 2 cents.

Regards
Yogi

@MarketYogi I did read his response earlier. However, back then the GPIL thread was not very active and thesis was not fully recognised. I just wanted to get his current opinion.

1 Like

@Souresh_Pal

For Usha Martin, you can read the relevant thread on VP, company presentations for quarterly results. And annual reports for last few years. For more information, you can call directly to someone at the company and try your luck.

@valorem I don’t track GPIL. But I do not know how you can be so confident that its profits will be consistent. Just look at the OPM of last 10 quarters, which range from 15% to 52%. The govt with one stroke of an order can screw these kind of businesses by playing around with all kinds of duties, levying different kind of taxes and so on. The reason that we own it or track it is not enough to expect consistency or re rating in these kind of companies. It might/might not be undervalued at current levels, but that’s only an anomaly investors need to exploit. As far as I know, these kind of cyclicals have a definite sell price, especially when we see peak margins and peak sales. When that happens, the PE becomes extremely cheap and that’s the time to sell cyclicals. ( At least that’s the conventional wisdom Peter Lynch advocates. )

25 Likes

Hi @hitesh2710 bhai, Could you please share your thoughts on technicals for Healthcare Global, NH and ASTEC Life. All of these have been resilient in current market meltdown. Pls share fundamental view as well if you track them. Thanks in advance.

1 Like

Hi sir, it would be really helpful if you could give your views on some of my dividend income investments. The motive behind investing in them is to provide stability and some passive income.
Here is my post- Ishaan's Longterm Portfolio - #39 by ishu

[@hitesh2710] Hitesh Bhai - Any opinion on the information requested at ‘Hitesh portfolio - #6517 by hitesh2710’?

Good evening hitesh sir,
I wanted to ask about sjs as the techno funda bet.


Charts do look rather weak(or so is my interpretation, please correct me if I’m wrong), do you expect it to take support at these levels like the resistance at previous two times before a bounce back?

Trying to understand the thought process as I’m still in the process of learning technicals and integrating it into my framework.

disc - not invested but tracking as a techno bet.

@GrowingAlpha

SJS broke out of a double bottom formation. Now some stocks start moving up right after breaking out from a double bottom, others take some time and consolidation before moving. There can be retest of double bottom breakout levels and stock may go slightly below that breakout level and stay there for a few days. Plus market mood also plays a part.

Currently it seems SJS is taking a pause and is in some sort of triangular consolidation. I see broadly sideways movement, no weakness, no strength. Need to see where it breaks out once this consolidation completes.

As investors we need to have patience. Stocks move only when they want to move and not because we own it.

Putting up a daily GMMA chart to show a clear picture. This type of chart eliminates whipsaws.

13 Likes