Hitesh (@hitesh2710 ) Bhai - In the recent past conf. calls, Colgate leadership was vocal about their focus on figuring out the strategy for it’s Personal Care portfolio (Palmolive brand).
On the fundamental front, qualitative indicators - increased Palmolive products display in the storefronts and hired New MD & CEO with background in Beauty & Personal Care (Ex-HLL director) - signal the execution of the above strategy.
On the technical front, market participants seem to be optimistic off-late. The monthly/weekly chart indicates a solid support @ 1400+ on the downside. On the upside, I do not see any immediate resistance as long as the overall market sentiments remain neutral/bullish.
Schaeffler has now reported three consecutuve quarters of good growth numbers. And as is usually expected after these kind of results, the stock price has had a good run up. I haven’t heard the concall but from whatever I could gather, the company remains on strong footing for growth in medium to long term.
I would consider this company as a buy on dips portfolio stock. Currently I have no positions.
@ISHWAR I do not have a background in finance, so I don’t think I am qualified to answer detailed questions on tax or balance sheet.
Laurus has reported decent q4 fy 22 numbers and from guys who follow the company I get the feedback that it shoud do well going ahead. I myself have yet to listen to concall of latest quarter. So on the financial and fundamental front it seems to have partially regained investor confidence.
On charts, it fell down from a head and shoulders pattern by breaking below 590 and went down to 450. Since then it spent a good amount of time between 450-550 and few days before the results, went above 550 and has managed to maintain above that level despite weak market sentiments. Going ahead, I think 540-555 should be a good support band to look out for and if someone is convinced about the fundamental merits, then accumulation can be done between current levels of 580 and 550.
I have it in my watchlist but no position as of now.
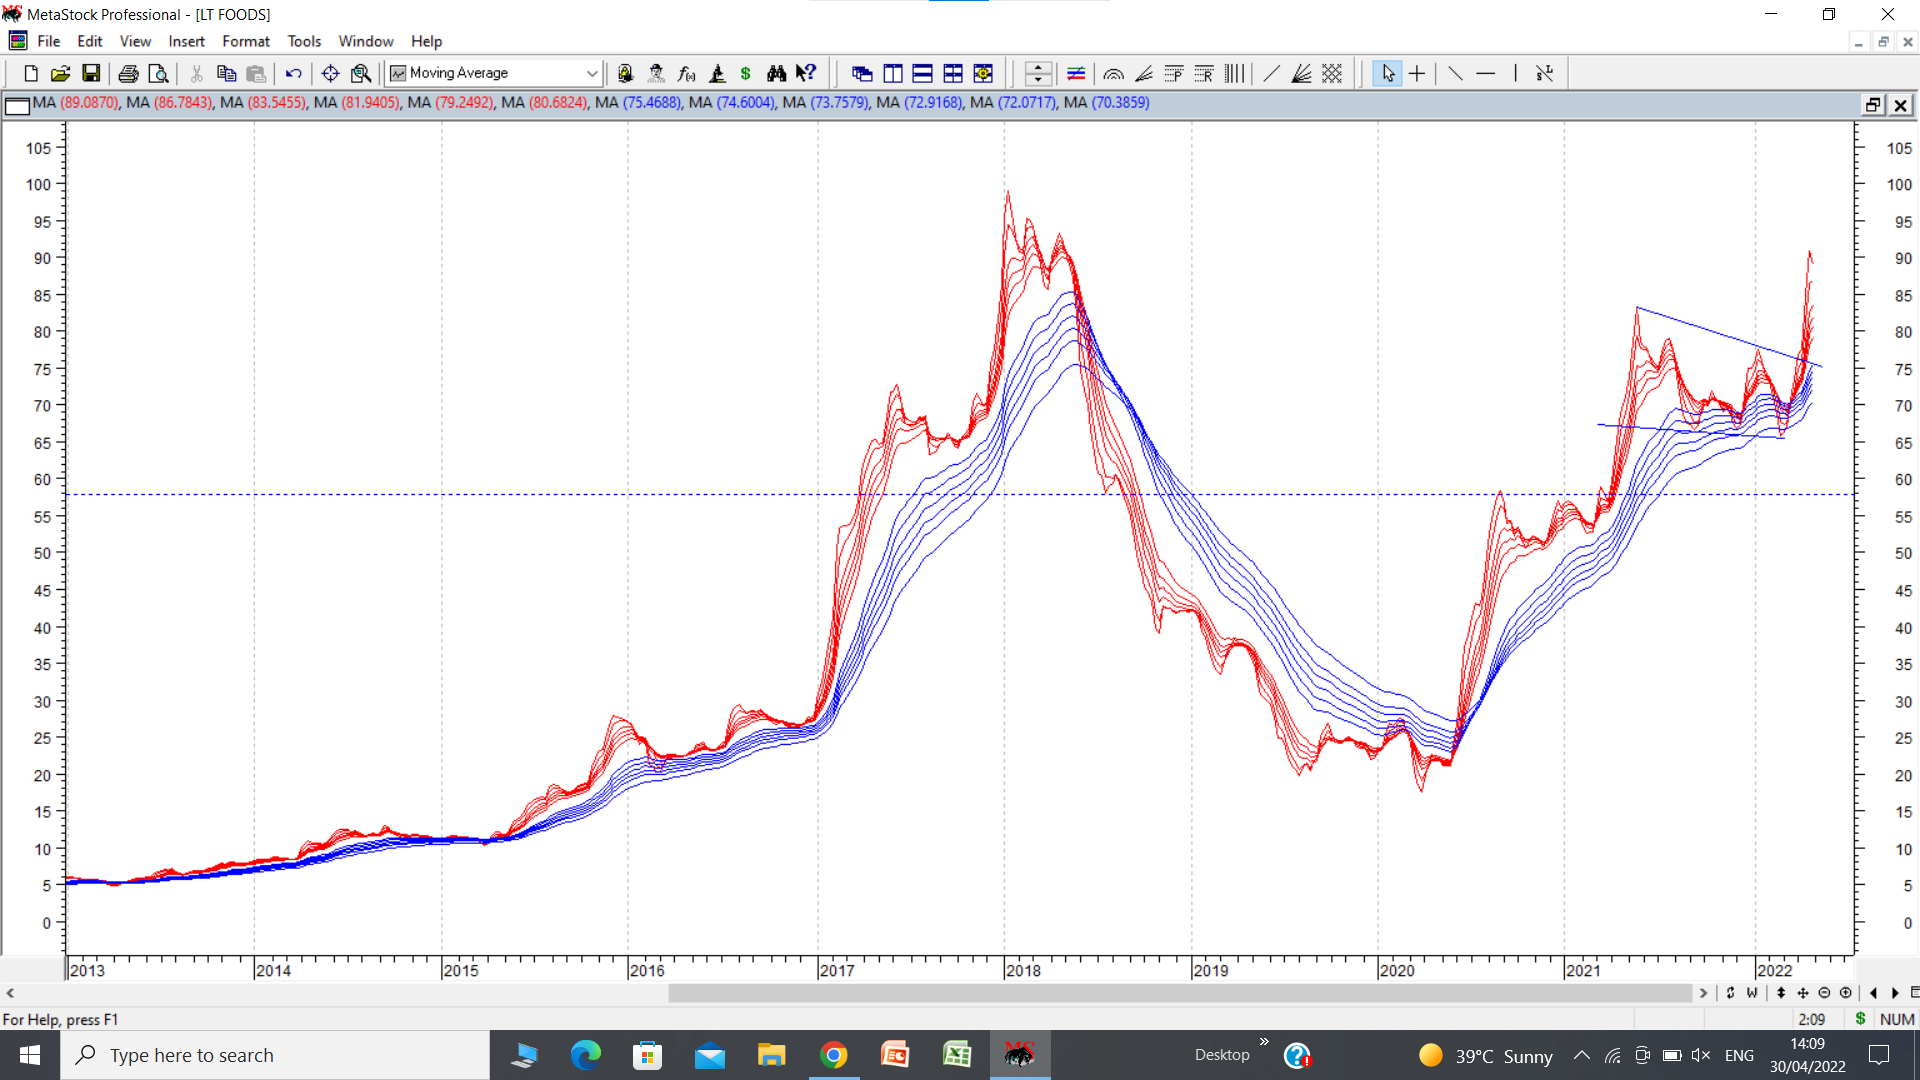
LT foods has a good chart atleast for the medium term. It broke above 58 from a cup and handle pattern and went up to a swing high of 90. Since then it went into a triangular consolidation and recently broke out from the consolidation. Going ahead pattern targets for the original cup and handle breakout above 58 are close to 100 and target for triangular breakout (flag/pennant type consolidation) are 105-110. All time high in 2018 was 110. ( I remember that price because I was able to sell some shares exactly at 110 in 2018 and had to sell remaining on way down till 100. ) Above 110, it can have an open sky to go up.
Certain companies like Colgate, Nestle, Hind lever are dream candidates for people who want to own coffee can portfolios and are satisfied with decent (not very high but 12-15% CAGR, and in good times 15-25%) compounding without worrying too much about market gyrations and disruption threats.
For someone who wants to play it even more smart, there are times when these stocks go below 200 dema, and these dips should be used as opportunities to load up. .
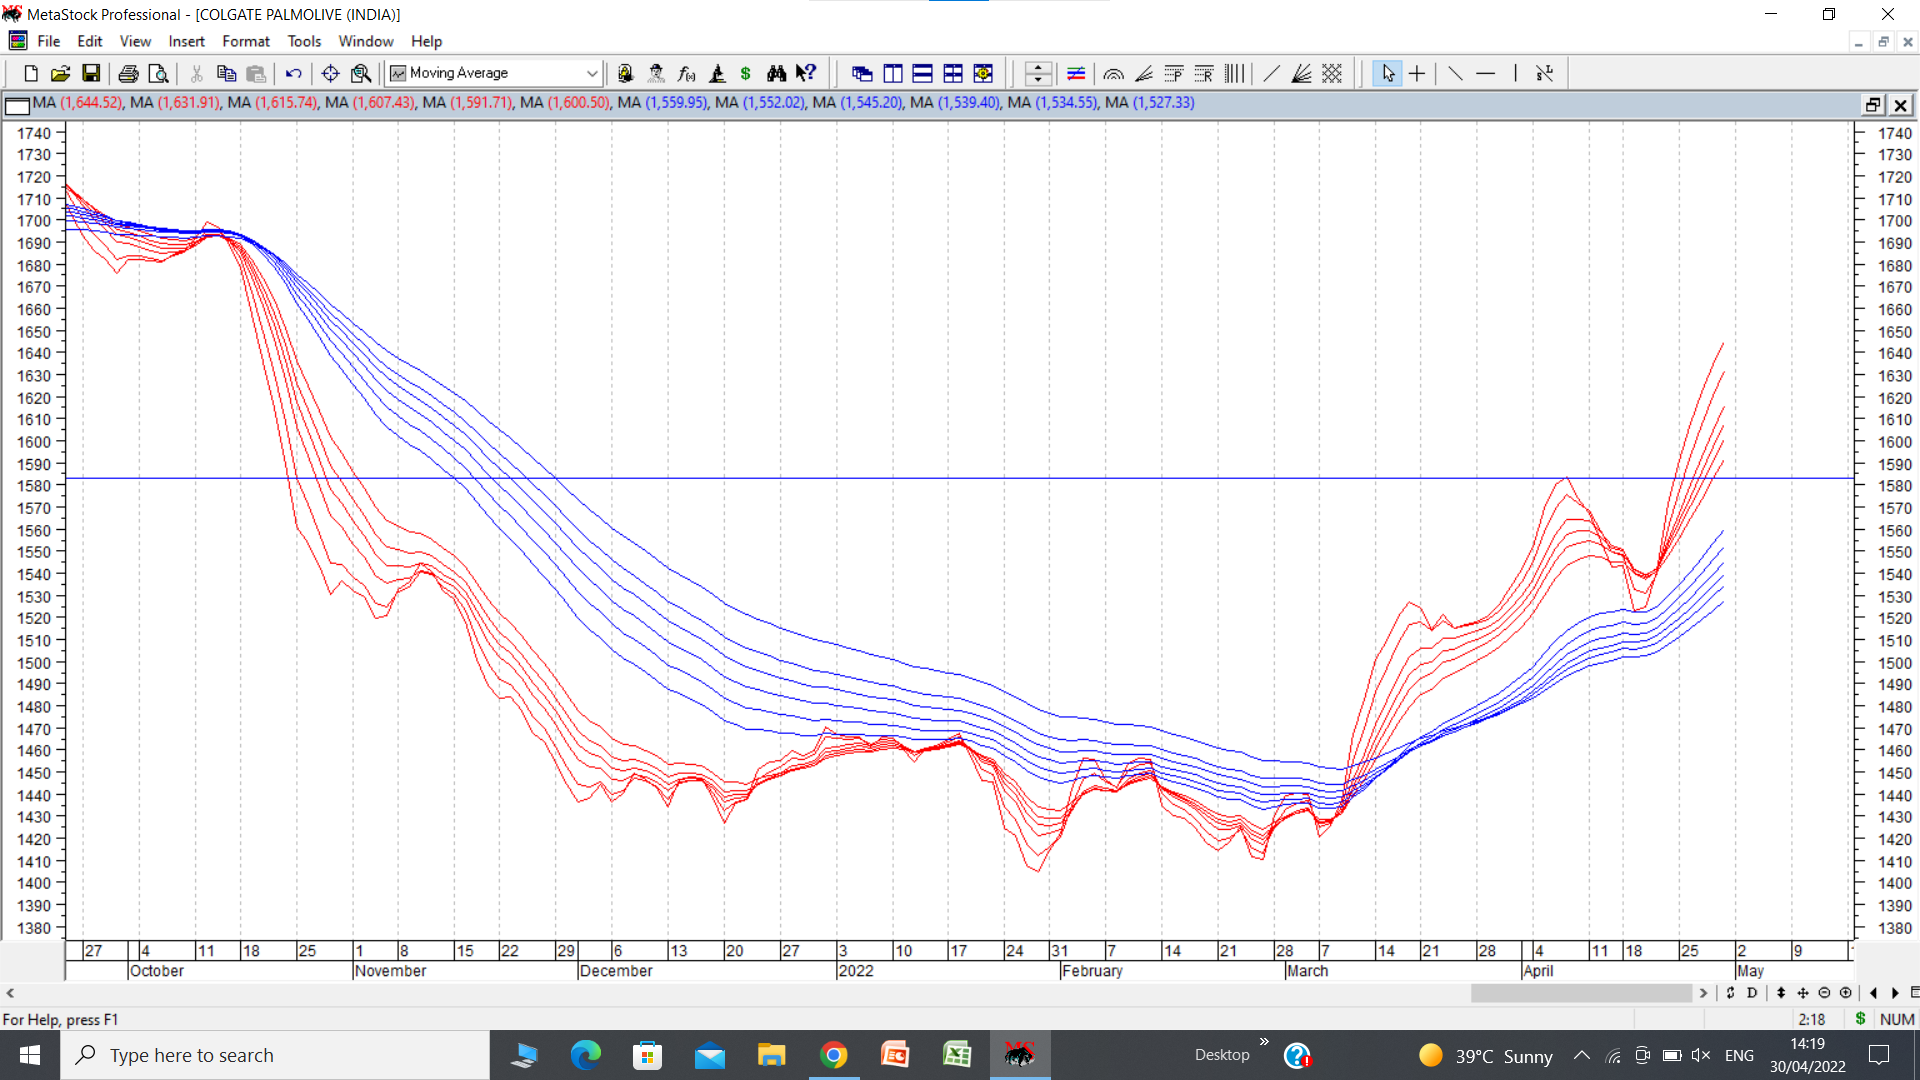
Colgate briefly went below 200 dema from Oct 2021 to April offering a good opportunity to build a decent position. Now it seems to have started gaining strength and has comfortably managed to stay above 200 dema which currently stands at 1530.
On daily charts it has broken out above a cup and handle pattern above 1580 and has a pattern target of 1760. The cup has a nice rounding bottom type of formation and the overall structure looks quite good for someone who wants to ride it for short term or buy for long term too.
Usha Martin topline growth has been quite good at 17% while operating profit has grown by only 6%.
The nos are decent with a significant improvement in balance sheet. Business has over the last four quarters clearly demonstrated the resilience and independence from the steel cycle. The margins are lower but given the overall macro scenario like rising RM prices, Power and fuel costs, Logistics costs these are very healthy numbers. The EBITDA margins of 14% should improve as costs are passed on and product mix improves. The dividend payments have started and should get better as the company becomes more and more stable and confident.
I remain bullish on the company from a near to medium term perspective.
Firstly, thank you for this thread – I’ve learnt so much from the rich commentary you share here!
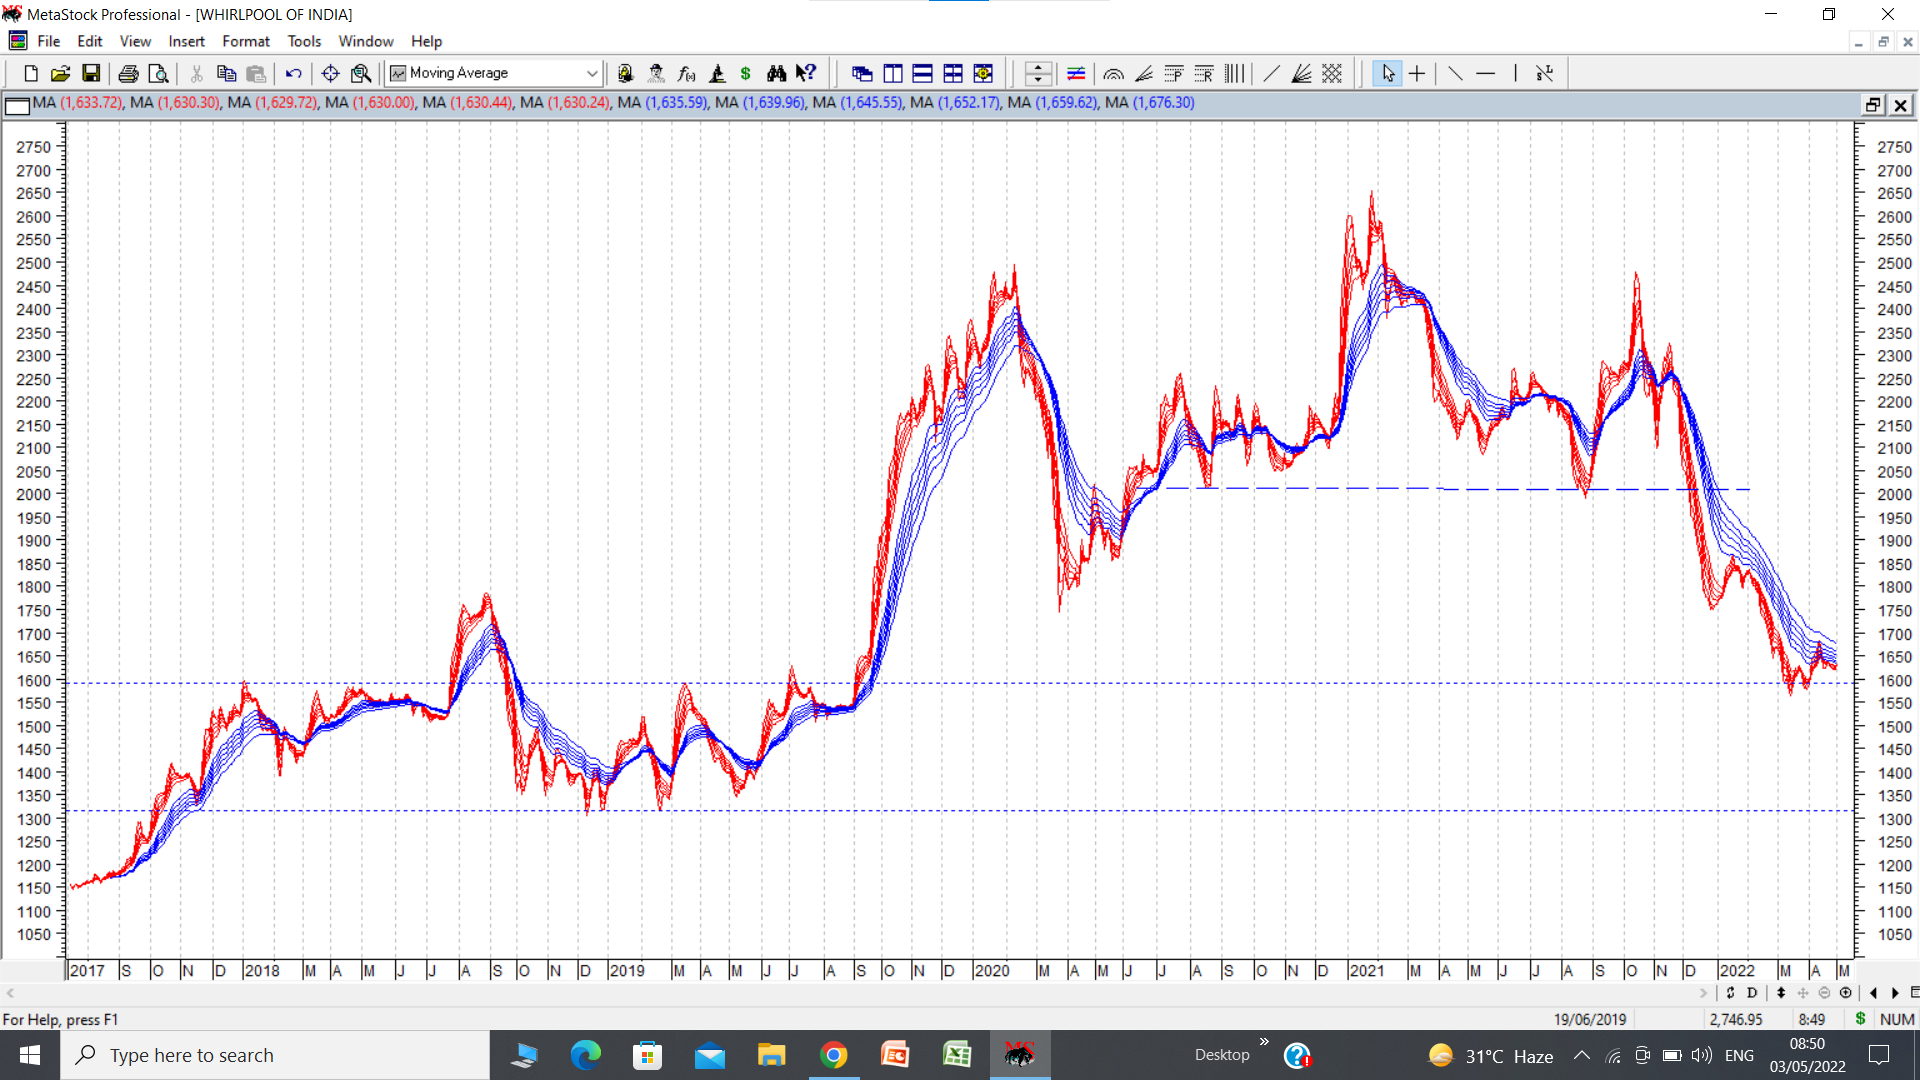
I was wondering if you have a view on Whirlpool of India: the stock has been battered badly in the last few months. Do you think all possible bad news is baked into the price or do you foresee it will breakdown further from these levels? Also, do you think if it’s a good time to get into Whirlpool or are the valuations still very expensive despite the sharp correction.
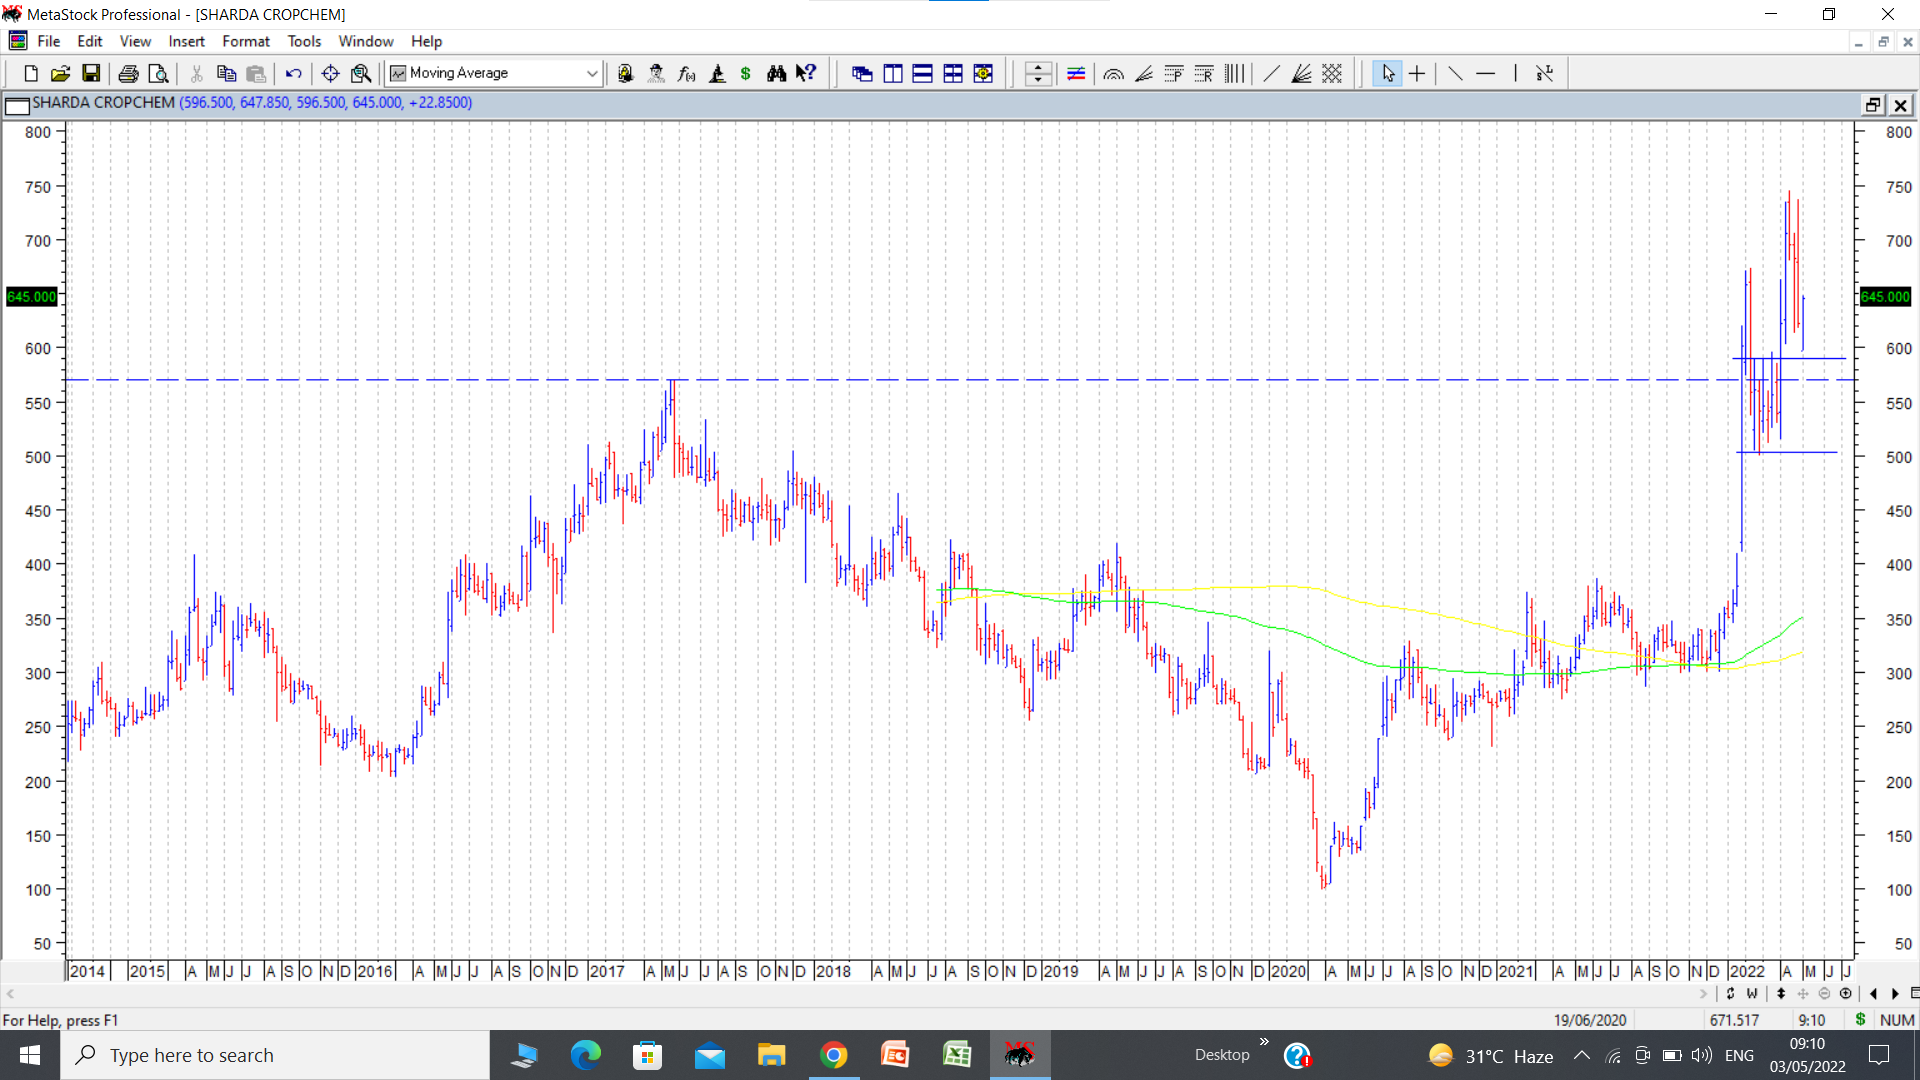
What is your opinion about charts of Sharda Cropchem?
The Company made a multi year breakout rising upto 650 in the first week of Feb. Then after the Ukraine war - the stock price fell back to Rs 540 along with the broader market.
Again the price went up to 705 in the first week of April and has now fallen back to 610 levels.
Fundamentally, the Company has posted excelled Q3 results and management has guided for a strong Q4 and ~15% volume growth in next few years as per recent TV interviews in last few months.
From my limited experience - I feel it is normal for small caps to fall a bit after such a large breakout and form a flag pattern to create a new base around that level. But here, there seems to be a see-saw movement and even the daily price movements of the stock are in the 2-3 %
Hiteshji
Can you pls give your view on solara active - today it is down 20 percent on a lower circuit. Despite consolidating at 700 levels for a few months it has collapsed again,
At some point, do you see any good level to re enter or does this remain on the avoid list due to corporate governance issues, poor quarterly numbers etc?
Hitesh Bhai (@hitesh2710) - Request your thoughts on the below Questions:
What’s your experience in applying technical analysis on the low float stocks such as Lux Inds and Bosch? // Curious to know a practitioner’s view point
Any heuristic to judge the timeline to achieve a pattern’s target price ? // Yet to see any discussion on this aspect in the books that I read on technical analysis.
What’s the key indicator that setup of a cup and handle pattern is nullified? // breaking of the handle’s trend line?
Whirlpool has been a rank underperformer ever since it made its high of 2787 in Jan 21. From this level, it went into a downtrend to post a low of 1532 in March 22.
On GMMA daily charts, we see a clear breakdown from a bearish head and shoulders pattern(marked in dotted line) below 2000, whose target are near 1350. An interesting observation related to previous zone of consolidation is that stock consolidated between 1300-1600 for a year during 2018-19 ( marked in dotted lines). I think for someone convinced about the story and company’s fundamentals can look at the above zone to see if the stock price finds support.
Fundamentally it has not had a great run in terms of consistency of results. While sales have been growing consistently though at a sedate rate, margins have been all over the place and hence net profit figures have never been consistent. The MNC parentage protects downside to some extent but there too if company fails to report consistent decent numbers, market participants tend to lose patience and shift to greener pastures.
Personally I think there are much better investing options out there in the market for someone willing to do basic research.
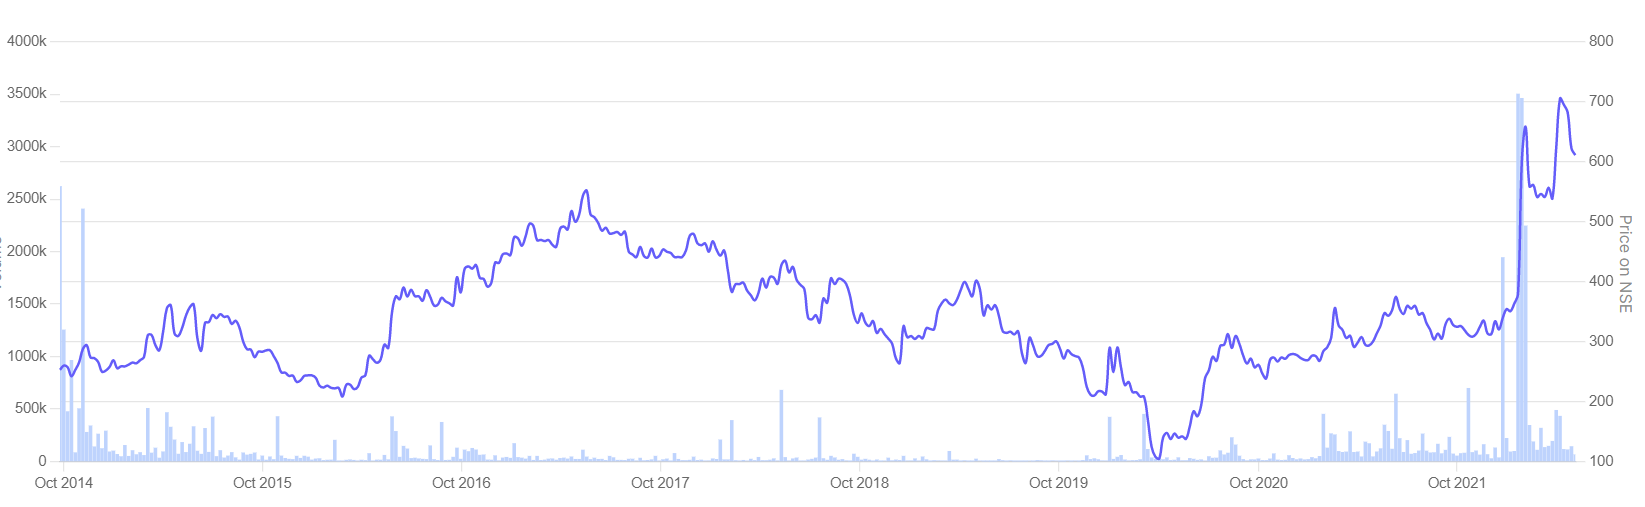
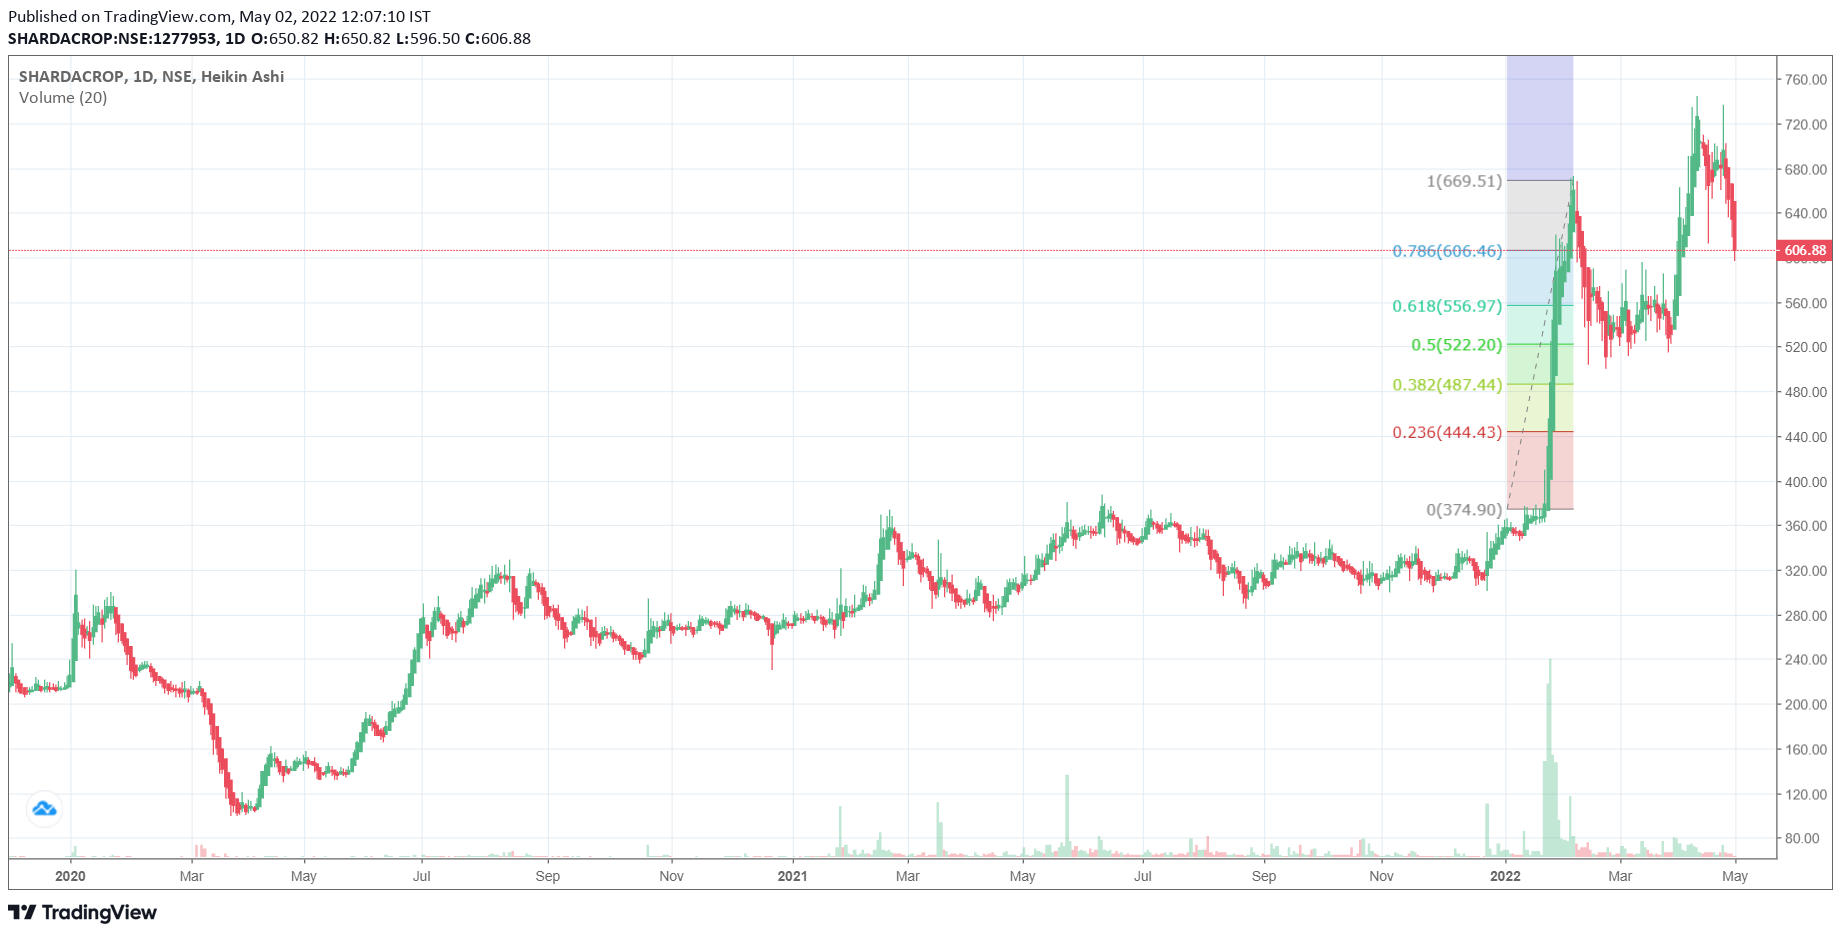
Sharda crop chart shows a breakout above previous all time high of 570 (posted in 2018, marked in dotted line) in Jan 22 and stock went on to post a new swing high of 673 in Feb 22. Post that it went into a corrective mode and spent nearly 7 weeks between 510-595 (shown enclosed in horizontal solid lines) before taking off to post a fresh all time high of 745 in April 22. Post that it has again gone into corrective mode and is trying to take support above the previous consolidation zone of 510-595.
In case of Sharda cropchem, promoters hold nearly 75% and retail public holds only 10.64% float. These kind of holding structures lead to see saw movements and hence those holding the stock need to be ready for wild swings within a range.
Fundamentally I think the company has been well discussed in a detailed thread, so I have nothing more to add.
Solara closed on Monday at 511. An important level for the stock to watch I feel is around 480-485 because that is the level that offered resistance between April 2019 to February 2020 before the stock took off in the API/bulk drug rally and went on to post a high of 1859. Its now back to test the breakout levels, and I do not know whether that support is going to hold or not but one can watch it all the same.
Again would like to reiterate that once a sector loses its fancy, its not a place to be. One has to look out for greener pastures. There can be the odd exceptions in the sector like divis, or laurus, but the odds of making big money are not there and base rate of finding winners in a sector that has lost fancy is poor.
Usually technical analysis works even in low float stocks, though there are often wild swings in prices and the pendulum can swing to extremes. If one is a pure technical analysis based investor, in these kind of stocks one has to learn to use manic rallies to book profits because when the tide turns, falls are equally swift.
Finding timeline for targets to be achieved in a particular pattern is a difficult art. I have found the timeline factor working in a pattern I sometimes post called the Wolfe Wave where from a triangular consolidation, there is a breakout and there is a target line. There are some experts who practice the technical analysis related to timeline prediciton, but I do not know much about it.
The one key indicator to nullify a cup and handle pattern is conclusive break below the bottom of handle. Many a times we can have two handles in a cup and handle pattern, So one has to be patient with these patterns.
Hitesh Bhai, at the outset many thanks. Your selfless effort to educate and guide is an inspiration and a model. I began learning TA one and a half year back. Its been a great journey. Amongst the indicators, I have taken in a big way to GMMA and have been paying attention to your GMMA charts. Wish to deepen my understanding of it through practice and reading. Kindly suggest readings on GMMA.