Laurus Labs you have been very clear about your exit. With ARV and API still under pressure and based on the relative little future tiggers thats are out over the past month, would you take it for a possible recovery? and for a possible exit cutting losses?
Yes @hitesh2710 bhai, you rightly said- PPP is public private partnership model. Was wondering if you had any opinion( positive or negative) about players with focus on PPP ( like Krsnaa at 65% revenue from PPP, though pushing now B2C and pvt hospitals segment more) being successful in wealth creation, be it diagnostic or any other industry - key assumption being Receivables etc in line with peers and no wrtite offs.
Thanks for your views on diagnostic sector, it is quite attractive given strong business model, runway, unorganized to organized theme, healthy return metrics, cashflows driven growth etc. Though very competitive space and consolidation playing out.( Dr Manchanda from lalpath has been vocal about it as well)
I think 65% of revenue from public private partnership is too much for a company in the diagnostic sector. If you think from a distance, if you are too much dependent on PPP, then you are at the whims of those in power. In a way the company is at risk of govt regulations. A few decisions against you can screw the whole business and I think that is one of the reasons Krssna is available cheap compared to peers.
Another question you always ask while evaluating a business is “How difficult/easy it is difficult to dislodge this business?” In case of Krsnna, the answer will be obvious.
My exit from Laurus was based on the fact that most of the positives were factored in the kind of valuations it enjoyed. At that price, any kind of negative surprise would have caused a lot of price damage.
Maximum money in an investment is made when impact of positive surprises are not factored into stock prices. When a company undergoes a change in perception from negative/indifference to neutral to positive, a lot of re rating happens and that’s when maximum money is made. We get the benefit of growth in business (which leads to rerating) as well as re rating due to change in perception/expectation. In case of Laurus this state of affairs was a couple of years back.
Technically the stock price attained its head and shoulders breakdown target of 450 (after breaking down from 580-590) and now has recovered and is close to previous breakdown levels of 580-90. Going ahead, we need to watch the support at levels of around 550.
As of now, I look at Laurus only from an academic perspective.
Dear Hitesh,
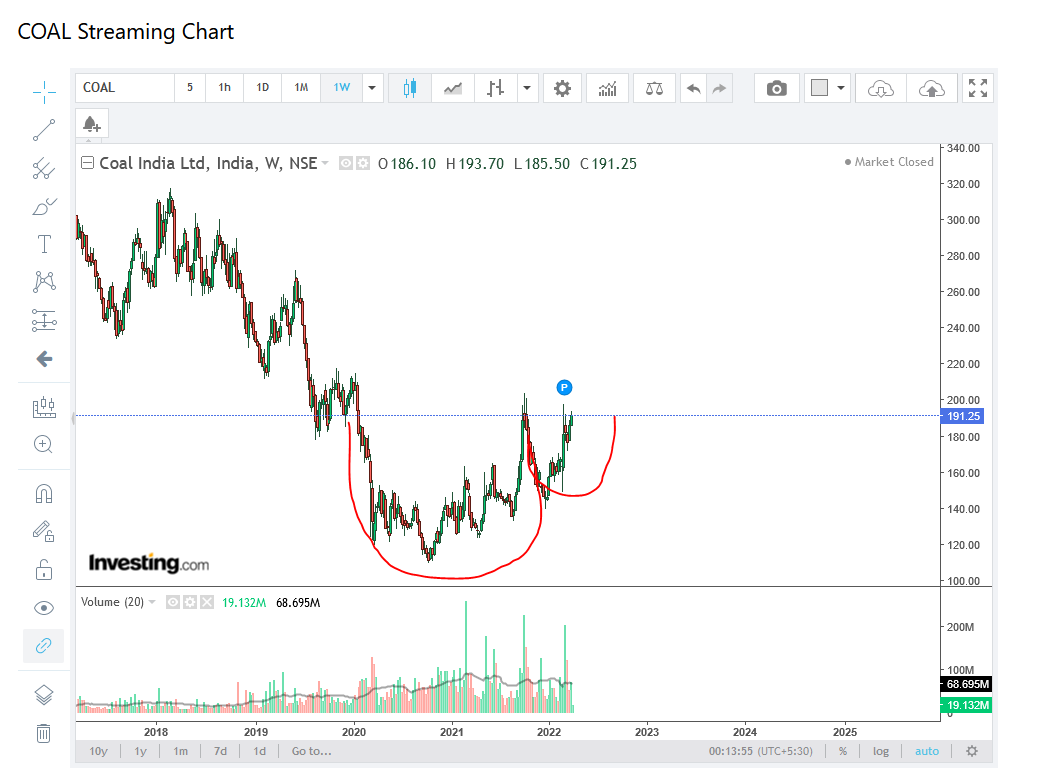
I am quite a novice about technical charts. I have a question. This is Coal India weekly chart. Does this qualify as as cup and handle pattern? with target of 270?
The chart you have put up has the contours of a cup and handle breakout. Its on weekly time frame. A better description for it would be a rounding bottom formation. In an ideal cup and handle pattern, we do not want the handle to be too deep. Best handles are saucer shaped rounding handles which are not too deep.
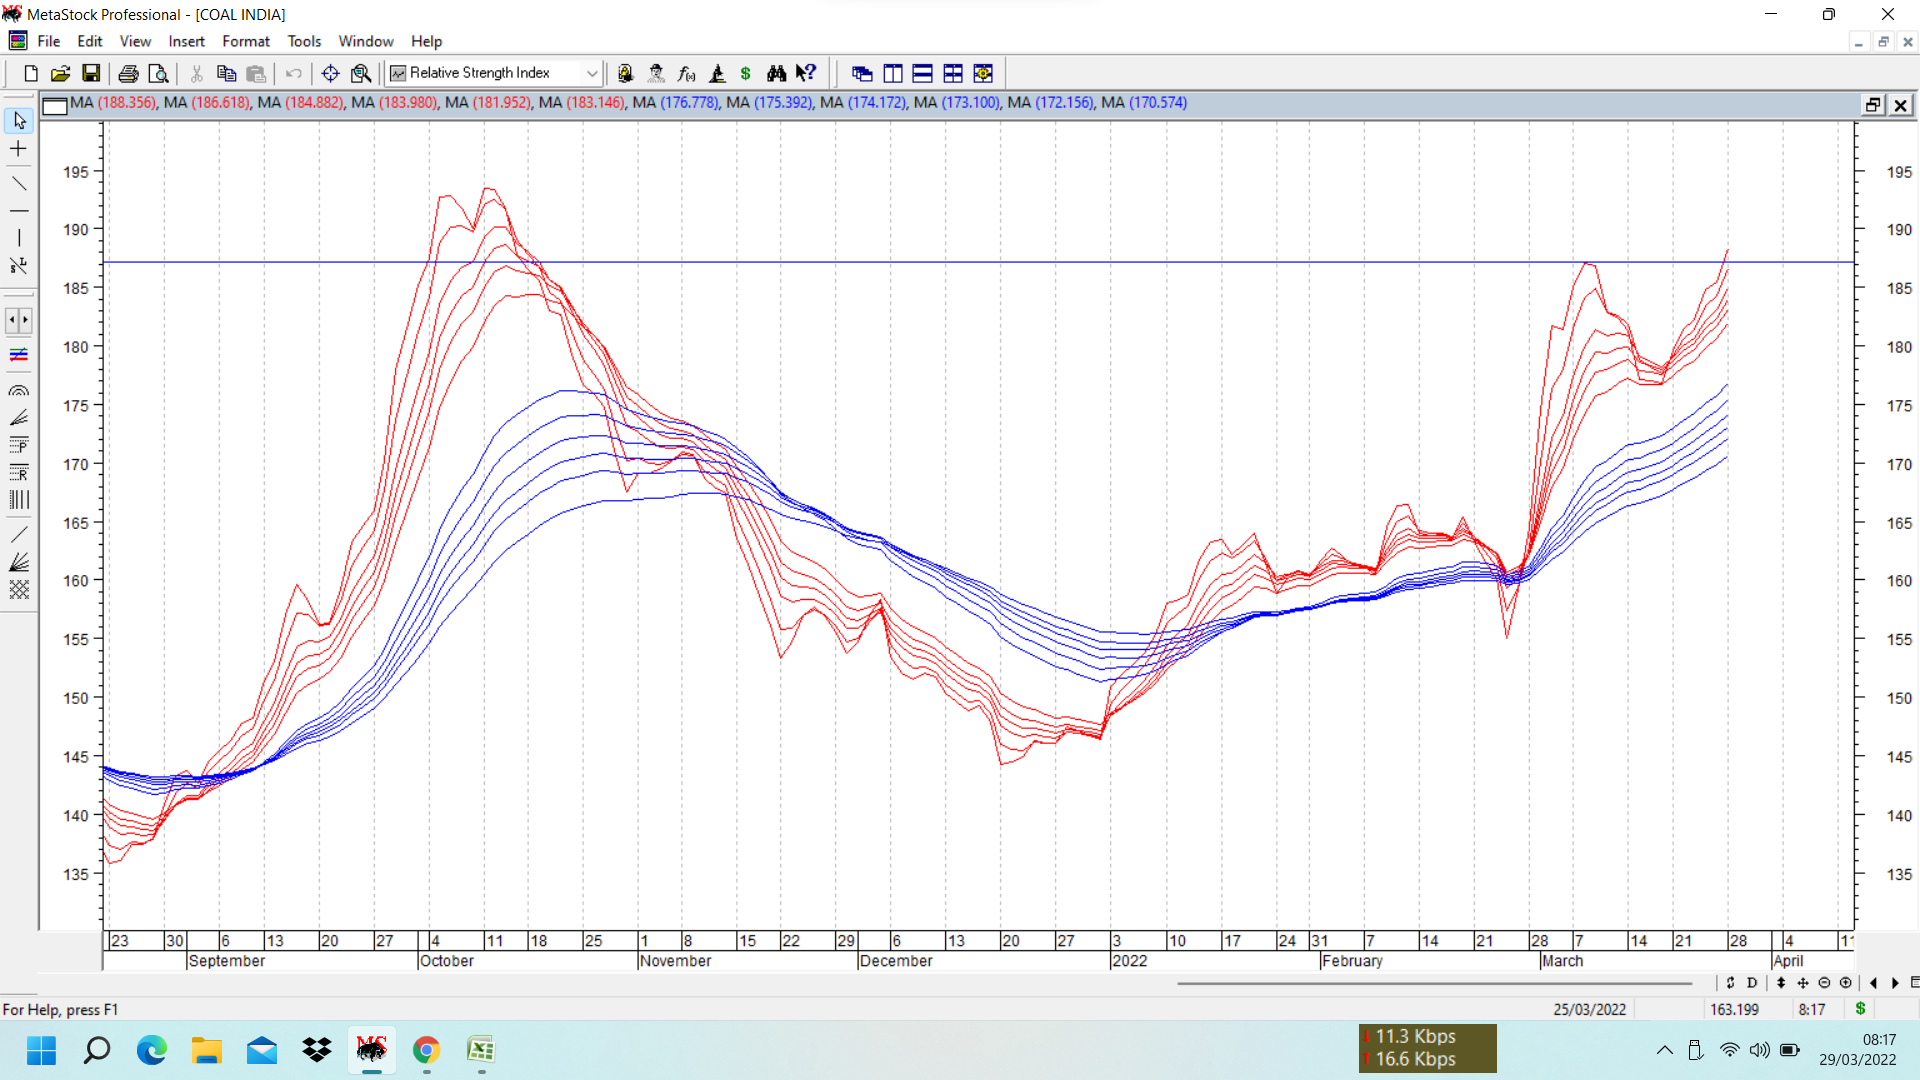
But on daily time frame a better shorter time frame cup and handle breakout is visible which has potential targets of 225-230. Putting up a GMMA (guppy multiple moving avg chart of the pattern which depicts the pattern in a much more clearer way. )
In the same vein of thought, do you have an opinion on Panacea Biotech? Peak pessimism seems to have been priced in and this is a special situation opportunity with the sale of domestic formulations for 1900cr to Mankind. Panacea will be debt free and have surplus cash equal to present market cap after the proceeds are received from Mankind (present debt is 900cr and market cap is 1000cr).
Also, I know that you don’t track Strides actively, but the does the chart indicate a medium term bottom formation to you? It is back to 50DMA with decent volumes after many months and a break above it may indicate strength in my limited understanding of charts, given that the fundamentals are also likely improving as per the management with Endo portfolio starting to fully contribute to sales from this quarter and price erosion likely start to ease in the next fiscal. Plus the promotor has been buying decent chunks from the open market over the past month.
I had a look at panacea biotech and looks like it has received a big drubbing from highs of 450 in May 21 to the current levels of 160-65. On the daily line chart, 170-172 was a good support based on closing prices. That too seems to have breached in last couple of days. In fact the chart of panacea resembles a mountain. Stock price goes up very fast in short span of time and comes down equally fast again in a short span of time. These kind of patterns take a long time to repair because a lot of people have been hurt in the stock and have been holding losing positions and hence any rally will face strong selling at various levels. Next strong support is at around 85. I don’t know how low it can go or whether it can bounce from here. But risk reward in these kind of chart formations is not favorable.
Fundamentally also I do not understand how a company with a debt of around 900 crores pays interest of close to 175-190 crores. Is there an element of forex loss? And if as you say they have sold off their formulations business to mankind and will receive 1900 crores, we need to see what kind of plan management has to utilise the proceeds from this sale. A management which knows how to waste money will run through any amount of money, and hence buying into the company based on cash on balance sheet maybe risky unless we know for sure that management is not going to screw up.
Strides chart also has similarities to mountain. First was between 2014 to 2018 when stock price went up from around 300 to 1400 within less than 2 years and then came down from 1400 to 350 in next 2.5 years. Again it had a rally from 330 in March 2020 to nearly 1000 in Jan 21, up nearly 3 times in less than a year. And came tumbling down to 300 within a year.
I think there are a lot of better options out there in the market rather than trying to catch these kind of stocks. If at all we indulge in buying these, we should be at the top of our game and know exactly what we are doing. Going against the crowd and playing contrarian is okay, but we have to be contrarian and right to be able to make money.
Extremely valid point Hitesh sir, thank you for your response.
As I understand, the management has said that the proceeds will be used for debt reduction first and the balance will then be used for growth initiatives. You are spot on that there is a risk of the management not being able to make good use of the excess cash that they will have.
The reason I am interested in assessing it for a medium term swing trade is that I feel they may be at the cusp of the up-slope of the next mountain. This is a company with so much balance sheet stress which is suddenly becoming debt free, and this may lead to at least a transitory sentiment change, and its history suggests that if this happens, the upside can be disproportionate. Purely an opportunistic up-swing potential (like in deep cyclical companies at the turn of a cycle) with downside protection on a fundamental basis due to cash on books equal to market cap. Of course allocations here can not be large with the risks involved.
I have taken a miniscule tracking position for now. Will dig deeper into the plans for cash utilization and make it a small position if and when more information emerges or the price starts consolidating.
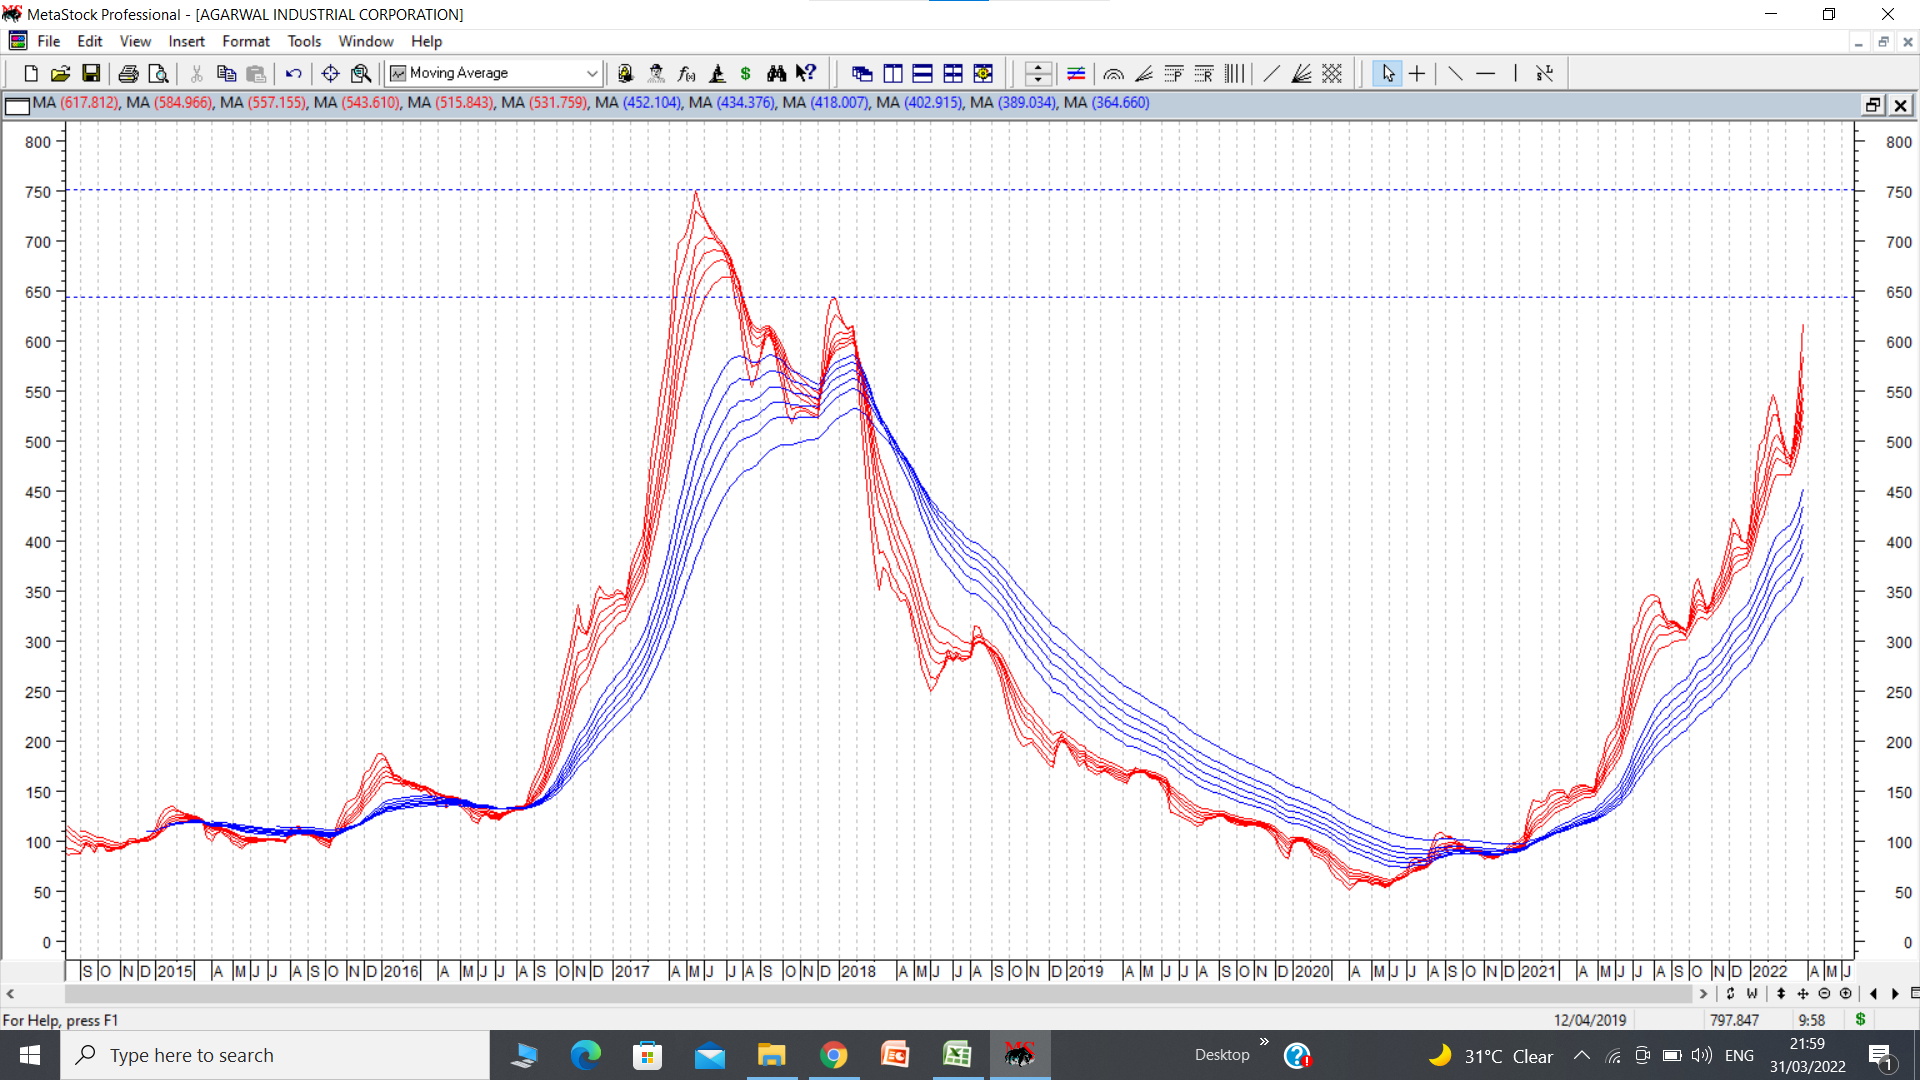
Agarwal Indl corp has a very bullish perfect rounding bottom kind of chart. Going ahead, resistances can come in vicinity of 695 and 790, previous major peaks. But the way the chart is moving, stock price can do quite well.
Usha Martin, I already put up the charts once the stock price broke out above major resistance of 102. Next major top going ahead is previous all time high of 155.
Putting up chart of agarwal inds corp for better viewing.
Hi @hitesh2710 I’m pretty new in this investment world. But I have been doing some research on Tata Elxsi. I saw that you have been keeping an eye on this stock since Nov’13.
I wanted to understand, how do you do a fundamental analysis on the business? Just read through the financial statements, go through their future prospects? How do you identify multi baggers early?
I have found Dr. Mailk’s blog super useful and easy to understand and most importantly easy to follow as it doesn’t require any paid tools, only investment of time to read various sources.
I think you need to start reading a few books on investment to get a hang of how to spot good investment opportunities. One up on wall street by Peter Lynch, Pat Dorsey’s Five rules of successful investing, Phil Fisher’s Common stocks and uncommon profits, Warren Buffett’s investment letters, etc can be good starting points.
Its not within the scope of this thread to explain everything. You can also go through entire threads of some big wealth creator stocks on valuepickr to see how the visualisation of the company was done and how things played out. And go through other good threads on art of valuation and capital allocation etc.
I am new to this forum and to the world of investing. I wanted you to share your views on Sarda Energy and Minerals Ltd. Industry PE is at ~15x but Sarda is trading at just 5.6 times P/E. What do you think is the reason for the same.
Any other information that you can share would be great!
As summer heat is spreading all over and this time it’s too hot to tolerate, Symphony looks interesting for me with breakout in charts. COVID related tough times are behind and can expect price hikes anytime in air coolers. Even Climate technologies in Australia is started doing well in recent past and momentum will pick up in coming years. Pls share your view if u track this.
Disc: Invested
Based on your level of study of the business and the technicals, where you are fairly confident about breakout etc., do you take positions in futures ? or buy and hold the stocks
@ram1984 I prefer charts where fundamentals are clear and we can clearly visualise triggers for any major move on the charts. If all these things line up then I like to allocate big and take a major position. In these types of bets, the major importance is given to certainty of the outcome rather than percentage gains expected. I do not take positions in futures.
When I expect to hold stocks for longer periods of time and where fundamental picture is clear, I usually give more importance to the business and fundamentals. For short to medium term bets, technicals assume a lot of importance.
@PraveenKG On symphony I already posted on the 52 weeks high thread. @Abhishek_Kumar_9 HCG after a long consolidation between 220 and 265 seems to be breaking out on the upside. UTI AMC chart is not too conclusive.
@ahimatsi I do not track sarda energy and minerals but like to share with you that it is a company which belongs to a cyclical sector and hence will not enjoy high or even medium PE for sustained periods.