
Hitesh bhai, any update on PNB Housing Finance from techno funda point of view…
PNB Housing has corrected nearly 25% from its recent peak at 650. Its 200 dema is currently at 481. Price movement wise, it has lost its upward momentum and I think it is likely to consolidate/correct before uptrend resumes.
In the near term, rights issue is an event that needs to be watched besides quarterly results.
9 Likes
Hi Hiteshji,
What is your view on HBL Power Systems? Do you track the company?
1 Like
HBL fundamentals have been discussed in details on 2 threads on VP one of which is the contributors corner. There is also a stock story on it. And in q3 fy 23 presentation, management has given details of its business divisions and what kind of growth they expect from each division. For good measure, they have also provided sales and ebidta figures for next few years. While we may not rely on the exact numbers provided by them, the document helps in understanding the business. Essentially it is a story of FY 24 onwards. You can go through the VP threads on the company and company presentation to get a better grip on understanding the business.
On the charts, it remains in a triangular consolidation, oscillating above and below its 200 dema. I would term it as a sideways consolidation. disc: I own it and remain bullish on it.
27 Likes
Dear Hitesh ji,
Can i request you to share your views on Pharma sector. Do you feel it has bottomed out or there could be more pain? Also request you to share your views on Jubilant Pharmova.
Many thanks in advance ![]()
Hitesh ji
Your views on vedant fashions if you are following
Hitesh Bhai
How do you play a market which has lost momentum and directionless. Still look around and experiment with some bull market going on in some sector or invest in safe bets/remain in cash or do nothing.
In a market that is weak and going down, there will be the few stocks that will go up against the overall trend… But it will be akin to looking for a needle in a haystack. So its better to sit on sidelines and wait for some markets to turn.
If one is invested in fundamentally sound companies, then it makes sense to sit tight and do nothing. But for someone who is partially/fully in cash, and has a mindset of momentum investor, it makes sense to wait and be sure about trend. For pure fundamental investors, these things do not matter.
32 Likes
@hitesh2710 ji, your views of Kernex. In the TCAS vertical it seems to be a direct competitor to HBL. As you and another boarder mentioned they have bagged Railways TCAS order worth 500 Crores + executable within 2 years.
Considering the current turnover is less than 10 crores, your thoughts please
1 Like
I was tracking HBL and hence had an eye on order inflow for peer group and hence was looking around for announcement regarding order inflow for Kernex. I was expecting similar orders to manifest for HBL which happened in due course of time. I don’t track Kernex as a company per se. So no views on Kernex.
4 Likes
HAS TECHNICAL ANALYSIS STOPPED WORKING?
We have been in a downward spiral in our markets since past few weeks and the small and midcaps space has been hit particularly hard. A lot of technically bullish set ups have not worked out and a lot of stop losses have been triggered. And a lot of questions have been raised about the efficacy of technical analysis, citing the fact that since a lot of guys have started using technical analysis, it has stopped working.
I think technical analysis has been present since a long long time and there is no reason to believe that it will suddenly stop working. For that matter, fundamental analysis and deep dive investing also has been there since a long time, and we can have references to scuttlebutt methods dating back to Phiilip Fisher and his famous book… And still this method keeps working.
The problem I think is that a lot of Youtube gurus have suddenly popped up, providing a lot of quick fix do it yourself kind of courses. And while the aforesaid gurus might be doing so with good intentions and good content, the guys who do these courses tend to start practicing TA with half baked knowledge and methods.
Most of the breakout patterns/swing trading patterns are bullish in nature and need atleast a steady and preferably a strong bull market. And since last few weeks we have seen a market that has been drifting down most of the time with the frequent bursts of downward spirals especially in the small and midcap space. This kind of bearish sentiment is not suitable for trading the common bullish set ups like flags, cup and handles, 52 week highs, multi year highs, so on and so forth. We are more likely to see pattern failures, breakout retests etc in these kind of markets and that is what we are seeing now.
But as with most things in life, “this too shall pass”. And once bearish sentiments abate and markets regain their mojo, I expect the bullish patterns to start working again, maybe to varying degrees. But those who are pursuing technical analysis based investing/trading need to sharpen their skills and try to read up more on the subject and figure out what should be the best ways of finding out patterns that have a higher likelihood of working out. According to me, the best way to do this is to combine TA with fundamental analysis, which provides the necessary edge to find out what works with higher accuracy.
84 Likes
MAKING THE MOST OF CORRECTIONS.
We have had one of the most prolonged corrections in recent memory. Barring the few rallies that have followed the deep corrections, the small and midcap space has been in a slow grind down most of the times and sharp cuts ocassionally. We still do not know whether we are out of the woods. But every cloud has a silver lining and its up to us to find it.
Most investors by nature are optimistic most of the times and hence there are very few investors who are totally in cash when markets are in deep correction modes. Few investors who are in the habit of being partially in cash can have funds to deploy during these dark phases of markets. But for people like me and I guess most others, cash is elusive when markets are in deep correction mode.
I consider market corrections as a time of catharsis and use it for course corrections for the journey ahead. During sharp downswings, even companies that have reported decent numbers and have given promising outlooks do correct to varying degrees. This is usually the opportunity one needs to grasp. These are best times to get rid of the laggards, and stocks with the least conviction and utilise these funds to get into companies which promise good growth.
For finding these companies with good promise, the simplest method is to look out for companies which have reported numbers which qualify as “positive surprise” numbers. One trick we can use is to find out market reaction to the numbers in the immediate few days post results. If results have been a positive surprise, then there would have been gap ups, or sharp rallies in these names and when there is market weakness, these names too give up most of their gains and come back to breakout levels or slightly below breakout levels. Idea should be to try to monitor their price moves and buy at opportune levels. These very stocks will bounce back very quickly once market corrections are on the verge of ending, or upmoves are on the verge of starting. And then they rally hard.
I consider two class of companies important to implement above strategy. First is the category where better than expected results have already reported for a quarter or two ( or sometimes 3-4 quarters) and still stock prices have not moved much to price in these numbers. Or after a brief rally post results, have given up most gains. These are usually the easiest low hanging fruits and offer good prospects of finding winners. The trick lies in figuring out the sustainability of earnings growth. This is a strategy which often provides a quick 20-50% upmove once markets regain some strength. This is a variant of price performance anomaly which can be used to generate better returns.
The other is a category where narrative is strong and numbers are yet to be reported. Many a times in bull markets, strong narratives will lead to more than expected upmoves. And when general markets weaken, these very stocks give up most of their gains and some more. But if through scuttlebutt, and/or guesswork or some other method ( like monitoring order book in company or its competitors etc) there is strong conviction that the earlier promised growth is going to materialise sooner rather than later, there can be a case for revisiting these names, or adding more as per portfolio allocation diktats.
I am consciously not taking names to avoid spreading any biases. With screener providing easy means to screen out companies based on reported numbers, investors’ job has become a bit easier.
94 Likes
Dear @hitesh2710 Sir, Greetings! With the current market downturn especially in the AMC space, I find ABSLAMC as an attractive bet. I still feel the taxation on the debt MF is over done in the stock. Would like to know your views on the same. Additionally, would be obliged if you share your views for Kotak Bank ( already have HDFC bank & Yes bank), oracle financial services. I am a investor who loves dividend income esp in OFSS & prefer long term picks preferably for a period of over 10 years (for above mentioned stocks).
Lastly, I would like to know how to calculate the return on periodic investment in stocks ( with no negative cash flow & infrequent purchase intervals).
Thanks!
Riddhi.
1 Like
@hitesh2710 Sir, request your view regarding stocks where growth parameters ( ROE, ROCE, Revenue, Earnings ) are intact and the future also looks bright but the promoter holding is very less ( say less than 30% )…how to take decision for those stocks.
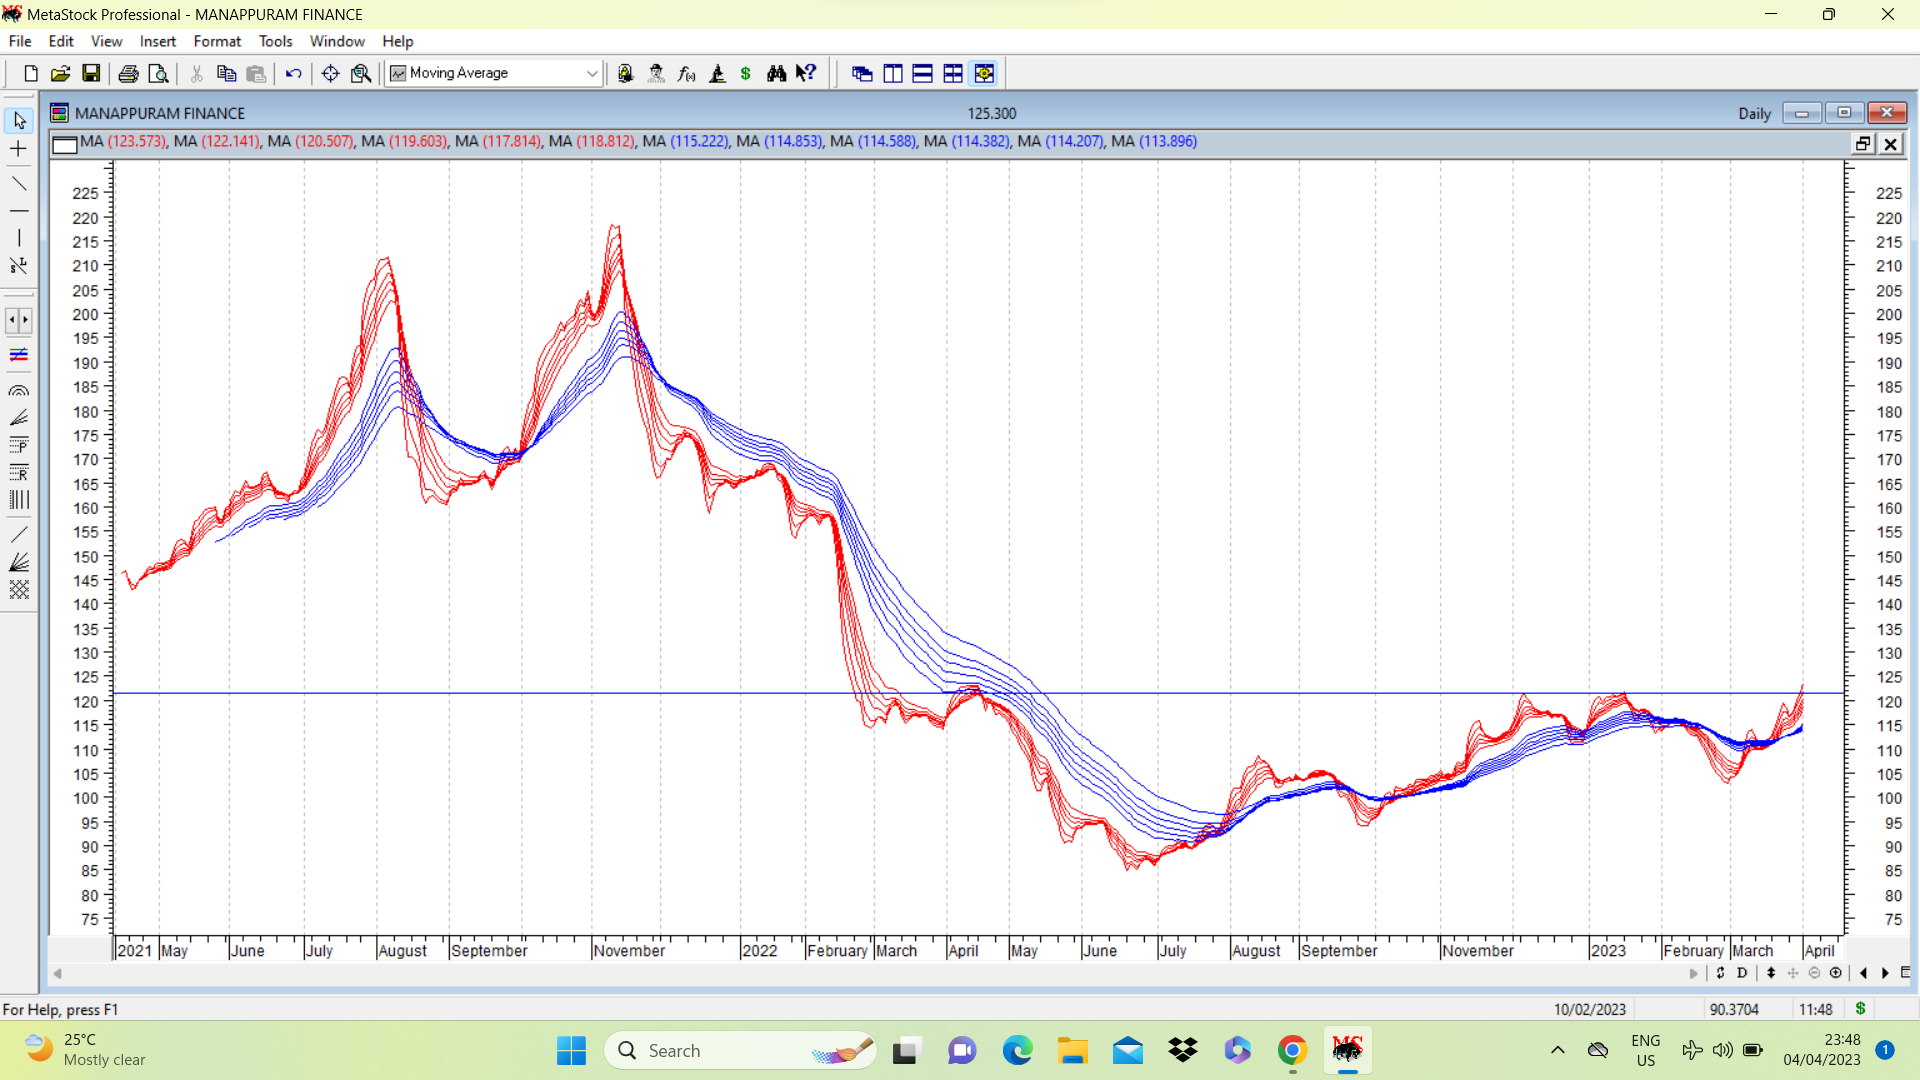
@hitesh2710 , any technical view on Mannapuram Finance. Looks like rounding bottom, golden crossover, +ve rsi divergence . What is your opinion on the charts?
1 Like
We need to look at the complete picture with respect to a company and then decide its merits. If promoter holding is low, then we need to figure out why its so and whether it has remained low over the years, or has been progressively decreasing .
If management conduct has been clean and promoter holding has remained steady (even if low) then it would be okay. Though stakes at less than 15-20% could be a cause of concern. Laurus was an example where promoter stake at the time we bought was around 32 % but for us that was not a concern because our main focus was on growth.
@riddhi I do not track most of the stock you mentioned. HDFC bank and Kotak are bonafide blue chips and can be considered good compounders if investing horizon is long enough. I don’t have much idea about how to go about calculating return on periodic investment.
6 Likes
Manappuram seems to be forming an early stage rounding bottom. At present it seems to have broken out of its resistance zone around 120. An inverted head and shoulders pattern is also visible. The only caveat is that it often tends to be very volatile in its swings.
11 Likes
Dear @hitesh2710 , your guidance and effort to educate others is very significant.
Now when you say reverse h&s visible on Manappuram chart, I think you refer to the time frame Feb 22 to until now, it looks like 2 shoulders and head fully formed.
But when I look I do see another possibility of one shoulder and head if I look at smaller time frame from Nov/Dec 22 which would bring a possibility of forming the right shoulder now by a small correction as still the chart not conclusively crossed the previous resistance… Would you please elaborate on your views in the light of my question.
Disc: tracking position of 0.5% of PF, waiting for crossing the previous resistance conclusively for adding to the position.
1 Like
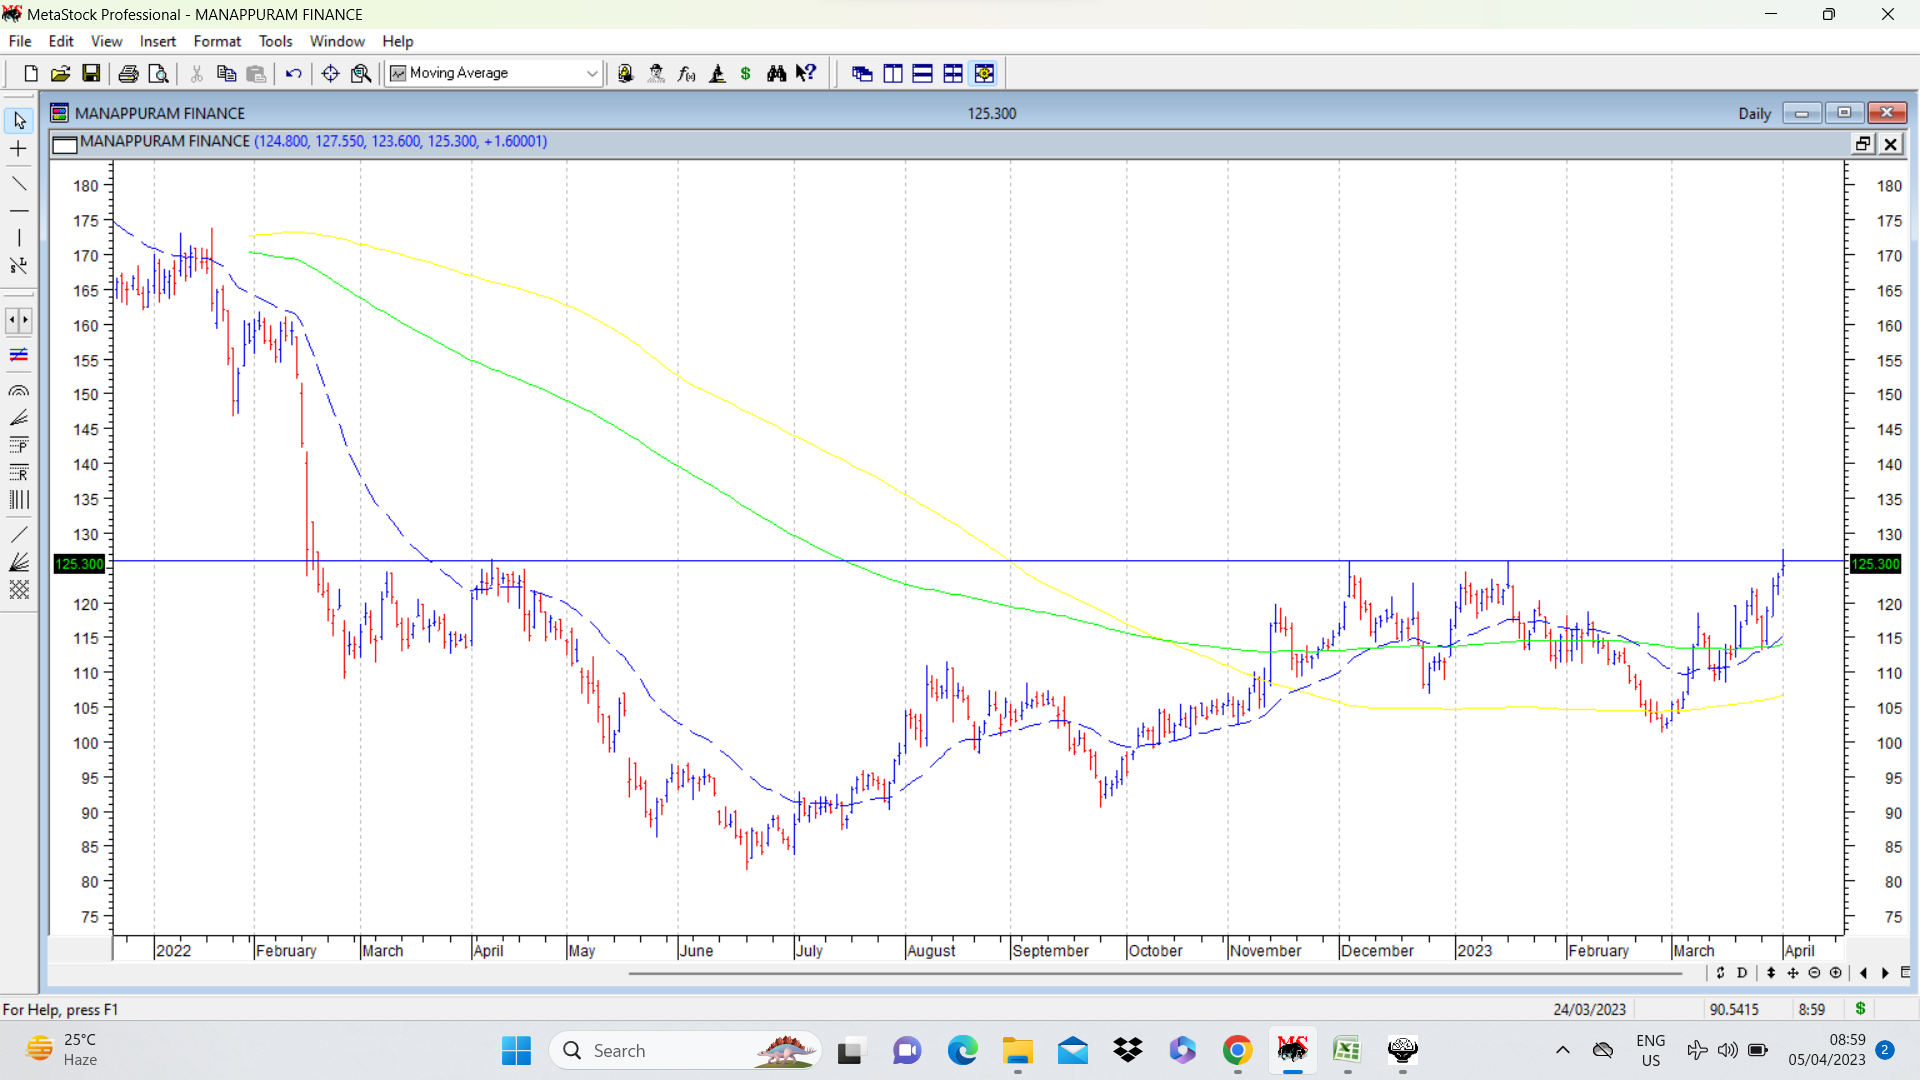
WRT Manappuram chart, your observation is spot on. But in the bar chart I am putting up anew, what is clearly visible and most important for us is the intraday resistance the stock price faced on multiple ocassions at levels of 126 or thereabouts. Once stock prices crosses that level and consolidates, or stays up, there can be confidence about the pattern breakout.
Basically all these patterns tend to show important trendline resistances, and the trendlines can be horizontal or sloping. Most important inference for us is to be able to figure out whether there is any change in trend visible on charts and how we can benefit from it. In a pattern like an inv h &s pattern, in case of Manappuram what is important to note is the resistance at 126 . We should not be lost in the smaller details, else we will lose the bigger picture. Aim always has to be approximately right than precisely wrong . Here in case of Manappuram we have an inv h&s, a sort of rounding bottom, and stock price above 200 dema and 30 WEMA and both averages have started turning up… Additional confirmation can come on breach of 126 on the upsides…
16 Likes
Hitesh bhai. Do you track RACL geartech. It is no longer unexplored now and have given a return of 100% in six months. The management is expecting a revenue increase of 30+% in the present financial year. In such stocks where run up has been Swift, do you keep averaging up or wait for some corrections.
The other noticeable thing that I find in the stock is that post results and after concall the stock makes a big jump, remains there till next result or call to give another jump.
1 Like