From LIC DHRP ,Value of New Buisness
]
Solvency ratio stood at 177 percent as of December end, more than the regulatory requirement of 150 percent
From LIC DHRP ,Value of New Buisness
]Solvency ratio stood at 177 percent as of December end, more than the regulatory requirement of 150 percent
Source:- https://www.bseindia.com/xml-data/corpfiling/AttachHis/d73a59f7-8ec4-4b8c-88cb-207f7a92face.pdf
Came across this video on youtube. For those who do not fully understand the life insurance industry it is very good starting point - provides insights on key drivers of profitability, key parameters used by analyst for valuations etc.

Hi All,
Recently IRDAI has announced that life insurers can now sell full fledged health insurance plans. I assume this will be big benefit for all life insurance companies.
Life insurance companies saw higher claims settlement amount during Q4FY2021-2022 and Q1FY2022-2023
Can anyone shed light on the reason for the same?
Block sell of 2.0% by ABRDN, one of the promoters of HDFC life insurance
Hey, I am not an expert at life insurance but am invested if HDFC life through HDFC.
I have two questions:
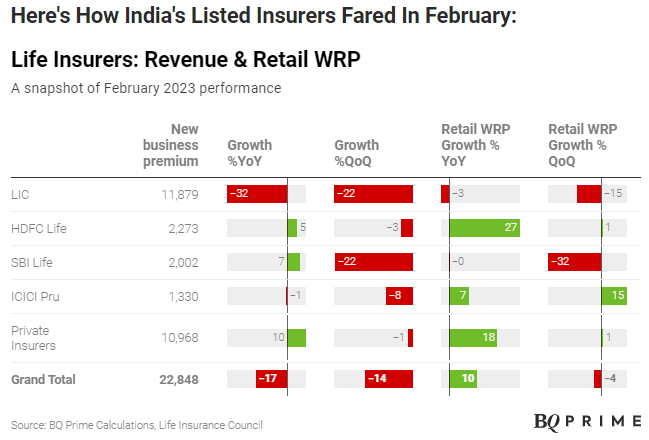
Source:- BQ Prime
Dear members,
I have a question. HDFC life is no doubt one of the best life insurers but at 78 PE is it worth buying? Or, is PE not the right metric to judge insurance companies?
The P/EV (Price to Embedded Value) or P/VNB (Price to VNB) are more appropriate valuation ratios for Life Insurance companies.
Thanks! How to calculate P/EV? Could not find it on screener.
You need to refer to the quarterly reports published by the company on the website of BSE/NSE. HDFC Life publishes embedded value every quarter.
Using embedded value (EV) you can calculate EV per share (EVPS). You can find number of shares published quarterly by the company on the website of BSE.
Finally you can calculate Price/EVPS. Ideally you should also add Value of new business (VNB) per share (VNBPS) to EVPS and the calculate Price/(EVPS + VNBPS).
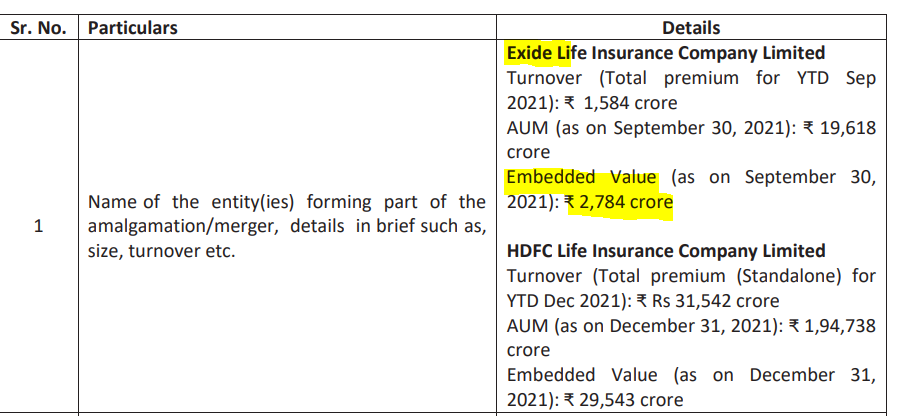
EVPS + VNBPS for q3fy23 = 185.5. This for HDFC life and Exide life combined and Price/(EVPS + VNBPS) for 20-Jan-23 = 3.2x when the price was Rs. 601.
Embedded value (IEV) = 39,527 cr growth = 31% yoy
VNB = 3,670 cr growth = 37% yoy
Number of shares = 214.94 cr
(IEV + VNB)/share = 210 growth = 30% yoy
Price to (IEV + VNB)/share = 2.6x at today’s closing price of Rs. 532.
I have never seen this stock trading at such low multiple.
Disclosure -
Invested from a very long time and therefore biased.
Thank you for such a detailed explanation!
That’s precisely what I was also thinking when I checked its latest EV. I think valuations are getting closer to global averages…is that a 1 or a 2? (For US/Europe and China…all must have different)…
Valuation derating has been >50% since its IPO few years back when it used to trade at around 5 times its EV…
I think Indian life insurance companies especially HDFC life will command a premium over it’s global peers simply because Indian life insurance market is expected to grow several times faster than global average.
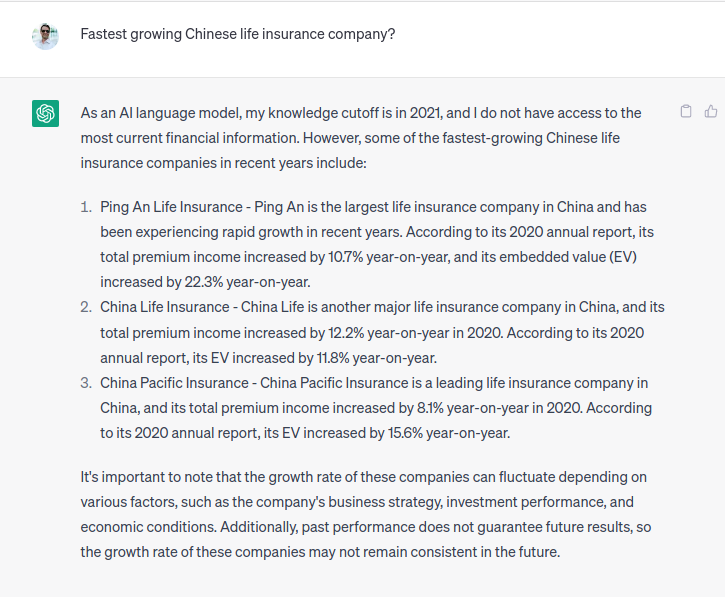
The exception is Chinese market which is also growing at fast rate but companies command a EV multiple between 2 & 3.
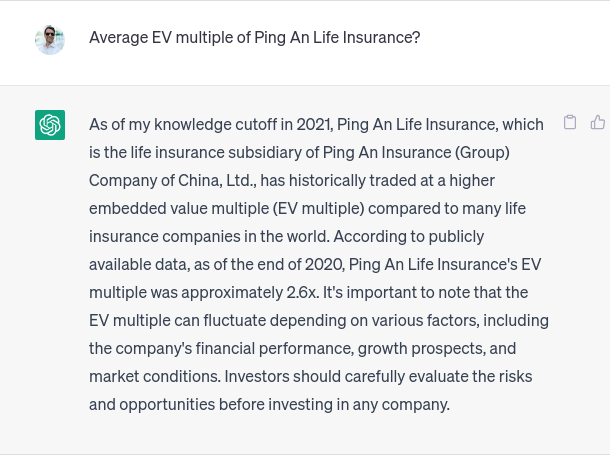
But for the reason unknown Indian stocks trade at 20% premium to Chinese market between 2010 & 2020 in spite of China clocking average GDP growth of 7.8% and India doing an average growth of 6.9%.
Therefore we may conclude that Indian life insurance companies will trage at around 20% premium to their Chinese counter which brings an average EV multiple of 3.12 for HDFC life.
Buy rating by Kotak with 30%+ upside from current CMP
Disc: Invested
No. of shares = 215 cr
Embedded value = 42,908 cr (growth=19% yoy)
VNB (TTM) = 3,797
iev + vnb(ttm)/share = 46,705/215 = 217.23
Valuation(13/Oct/23) = 625/217 = 2.9x
Historical valuation
13/oct/23 = 625/217 = 2.9x
22/jul/23 = 650/212= 3x
26/apr/23 = 532/201 = 2.6x
20/jan/23 = 601/185.5 = 3.2x
21/oct/22 = 530/173 = 3.1x
26/apr/22 = 545/154.89 = 3.5x
22/jan/22 = 630/155 = 4x
22/oct/21 = 680/147 = 4.6x
19/oct/21 = 560/120 = 4.6x
21/jul/20 = 630/113 = 5.5x
23/jan/20 = 610/110 = 5.5x
23/oct/19 = 610/104 = 5.8x
26/apr/19 = 390/98 = 3.9x
VNB for q2fy23 was 1,288 in compared to q2fy24 = 1,411 a growth of 10%. A slowdown compared to historical averages of 20%.
Thanks.
Disclosure - Holding since last few years.