
The Contrarian Fund Manager – Prashant Jain | Portfolio Yoga
Funny that what was seen as a risk 3 years ago might be seen as a +ve development today. Narratives keep changing based on stock performance and business moves.
The management should have ideally reduced dependence on PJ much earlier and made him CIO without him running individual funds. But then the legacy management was content resting on past laurels and did not put in much effort into launching new products or into energizing their channel sales teams. Many changes being done by the current CEO but these will take time to show up in the AUM number.
Guess the market right now cares more about HDFC AMC recouping market share losses and showing traction in AUM, equity fund performance over the past 2 years has been stellar across categories and steady in the debt segment.
As the market mood improves, the performance of listed AMC’s should improve operationally too. In the positive part of the cycle MTM gains and other income all come together in a virtuous cycle and can spike earnings in an impressive way. Capital market related businesses should be expected to show higher crests and lower troughs compared to businesses that don’t have their operating fortunes linked to the capital market.
Disclosure: Holding
11 Likes
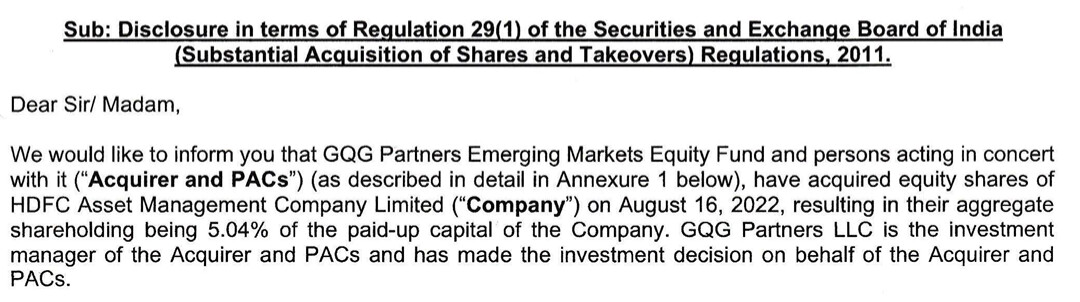
Block deals and share price hitting UC on news of Abrdn investment selling 6% stake in HDFC AMC today. Normally, whenever they sold in the past, the share price fell down. But today it’s other way around. I hope some strong and long term investors enter as Abrdn was more of a silent promoter with no value add.
1 Like
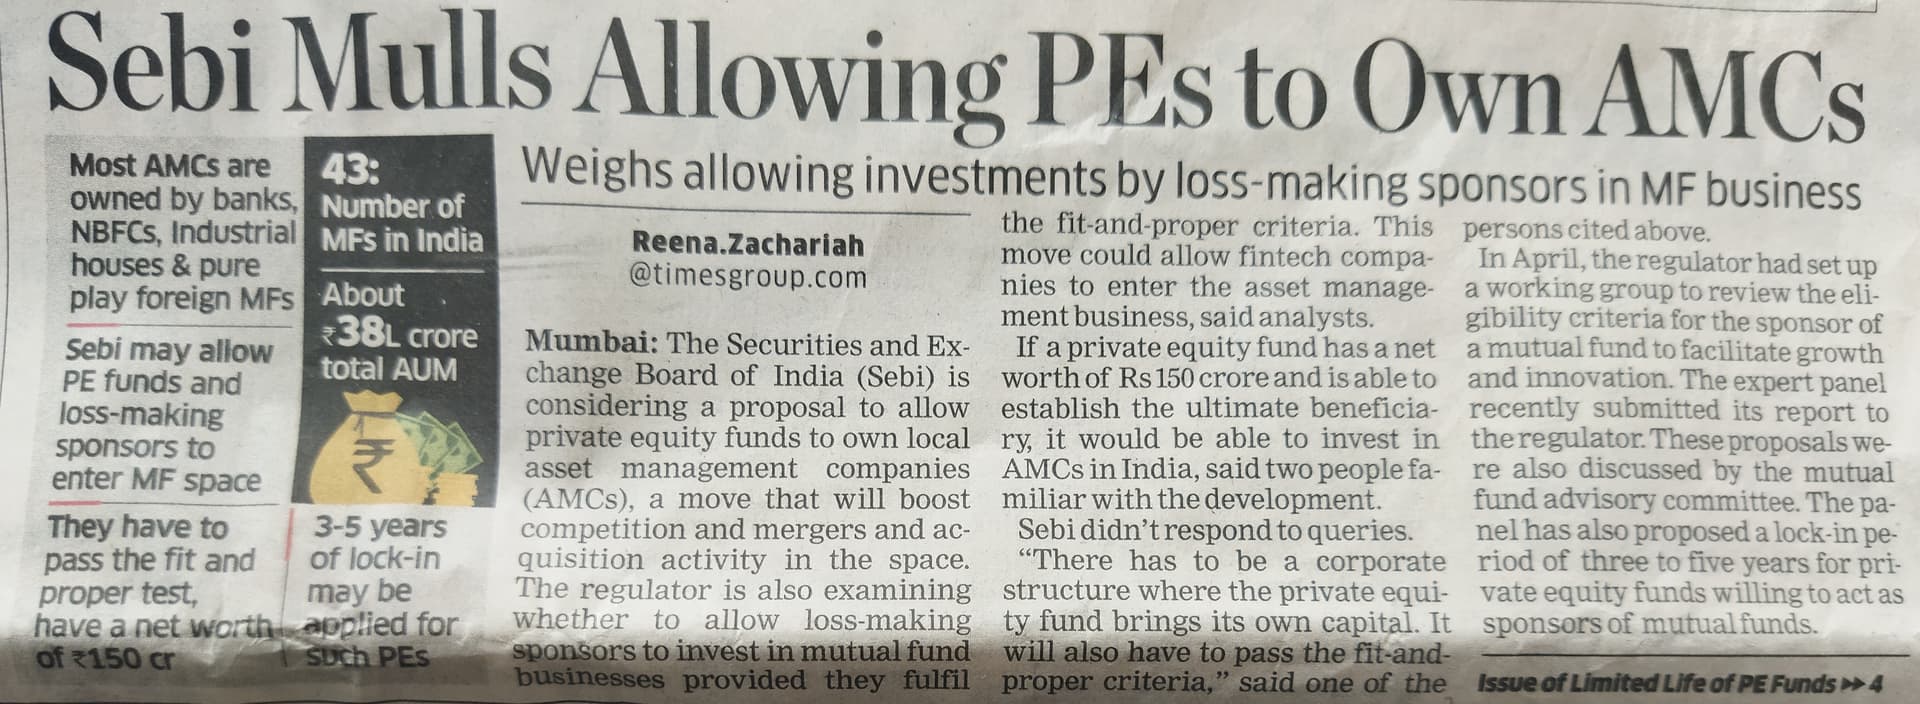
This is also in news today which may be positive for all AMC business
2 Likes
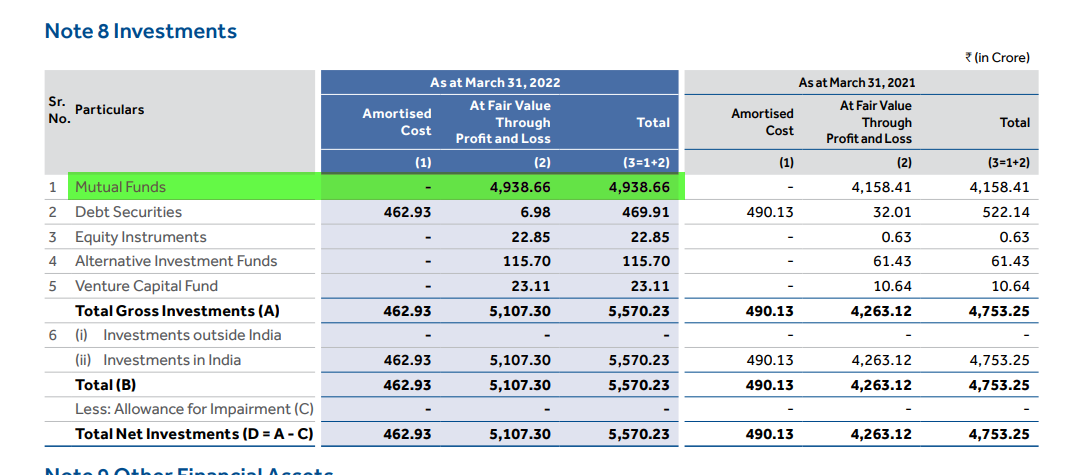
HDFC AMC has significant investments tagged under “Mutual funds”; however there is no breakdown in any of the Notes on what these investments are. Is this some kind of regulatory requirement? If not, why are they blocking such amount of money? Can someone throw some light into this?
they are maintaining liquidity for any future acquisition opportunity
@Vinay_T_M -
The regulatory mandate dictates self-investments only for the Equity Mutual Funds (5.15% of total investments in this case i.e 5.9% of 87.3%). IMO rest may be used for M&A. Least, it would ensure a high Dividend Payout for the coming years.
You may refer Page-40 of the investor presentation for details [Link].
FYR:

4 Likes
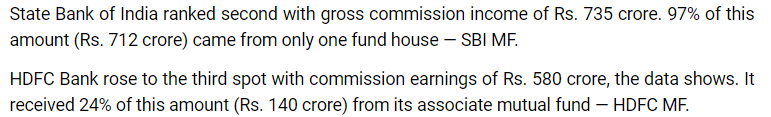
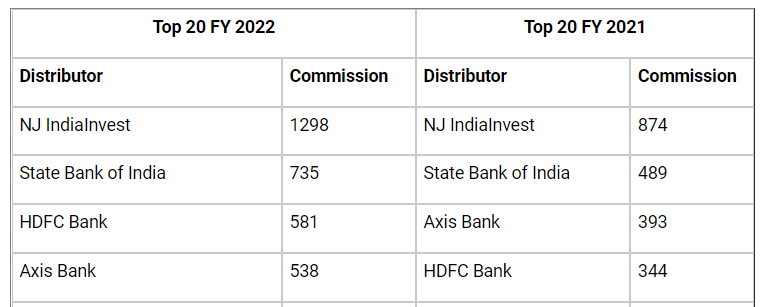
Below article highlights commissions received by MF distributors. Clearly shows how SBI MF was able to ramp up their AUM so much due to parent SBI network strength. SBI received 5 times the commission from SBI MF than what HDFC bank received from HDFC AMC.
I hope HDFC group would be doing this now due to merger and AMC becoming a direct subsidiary of HDFC Bank
A snippet:
7 Likes
Highly overvalued person.Has done nothing to show to deserve the credir which he is getting from some quarter.I am invested with HDFC MF since last6 years, greatly disappointed .Many fund have delivered far better returns.
1 Like
At last some light towards end of the tunnel
2 Likes
I have held Nippon AMC in my portfolio from the time it was Reliance Nippon. My thesis for investment back then was the opportunity that Indian demographics presented- a growing working class and growing per capita income. The stock and the sector in general has underperformed quite a bit since COVID.As part of my portfolio review, I am attempting to validate my thesis with some concreate research and supporting data points. This post broadly tries to encapsulate that (posting it here as this will mostly cover the industry)
We can break the operating earnings of any AMC as AUMx(fees/AUM)x(Net Earnings/fees)
Confidence in the estimated earnings would thus be a factor of confidence in estimation of each of these variables
-
AUM- Total Asset under management of the firm
-
Fees/AUM- How much the firm charges in aggregate for managing the assets. Hence forth in this post I will refer to this term as Fee%
-
Net earnings/fees- How much of the fees can it convert to profits (Operating Margin)
Let’s look at each of these separately.
AUM
AUM of the Indian Mutual Fund industry grew from Rs 5,96,976.79 Cr in Mar 2011 to Rs 37,56,682.56 Cr in Mar 2022. That’s 6.29X at 18.2% CAGR!
Winners and Losers over the last 11 years
To understand the industry lets first see who are the major players. Based on AMFI data, below are two charts- The first one is the Market Share break-up as on Jun-11 and the second one as on Jun-22
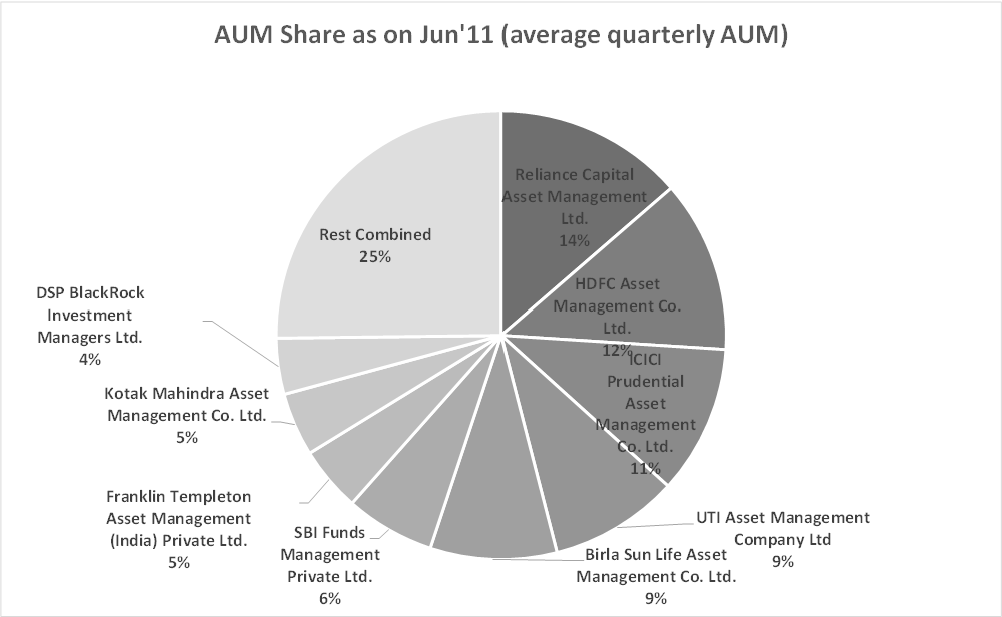
Exhibit 1
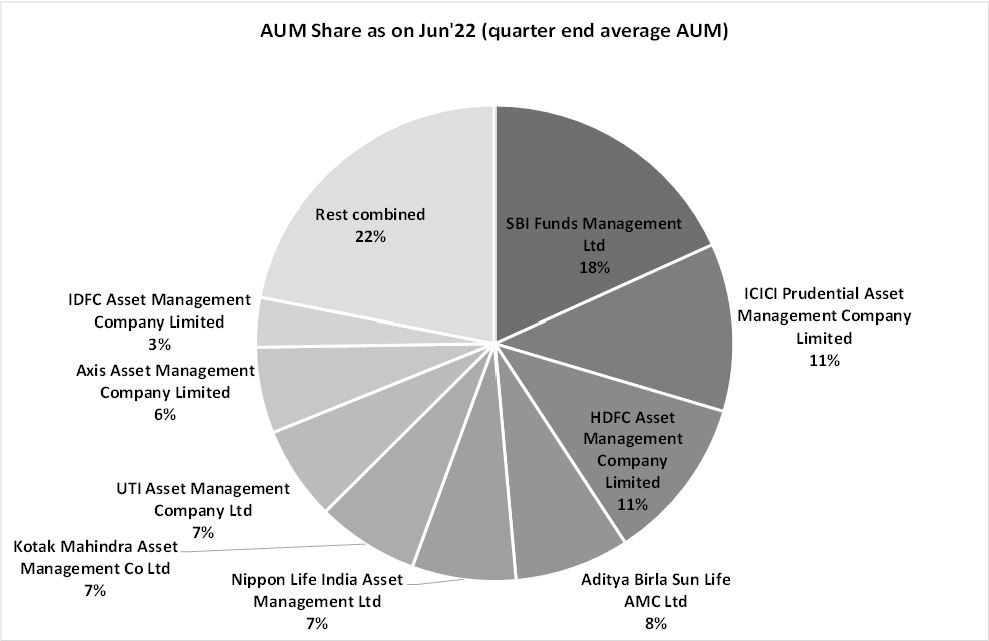
Exhibit 2
- Reliance Capital Asset Management has been the biggest loser of the decade gone by. It was an ADAG company which went down with Anil Ambani. The company eventually changed ownership and was completely taken over by Nippon (Nippon Life Asset Management). Their Market Share halved from 14% to 7% in 11 years.
- SBI Funds Management has leaped from 7% to 18% of Market share in 11 years. It currently has around Rs. 6.1 lakh crore AUM of which around 1 lakh crore is from EPFO(EPFO value is from a news article which couldn’t be validated). Even ex EPFO it’s AUM of 5 lakh crore is much higher than ICICI Pru AMC which takes the second place with AUM of Rs 3.7 lakh crore.
- Other major player have more or less maintained their market share over the last decade.
Break up of Individuals vs Corporates contribution to industry AUM
| Mar’11 | Mar’21 | CAGR | |
|---|---|---|---|
| Retail + HNI | 304034.02 | 2152140.52 | 19.47% |
| Corporates | 292942.77 | 1604542.04 | 16.70% |
| Total AUM | 596976.79 | 3756682.56 | 18.20% |
Exhibit 3
Retail+ HNI AUM has grown from 51% of total AUM in 2011 to 57% of total AUM in 2021. Overall the total AUM grew at 18.2% CAGR, Retail+ HNI growing at 19.47% CAGR and Corporate AUM at 16.7% CAGR over the same period.
I have tried to correlate the growth rate in retail AUM with the growth in GDP/capita and Income generating population growth. Population growth of 25-64 age group grew by 22% in the last decade, while GDP/Capita grew by 56%
I am considering the population growth in 25-64 age group as this mainly is income generating population.
The growth in GDP/Capita and population growth over a period should give me the growth in total income generated by this population . I am calling this variable- Aggregate income velocity (taking gdp/capita as a proxy for income/capita. The actual difference in two is less than 2-3%)
| 2011 | 2021 | 2031 (Est) | |
|---|---|---|---|
| 25-64 pop (in mil) | 569.91 | 695.66 | 807.62 |
| Pop % growth (in 25-64) | 22.0% | 16.0% | |
| GDP/Capita | 1458.11 | 2282 | 4100 |
| GDP/Capita growth | 56% | 79% | |
| Aggregate income velocity (25-64) | 90% | 107% |
Exhibit 4
GDP/Capita estimate is from IMF World Economic Outlook Database April 2022
Population estimates from UN
GDP per capita 2027 estimate is 3769. Extrapolating it to 2031
So over the period of 2011-2021 aggregate income velocity grew by 90% -AUM for individuals (HNI+ Retail) became 7X over the same period. Over the next 10 years the income velocity will likely be 107% of 2021 value.- we can conservatively estimate the Retail+ HNI AUM to show the same growth and become 7X the 2021 AUM by 2031.It can actually be much higher than that if we consider the deepening in per person contribution towards savings. Find below supporting data from Motilal Oswal’s QGLP checklist

Exhibit 5
Corporate AUM will largely depend on the surplus liquidity of the Corporates which will grow at the same pace as corporate profits. We can assume corporate AUM to continue growing at the same rate of 16% CAGR for the next 10 years.
AUM growth can be broken down in two parts- growth in base AUM due to market returns and increase in net flows. If we assume around 10% CAGR on the index for next 10 years a 2.5X to 3X increase in AUM can come about only from market returns. There are enough supporting datapoints to suggest there will be sufficient incremental flows to take the aggregate AUM to 6-7X (conservatively) of current levels
To conclude, one can say with reasonable confidence that the opportunity size for AMCs is large and it has huge runway for the next decade or two
Fees/AUM (Fee %)
Let’s now focus our attention on the next important variable in this analysis- Fees/AUM (Fee%) i.e. The revenue that an AMC generates from the asset it manages.
Every mutual fund that you invest in has an associated TER (Total Expense Ratio). The TER is what AMCs charge you for managing your money. However not all of it goes in their pocket- TER includes Management fees, operational fees, distributor fees (regular plan) and GST.
In a regular plan a chunk of the TER is distributor commission- Higher the commission, lesser the pie of TER AMCs take home. Here’s an example of one of HDFC’s most popular funds
| Scheme name | Date | Regular TER | Direct TER |
|---|---|---|---|
| HDFC Flexi Cap Fund (Erstwhile HDFC Equity Fund) | 28-Sep-2022 | 1.74 | 1.06 |
The TER for Regular plan of HDFC Flexi CAP is 1.74% while direct plan is 1.06%. The difference of 0.68% is the distributor commission- The distributor will get 0.68% of the fund you have purchased from him/her till the time you don’t sell of your holdings. Yes! 0.68% of your holding value goes to the distributor every year( No wonder your friendly neighbourhood uncle keeps pushing you to buy mutual funds from him)
Off late AMCs have been under pressure from the distributors to increase their fees. However, SEBI has capped the TER and hence AMCs can’t pass on all the increase in distributor trail fee to the customer . This is one of the reasons why yields for AMCs have been falling.
Some of the recent industry commentary suggests that sales through direct channel has gone up among the tech savvy and financially literate population, however sales through distributor channel is still more than 55% of the total sales. This has given immense bargaining power to the distributors.
I collated the QAAM of top AMCs from AMFI and took the available quarterly revenues from Moneycontrol to calculate the Fee% .
This gives a sense of drastic drop in fee% over the years. Note that this is quarterly Fee% , annualised should roughly be the sum of the quarterly Fee% for the year. (most appropriate would be to take the average of QAAMs and calculate annualised AAUM and use annual revenue)

Exhibit 6
- Quarterly fee % has dropped from 0.17% in 2016 to around 0.11% - 0.12% mark in Mar-22
- The peaks and troughs for different AMCs seem to be similar. Performance of a company is highly correlated to the industry as a whole. It will be really difficult for a company to behave very differently from the industry
- Currently HDFC AMC has 0.12% fee% vs 0.11% for NAM- India and ABSL. On an annualised basis this leads to a 4bps outperformance for HDFC AMC vs competitors. This can mainly be attributed to HDFC AMC manging substantially more proportion of Active funds compare to NAM. Active funds have higher TER as compared to passive- passives ETF have around 15-20bps TERs while TERs for actives have been around 70 bps.
Below snippets are from HDFC AMC concalls
To predict the TER 10 years out, most ideal thing would be to find the TERs of pure AMCs in a reasonably matured country (though we will be far from matured in 10 years- AUM/GDP will be around 45-55% ). However i could not easily find this data and did not dig deep enough as I found this PWC report .
PWC report dated Oct 2018

Exhibit 7
I have used this data to estimate 2031 Fee% - 0.20% (worst case) and 0.35% (best case). Again, I have tried to be conservative in my estimates. Based on this I have estimated the 2031 net profit and Mcap for Indian AMCs (later in this post).
Currently there are more than 40 different AMCs in India, clearly it’s a highly competitive industry to be in . I feel the competition is not just from other AMCs but PMSs, Smallcases and even individual investors who would manage their own money rather than give it to a Mutual Fund. The pressure on Fees will most likely persist. However, with the advent of Fintechs acting as brokers and RIAs, the contribution of direct sales can go up. If there is a substantial increase in direct sales, the pressure on Fee % will reduce.
Operating Margin
Operating Margin is one of the easier variables to estimate. AMCs have tremendous economies of scale. Even if the AUM size increases in multiples the operating expense would almost remain the same. (You need almost the same infra to run a 1,00,000 Cr fund vs a 10,00,000 Cr fund)
By looking at the past trend and management guidance we can assume FY31 operating margin for all the companies to be around 70-75%

Exhibit 8
Other Income
AMCs generate other income mainly from their investments (of their own asset). They are mandated by SEBI to have some percentage of their assets in their own fund. While other income will largely depend on market conditions, if one believes that the market will be in a bull run for the next 10 years(that should be your main thesis to invest in AMCs) and looking at the past trend we can reasonably expect 10% of Revenue as other income for FY32

Exhibit 9
Tying it all together
For Top 3 listed AMCs, I have estimated a range of values for the important variables based on the datapoints discussed till now.
Company specific estimates are more on the basis of general industry trends as i believe almost all the larger firms will deliver similar operating performance unless there is a firm-specific issue. Have assumed that HDFC AMC will still be managing more active funds and hence will have a better Fee%. Have also assumed valuation premium for HDFC AMC compared to Nippon AMC and ABSL.
I have assumed the AUM growth rate of each of the firm to be same as industry, the inherent assumption here is that they will maintain the same market share in FY31.
| HDFC AMC | Nippon AMC | ABSL | |||||||
|---|---|---|---|---|---|---|---|---|---|
| FY 32 Est | Bear Case | Base Case | Bull Case | Bear Case | Base Case | Bull Case | Bear Case | Base Case | Bull Case |
| P/E | 20 | 25 | 30 | 18 | 22 | 25 | 18 | 22 | 25 |
| AUM (CAGR) | 17.50% | 20.5% | 25% | 17.50% | 20.5% | 25% | 17.50% | 20.5% | 25% |
| Fee % | 0.25% | 0.30% | 0.35% | 0.20% | 0.25% | 0.30% | 0.20% | 0.25% | 0.30% |
| Stock returns | 5.80% | 13.11% | 22.13% | 6.30% | 13.80% | 22.60% | 8.50% | 16.20% | 25.15% |
| Div Yield | 3.50% | 2.80% | 2.80% | 5.00% | 4.00% | 3.60% | 3.90% | 3.20% | 2.80% |
Exhibit 10
• I have arrived at operating income using AUM growth and Fee%. Operating Margin for all 3 firms is assumed to be 75%. Have considered 10% of revenue as other income. Assumed tax rate of 25% to arrive at the net profit.
• Using the P/E multiple I estimated the FY 32 MCap for each of these firms. Stock returns is the CAGR of the current MCAP to FY 32 estimated MCap
• Current Dividend payout for NAM is 95%, the management has guided that it will be near 100%. I have assumed 90% Dividend payout for NAM in FY32 to calculate the dividend yield. Have assumed 70% payout for both HDFC AMC and ABSL
• To consider actual return form investment we need to consider both stock return and dividend yield - this should be a bit more than arithmetic sum of stock return and dividend yield (assuming dividend is reinvested)
To conclude, investing in any of the well run AMC in India seems like a good option right now as long as the return expectation is to 7x to 10x the capital in 10 years. The valuation having corrected from its peak gives us a good entry opportunity .This sector is unlikely to make you uber rich but is unlikely to wipe out your capital either. Even in the worst case scenario the returns will likely beat inflation comfortably. Lucrative Dividend yield is the icing on the cake.
Disclaimer: I am not a part of this industry nor am I an industry expert. All of this is based on secondary research of publicly available information. Do your own due diligence before investing. Feel free to point out gaps/mistakes if any in this piece.
Disclosure- Holding NAM from lower levels. Currently around 5% of my portfolio.
44 Likes
As per G Maran of Unified Capital; before 2010 - investor was mostly from large / metro cities hence HDFC AMC was infocus and gaining market share. Post 2010 as MF investment got popular, SBI took lead in tier 2 / 3 / 4 cities hence their market share got increased and same is visible in numbers put by @Pratik_Shetty.
6 Likes
AMC business looks like a good secular story, and as mentioned in above posts; an investor should able to compound the capital at decent rate.
Also, the logic as explained by Deven that, HDFC AMC has been loosing market share to SBI due to more population from Tier2/3/4 cities started investing in Mutual funds looks partially correct. Another factor for loss of HDFC market share is that, some of their funds were under performing due to value investing principles adopted by them and now with new management, things may change slowly. Also, EPFO has helped SBI to gain market share.
At the same time, I believe that, MF business can grow much faster if per capita GDP can grow better. It seems that, currently we are lagging behind. 1458 to 2282 over a long period of 10 years is about 4.58% which shows that, the growth is below average or very low compared to the demographic dividend which we have.
If this per capita GDP growth becomes close to 6% (which looks difficult as of today) then it should reach 4100 in 2031 as estimated.
From 4.58% to 6% is substantial improvement, which if achieved, will help AUM to grow as estimated. Also, we should note that, this Per Capita GDP growth was achieved during low inflation decade and Now in next decade inflation could be high. In a way, it may help to achieve more growth in incomes (salaries) leading to higher Per capita GDP growth or it may not since income might be consumed and savings could be low. I may be wrong in my analysis.
Disc : Holding HDFC AMC.
6 Likes
i feel there is huge tailwinds in sector and been holding both HDFC AMC & Nippon AMC… been
buying through SIP since last 6 months post price correction…
big booster for sector will come post consolidation in industry & exit of few players…
2 Likes
Tailwinds are there in MF industry. I believe that, people should start taking benefit of slightly better GDP growth in India as compared to developed and other developing nations by regularly investing in Equity MF(s).
Also, Per capita GDP may need to grow at faster rate than 4-5%, as that will create additional surplus in the hands of investors so that they can invest rather than saving or investing only in real estates. There is massive potential in equity as compared to Real estate which need to be understood by large population which is away from equity.
With some of these triggers, AMC business should able to grow at decent rates for next 10-15 years, as per current visibility. There will be tough competition going ahead and AMC(s) need to innovate, use digital channels to promote investments, increase efficiency else they may see margins shrinking going forward.
All in all, this is an interesting sector to keep on your radar.
No fireworks in Q2 results. Nothing was expected either.
Main positive is about market share, the loss of which seems to have been arrested now. Hopefully they turn it around and target regaining 2nd position.
If they get back debt AAUM of 2.35 lakh crores which they had till last Dec , Jan timeframe, that will get them closer to ICICI.
Btw, does anyone have insight into how that debt AAUM suddenly dropped to 1.95 lakh crores in March?
3 Likes
3 Likes