
Thanks for the suggestion. I can run this simulation in a slightly different way than what you suggested and still get to the same destination.
My portfolio return is 21.5% for the whole year 2020. So I can simply look at the yearly return for combined weighted portfolio of stocks I started this year with and sold during the crash. This is how it would look like for the whole year 2020 if I had not sold these stocks and held throughout the year:
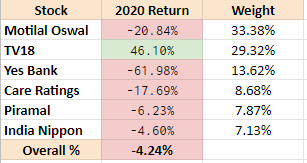
The weights are not the portfolio weights, just the ones which I have sold out in the crash. So if I had Rs 100 invested in these 6 companies - I had Rs. 33 in Motilal Oswal, Rs. 29 in TV18 and so on.
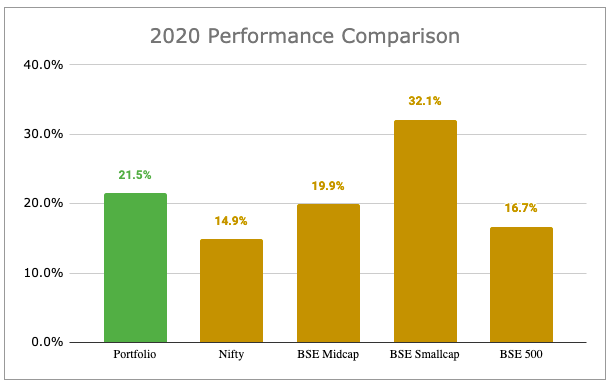
As you can see, I’m much better off having sold these businesses when I look at the chart below:
Apart from the returns, just the quality of these businesses does not inspire much confidence from a long term perspective. The one business which I regret having sold in June is Bajaj Finance which has doubled from those levels but on 2020 year basis has provided 25% yearly return.
PS: As I’m not running my portfolio on a replacement opportunity basis (like some who only keep 10-15 stocks and just replace the last best idea with the next best one) - it will be a very tedious exercise for me to track what all stocks I’ve bought after selling in the crash as there will be many new stocks added in that timeframe.