Given the ferocious bull run we’ve had since 23rd March and the “so-called” money lots of retail investors have made since then, I wanted to analyze my portfolio performance (Coffee Can + Satellite) as well and really understand how it’s done in comparison with the benchmarks.
Portfolio vs Benchmark indices performance* since 23rd March till today (at that point portfolio was very financials heavy and broadly down 40% in-line with the benchmarks)
| CAGR % | Absolute% | |
|---|---|---|
| Portfolio | 258.96% | 73.37% |
| Nifty | 167.30% | 53.05% |
| BSE Midcap | 183.12% | 56.91% |
| BSE Smallcap | 235.85% | 68.95% |
| BSE 500 | 174.00% | 54.70% |
*Doesn’t include dividends and transaction costs, can trim 0.5-1% from absolute returns effectively
Some Thoughts
- Portfolio has performed much better than all major indices and also somewhat better than the smallcap index which has rallied the most since 23rd March
- Portfolio performance would indicate that I have a small cap heavy portfolio and few big winners in that
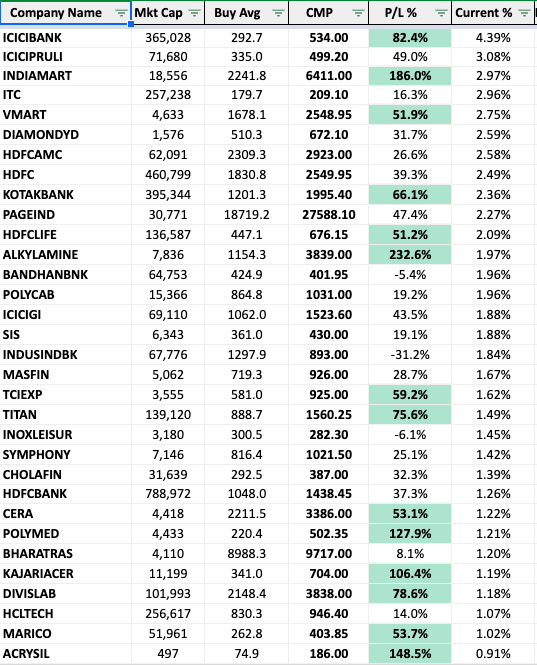
Now sharing my Coffee Can and Satellite portfolios:
| Company Name | Mkt Cap | Buy Avg | P/L % | Allocated % | Current % |
|---|---|---|---|---|---|
| BANDHANBNK | 51,556 | 424.9 | -24.70% | 6.68% | 4.57% |
| ICICIBANK | 270,448 | 292.7 | 39.90% | 3.35% | 4.25% |
| DIAMONDYD | 1,471 | 510.3 | 22.90% | 3.72% | 4.15% |
| ICICIPRULI | 64,787 | 335.0 | 34.60% | 2.87% | 3.51% |
| VMART | 3,629 | 1678.1 | 19.60% | 2.52% | 2.73% |
| SIS | 5,754 | 361.0 | 9.10% | 2.73% | 2.71% |
| HDFCAMC | 53,283 | 2327.6 | 7.60% | 2.39% | 2.34% |
| HDFC | 337,718 | 1830.8 | 2.70% | 2.49% | 2.32% |
| HDFCLIFE | 118,948 | 447.1 | 31.80% | 1.92% | 2.29% |
| INDIAMART | 10,237 | 2241.8 | 57.20% | 1.51% | 2.15% |
| POLYCAB | 13,399 | 864.8 | 4.10% | 2.29% | 2.16% |
| ALKYLAMINE | 6,812 | 1154.3 | 189.30% | 0.82% | 2.17% |
| ITC | 240,681 | 181.5 | 7.90% | 2.20% | 2.16% |
| PAGEIND | 22,421 | 18719.2 | 7.40% | 2.14% | 2.09% |
| ICICIGI | 58,221 | 1062.0 | 20.60% | 1.82% | 1.99% |
| MASFIN | 4,723 | 719.3 | 20.10% | 1.80% | 1.96% |
| INOXLEISUR | 3,117 | 300.5 | 0.80% | 2.15% | 1.97% |
| KOTAKBANK | 291,007 | 1193.0 | 23.40% | 1.70% | 1.91% |
| TCIEXP | 3,131 | 581.0 | 40.20% | 1.41% | 1.80% |
| HEXAWARE | 12,305 | 239.0 | 71.60% | 1.11% | 1.73% |
| POLYMED | 3,733 | 220.4 | 91.90% | 0.99% | 1.73% |
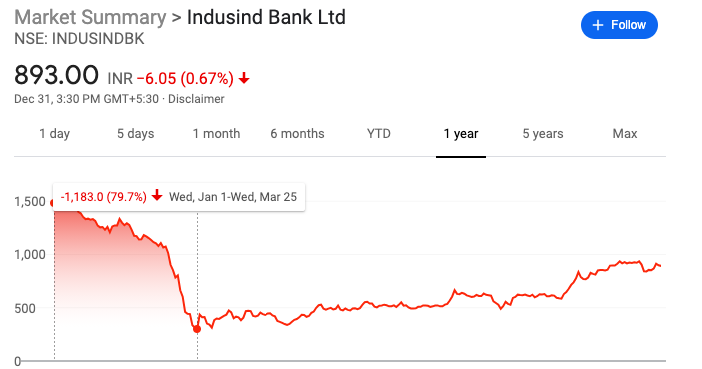
| INDUSINDBK | 45,562 | 1297.9 | -47.80% | 3.71% | 1.76% |
| BERGEPAINT | 54,743 | 430.8 | 30.70% | 1.35% | 1.61% |
| SYMPHONY | 6,296 | 813.8 | 10.60% | 1.45% | 1.46% |
| CHOLAFIN | 20,482 | 292.5 | -14.70% | 1.78% | 1.38% |
| TITAN | 100,772 | 888.7 | 27.80% | 1.18% | 1.37% |
| DIVISLAB | 86,823 | 2148.4 | 52.00% | 0.92% | 1.27% |
| MINDTREE | 19,494 | 757.3 | 56.50% | 0.87% | 1.23% |
| MARICO | 48,311 | 262.8 | 42.50% | 0.92% | 1.19% |
| CERA | 3,295 | 2211.5 | 15.50% | 1.11% | 1.16% |
| 3MINDIA | 23,579 | 17685.0 | 18.00% | 0.76% | 0.81% |
| GODREJAGRO | 9,411 | 358.8 | 36.60% | 0.59% | 0.73% |
| LALPATHLAB | 15,159 | 1401.9 | 31.10% | 0.44% | 0.52% |
| PIDILITIND | 73,556 | 1231.9 | 17.80% | 0.42% | 0.45% |
| Coffee Can Portfolio | 61,319 | 16.20% | 64.11% | 67.62% |
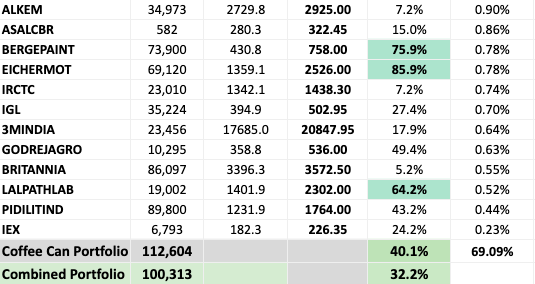
| Company Name | Mkt Cap | Buy Avg | P/L % | Allocated % | Current % |
|---|---|---|---|---|---|
| MACPOWER | 75 | 49.3 | 51.3% | 1.79% | 2.47% |
| DELTACORP | 3,135 | 160.2 | -27.1% | 3.56% | 2.36% |
| EDELWEISS | 7,501 | 125.9 | -32.8% | 3.44% | 2.10% |
| RADIOCITY | 728 | 15.6 | 34.3% | 1.45% | 1.77% |
| IDFCFIRSTB | 18,095 | 49.6 | -32.1% | 2.69% | 1.66% |
| IBULHSGFIN | 9,387 | 462.6 | -51.7% | 3.47% | 1.52% |
| BHARTIARTL | 285,595 | 538.2 | -2.9% | 1.65% | 1.46% |
| PSPPROJECT | 1,559 | 378.9 | 14.3% | 1.14% | 1.18% |
| RKEC | 92 | 37.3 | 7.4% | 1.06% | 1.04% |
| NEULANDLAB | 1,233 | 707.5 | 35.7% | 0.81% | 1.00% |
| KAJARIACER | 7,185 | 341.0 | 32.5% | 0.80% | 0.97% |
| SAMKRG PISTONS | 127 | 117.6 | 9.7% | 0.94% | 0.94% |
| BETA | 83 | 59.0 | 38.1% | 0.67% | 0.85% |
| EICHERMOT | 60,464 | 1359.1 | 63.0% | 0.58% | 0.86% |
| DBCORP | 1,419 | 64.1 | 26.6% | 0.73% | 0.84% |
| WORTH | 68 | 36.6 | 17.2% | 0.78% | 0.83% |
| LAURUSLABS | 12,475 | 1015.7 | 14.6% | 0.78% | 0.82% |
| SUNTV | 18,859 | 392.2 | 22.0% | 0.72% | 0.80% |
| INSECTICID | 1,039 | 507.0 | -1.0% | 0.94% | 0.85% |
| APLAPOLLO | 6,095 | 1174.4 | 108.5% | 0.42% | 0.79% |
| LGBBROSLTD | 824 | 213.7 | 22.8% | 0.69% | 0.77% |
| ACRYSIL | 312 | 74.9 | 56.1% | 0.51% | 0.72% |
| RACL GEARTECH | 119 | 66.5 | 66.3% | 0.47% | 0.72% |
| IGL | 28,767 | 394.9 | 4.1% | 0.76% | 0.72% |
| SOLARA | 2,561 | 655.8 | 44.6% | 0.52% | 0.68% |
| FIEMIND | 795 | 273.4 | 121.3% | 0.33% | 0.67% |
| PAPERPROD | 2,131 | 207.4 | 36.1% | 0.49% | 0.60% |
| MMP | 229 | 50.7 | 77.5% | 0.36% | 0.58% |
| SHK | 1,194 | 51.5 | 63.9% | 0.37% | 0.55% |
| BANCOINDIA | 716 | 74.7 | 29.1% | 0.35% | 0.41% |
| MPTODAY | 7 | 15.8 | -4.1% | 0.45% | 0.39% |
| GOLDIAM | 256 | 106.8 | 7.9% | 0.38% | 0.37% |
| SECURCRED | 8 | 205.0 | -92.4% | 1.76% | 0.12% |
| Satellite Portfolio | 14,337 | -0.60% | 35.89% | 32.38% |
| Mkt Cap | P/L % | |
|---|---|---|
| Combined Portfolio | 38,179 | 10.10% |
The marketcap of the portfolios are an average and not weighted average. I did some analysis (rounded off the numbers below) to find the average market cap of Nifty, BSE Midcap and Small Cap indices as of today:
-
Nifty - 182,000 cr (50 constituents)
-
BSE Midcap - 20,000 cr (101 constituents)
-
BSE Smallcap - 3,300 cr (716 constituents)
-
BSE 500 - 30,000 cr (501 constituents)
Key takeaways
-
Given my average portfolio constituent market cap is 38,000 cr - it is best compared with BSE 500 performance since 23rd March. It’s pretty satisfying to see the portfolio having delivered close to 20% out-performance in these 5 months as compared to BSE500
-
Satellite Portfolio is where the majority of the out-performance has come from given it holds most of the small, micro, nano cap companies. Also carrying a few scars of the previous bull run (NBFCs) still in the portfolio. Most of those have recovered more than 100% from the March lows. Price anchoring has prevented getting rid of them so far. Still working on overcoming those biases
-
Coffee Can portfolio has remained absolutely rock solid and performed significantly better than Nifty and Midcap indices. Mostly used Saurabh’s book and Marcellus philosophy for stock picking (one thing which I don’t really agree with them is on the average growth 100+ P/E businesses considered as reasonable investments)
-
Total portfolio of 67 stocks - the Coffee Can companies will mostly remain. However, the Satellite portfolio is going to be run down slowly in the next 3-5 years - I see significant money to be made in mid/small-caps over the next 3-5 years. The small cap index has given barely given 6% CAGR in the last 15 years versus Nifty 11% CAGR - I see some serious catch-up here over the next few years.
-
I’m invested in almost every single sector you can think of - Banks, NBFCs, Pharma, Chemicals, Agrochemicals, Telecom, Infrastructure, Internet, Print Media, Radio, Auto OEM, Auto Ancilliary, etc. - as long as the company is good with a solid balance sheet, good track record and shareholder friendly management, I’m happy to put money on the line. Managing and tracking so many companies is definitely a difficult job and reasonably time consuming - but the peace of mind and good night’s sleep which it gives is way better than one single sector or company taking down my portfolio.
Am I compromising returns with overdiversification? I don’t know the future and maybe a broad based bull run has helped me outperform the market so far. Anyway, I’ll be be doing this activity on a monthly basis so let’s see how it goes from here.