
Register - Screener has this data. The screenshot given is from another website, it appears
1 Like
Thanks but I am specifically looking for a source where i can check monthly shareholding data. Screener can show insider trades, block deals or quarterly shareholding data but it does not have a comprehensive monthly shareholding data.
Let me know if someone knows the source.
2 Likes
For Monthly Shareholding of Mutual Funds, there is a source. It is here:
3 Likes

It so happens that I come across Godrej properties news in bulk. Here’s the 2 min back development:
UPDATE:
I was recently looking at the chart of Godrej Properties. Although my investment in Godrej properties was based on sound fundamental analysis, I wanted to apply my Wave theory knowledge into the Godrej Properties stock.
I am unsure how acceptive the community here is of Technical analysis, but I thought to share my findings.
I see Godrej Properties had hit its low when it touched the 1930’s mark. Even if Market falls further 200-300 points, there is very less likely hood that Godrej Props will undercut this price point. On the contrary, I see it has finished its downward trend. It is in the end cycle of it. At max few days of sideways movement (+/- 4%) can be expected before the upward move starts. The upward move could be a multi-month-long move with targets going up beyond what most analysts are telling now. Given the current market headwinds, most analysts have kept their targets on muted levels and not the most probable levels. We have seen new land acquisition news and sell-off of their luxury offerings being very positive. A lot of this is yet to be digested by market. This would happen once the Nifty Bites the bullet of Trump tariffs by next week’s end.
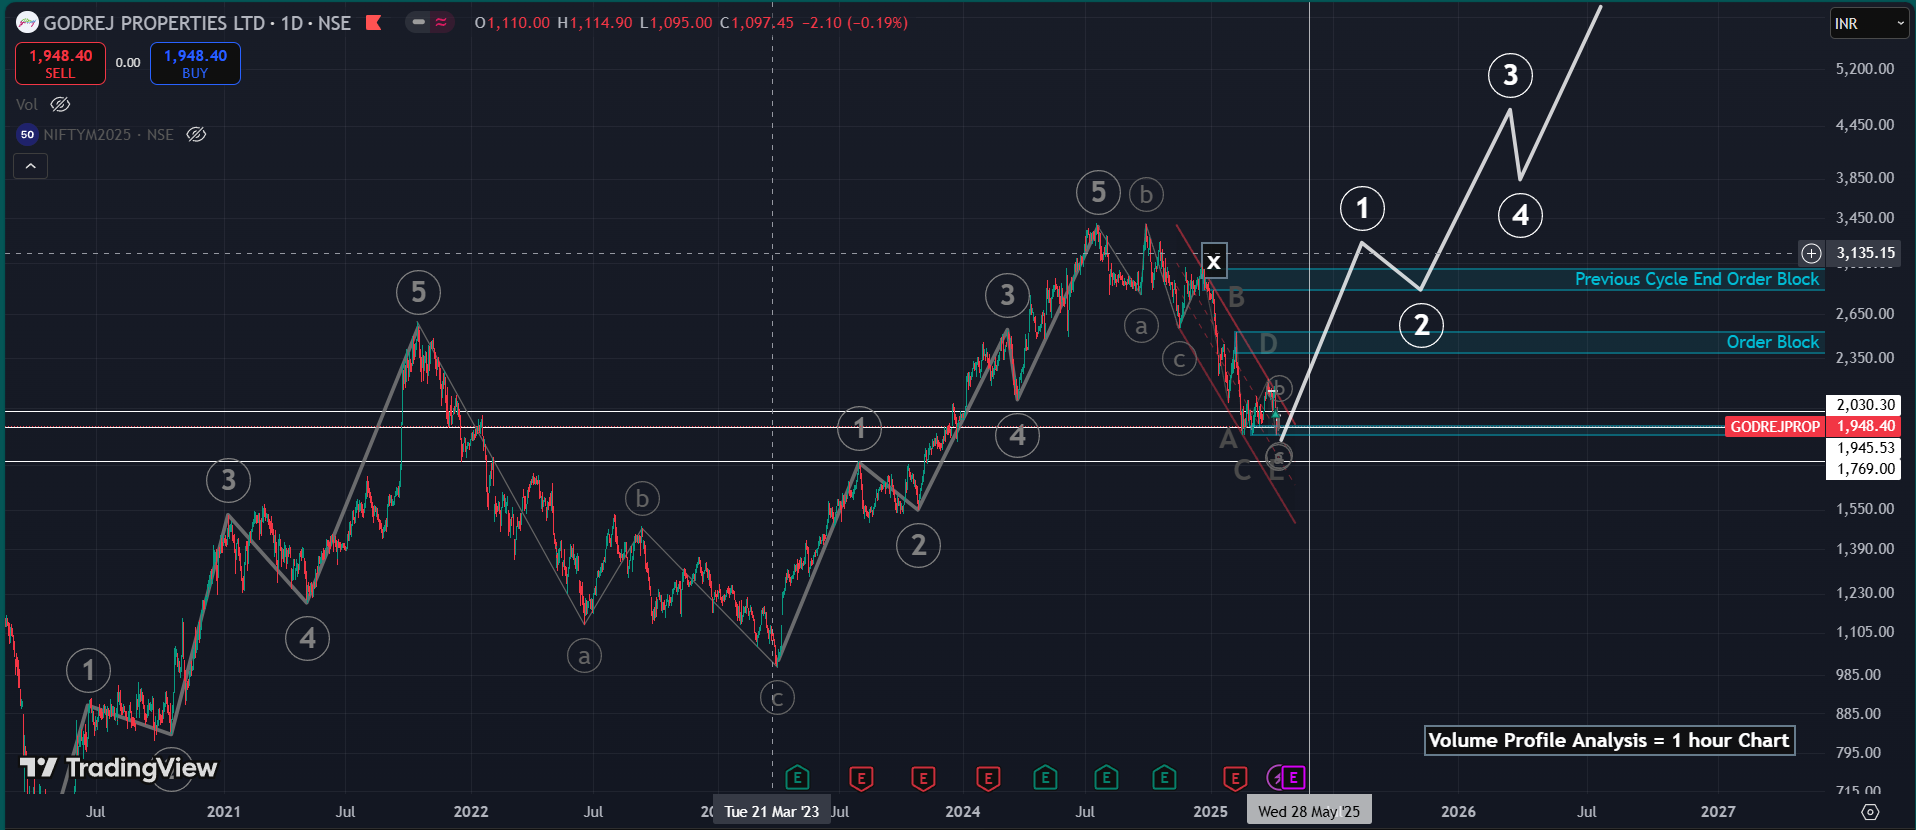
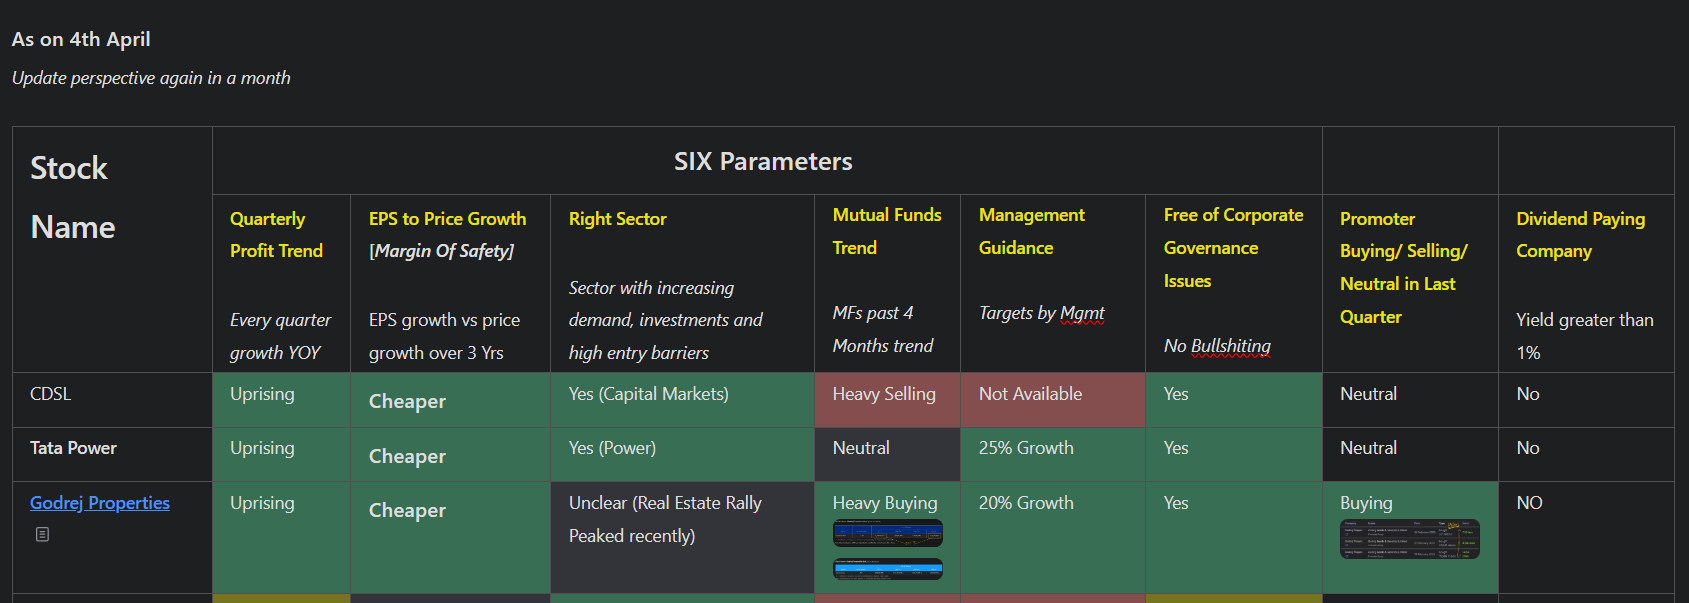
So from all this, along with my 7 indicators of stock Fundamentals and liquidity as shown below, I see its the perfect time for Godrej properties to create wealth for its investors.
–
Update:
Some Important articles released on Real Estate Sector:
- Check the interesting example of EMI. How a 50 bps point can effectively reduce the yearly EMI cost by 30,000 Rs for New buyers. It could be a reason for buyers to finally click the buy button.
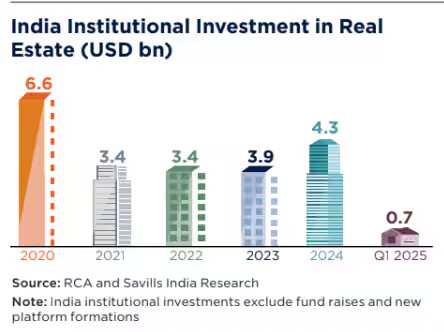
Equity investments in real estate hit $2.9 bn in Q1 CY25, up 74%: Rpt
-
Total equity investment inflows into real estate stood at $2.9 billion in the first quarter of the calendar year 2025 (Q1 CY25), marking a 74 per cent year-on-year (Y-o-Y) increase, according to CBRE South Asia, a real estate consulting firm. In the same quarter last year (Q1 CY24), investments stood at $1.7 billion.
-
Bengaluru, Mumbai, and Delhi-NCR accounted for 67 per cent of the total equity inflows. Sequentially, investments grew by 13 per cent. The inflows were primarily driven by developer activity and heightened interest from real estate investment trusts (Reits) and institutional investors.
-
“India’s real estate sector continues to demonstrate resilience and attract sustained investor interest despite global headwinds. The sharp uptick in capital inflows during January–March 2025 reflects strong fundamentals, robust demand across asset classes, and growing confidence among both domestic and foreign investors.”
-
Investment activity is expected to maintain a positive trajectory in 2025, driven by capital flows into built-up office and warehousing assets and strong acquisition pipelines for residential, warehousing, and mixed-use development sites.
- Foreign capital made a strong comeback in the Indian real estate sector in FY25, with cumulative investments at 3.1 billion, compared to $2.6 billion in FY24, a report showed on Monday.
- The surge in foreign investments has led to an increased share of foreign investors in Indian real estate – accounting for 84 per cent of total investment in FY25, up from 68 per cent in FY24.
- We anticipate continued capital deployment in built-up office, warehousing, and alternative asset classes such as data centres and healthcare, backed by a healthy pipeline of opportunities and stable macroeconomic indicators.”
Residential real estate drives 51% of Rs 6,400 cr PE Inflows in Q1 FY25
Conclusion:
- Real estate sector is more likely going to continue its long running rally since COVID into 2025.
- The capital inflows show confidence and liquidity in the sector.
- FIIs are net positive on the sector.
Disl: Personal Views Only. No buy-sell recommendation.
1 Like
Hi, I am trying to do a valuation for Godrej, I see that you have calculated the fundamental value based on their bookings and estimated PAT for that. Is that the correct metric, considering that all those booking will not be delivered in a single year? Also are Real estate companies not analyzed on the basis of EV/Ebitda more than PE?
I am a bit confused about evaluating the margin of safety on GP because they have a lot of land as well and they keep buying more, which I do not know how to use as an input in my valuation.
2 Likes
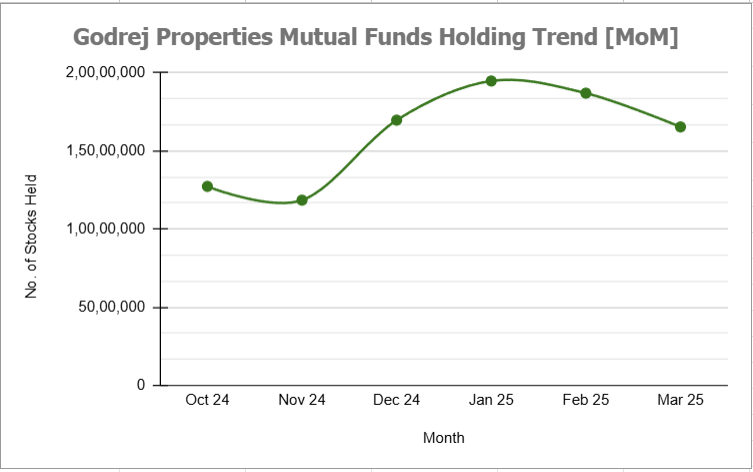
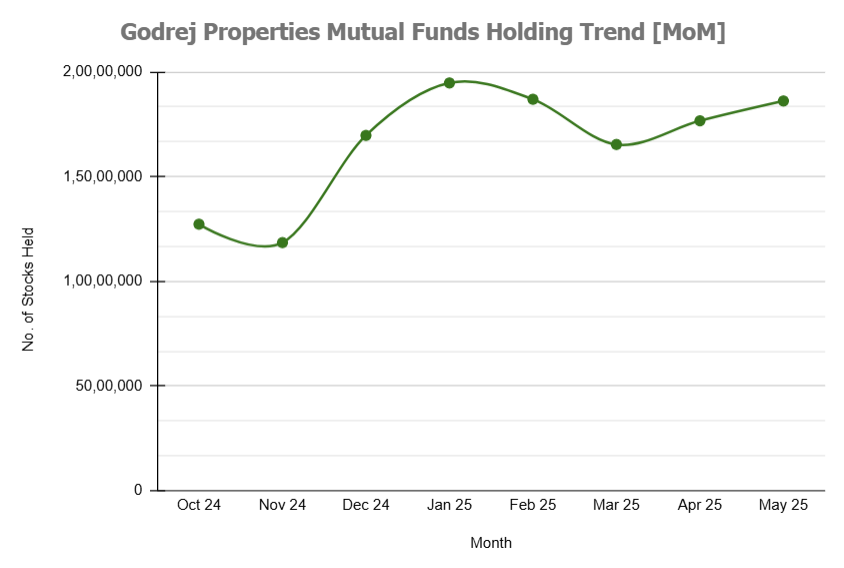
I plotted Month on Month Buy/Sell Trend of Mutual Funds in Godrej Properties. Here is how it looks.
Observations:
-
MFs have had some selling of stock during the Market downturn.
-
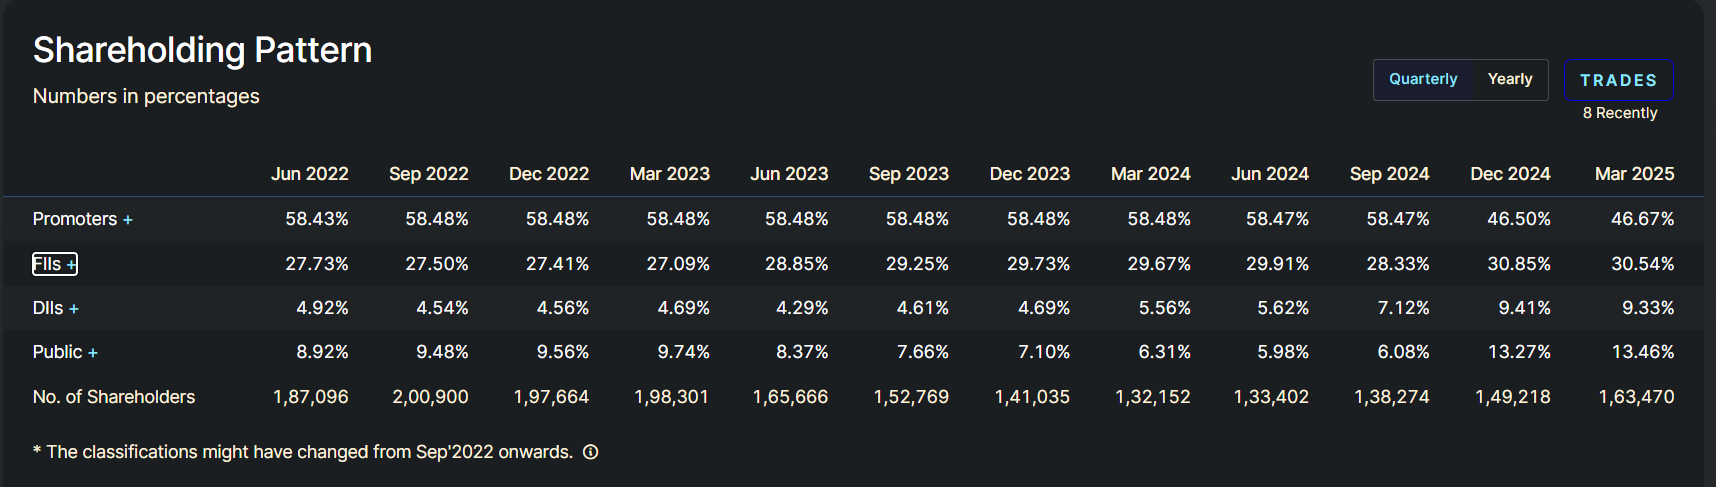
While MFs sold in March, Promoter bought in March. There was a reduction of 21 Lakh shares in Mutual fund holding from Feb to March (1,86,96,298 - 1,65,36,806). This roughly amounts to 420 Crore worth of shares if we generalise 2000 Rs per share price. In the same period, Promoter bought 100 Crore worth of shares.
-
FIIs were also Net sellers in the Quarter gone by as seen in below:
-
Thus, Retail Investors and Promoters have been buying the dips in the stock throughout this time.
Now the time will tell who made the right choice!
Discl: Invested and views might be biased.
1 Like
Godrej Properties have delivered another stellar quarter with bookings of 25.73 million sqft having value of 29444 Crores in the past 12 months. They have also met all the guidance the management gave in the beginning of the year. Refer below.
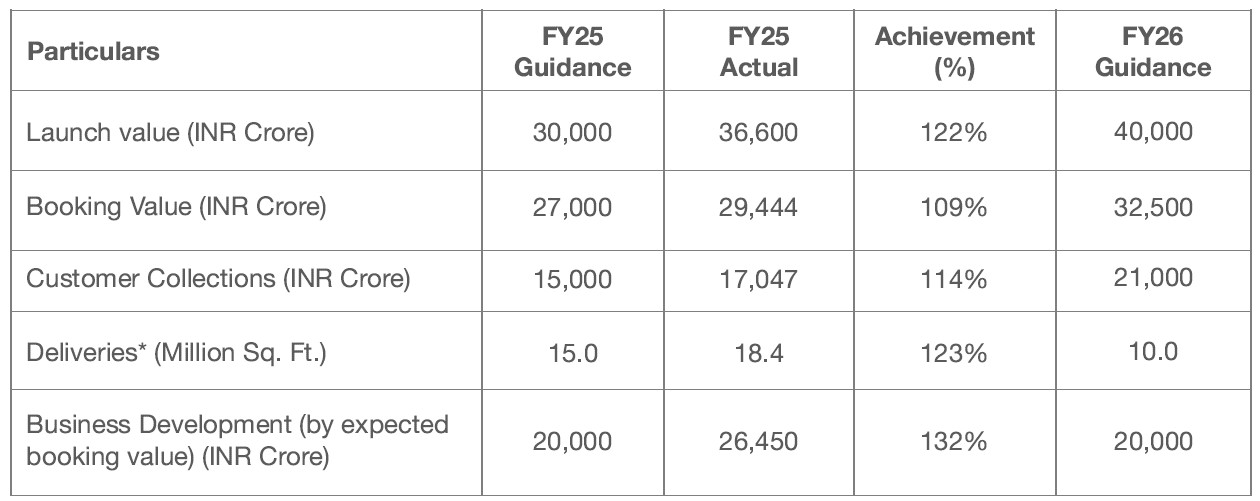
I have updated my rough valuation calculations as per the FY26 guidance. Forward PE is considered as 20. Net Profit Margin is considered as 13.5%. It seems to be trading at 25% discount to fair value.
- FY2025E Booking Value: 32500 Crores
- Pre-Tax Profit (18% of Sales): 5850 Crores
- Post-Tax Profit (75% of Pre-Tax Profit): 4388 Crores
- Expected MCap @ PE = 20: 87,760 Crores
- Current MCap (02-May-25): 67,750 Crores (2250/share)
Please note this is NOT a buy or sell advice. I am NOT a SEBI registered adviser.
1 Like
Hi Pavan. Generally real estate companies take 2 years to deliver. However, during bull run they make more bookings and it may take close to 3 years to deliver. Hence, I have considered a 2-year forward PE multiple. I am not sure whether PE is the right valuation metric or not, but it has worked for me. I am not a believer in EV/EBITDA valuation.
Land is a raw material for real estate companies. I don’t consider land in valuations. It is just a check to ensure they have enough land for next couple of years.
1 Like
Price to sales is better metric used in case of developers.
Hi,
I analyzed their Q4 conference call for FY25, and they performed really well, exceeding the company guidance. I tried my best to understand why their future guidance for FY26 is so low, even though they did well. Does anyone know why their guidance is so conservative? Is management’s commentary on future guidance the reason the stock is not performing well, despite other stocks in the sector delivering strong returns?
1 Like
New Updates on Godrej Properties from my Notes:
**
There is a buying trend since last 3 Months of data that is available.
-
Jefferies removed Godrej Properties from their list of recommended stocks.
https://www.financialexpress.com/market/jefferies-chris-wood-reshuffles-india-portfolio-3-new-stocks-added-3889612/ -
Nomura gave reduce call with a target price of 1900 Rs.
Nomura predicts 18% downside in Godrej Properties, sees Phoenix Mills falling 11% on lofty valuations - The Economic Times -
Morgan Stanley downgraded, Revised target from 3400 to 2400 Rs.
DLF, Prestige Estates among top Real Estate picks for Morgan Stanley; Godrej Properties downgraded - CNBC TV18
3. Godrej Prop vs Top 10 Residential Project Real Estate Cos.
While Godrej properties is facing some heat from analysts. here is some comparative analysis of Godrej properties vs Top 10 Residential Project Real Estate Companies by Market Cap:
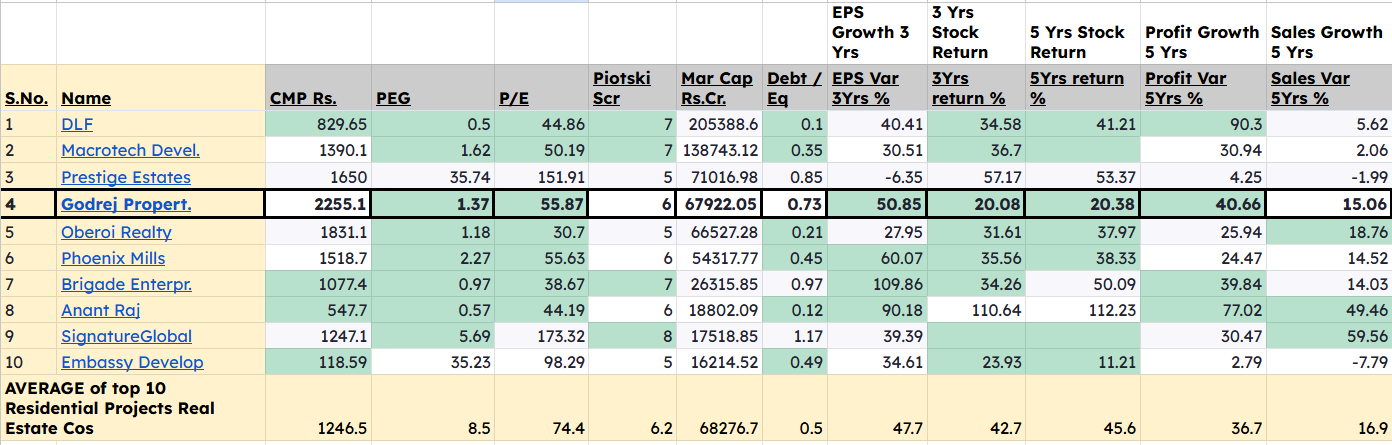
Here are some Insights from it:
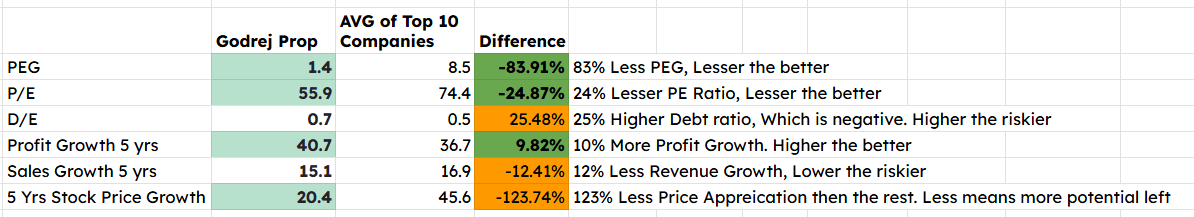
Some thoughts:
- Godrej properties has better valuations than the average of top 10 Listed Residential Project Companies (by Market Cap). Its low P/E and PEG ratios are a proof to it.
- It has roughly Equal or better Profit and revenue metrics for past 5 years than the average of top 10.
- The stock price has appreciated much less than the average appreciation in top 10. This shows much more growth potential is left to be priced in. This is also evident from the Comparative price graph below of Nifty Realty Index vs Godrej Prop since Covid.

As such, the apprehensions for valuations of godrej properties seems either overly stretched or misattributed by many of the analysts above.
While some analysts such as Antique Broking, JM financial have shown positive buy ratings too for Godrej Properties.
I personally feel the tracking data of godrej properties portray a positive image. Even if management misses its own targets in Q1, it is likely that the first half of the year could have been tougher given that many savvy buyers would have waited for RBI’s rate cut before making buy decisions. This is absolutely normal to guess.
That’s it. I will be continuing to track the stock. I see potential in the company. Note that my views are biased as an investor. Please do not consider any of the above as recommendation or suggestions. Do your own research.
8 Likes
is anyone following this script and update on latest developments, chart is forming bullish bias