Context
Bottom of the pyramid fishing: That is what has been lucrative (Puppy Drooling) to my eyes since 2020. Eg. being
-
Hunting the cyclical industries at the bottom of the cycle
-
Making the entry in consumer internet companies (only one though since I hate the ludicrous valuations) at such a point that even if they get bankrupted, you tend to recover majority of your money
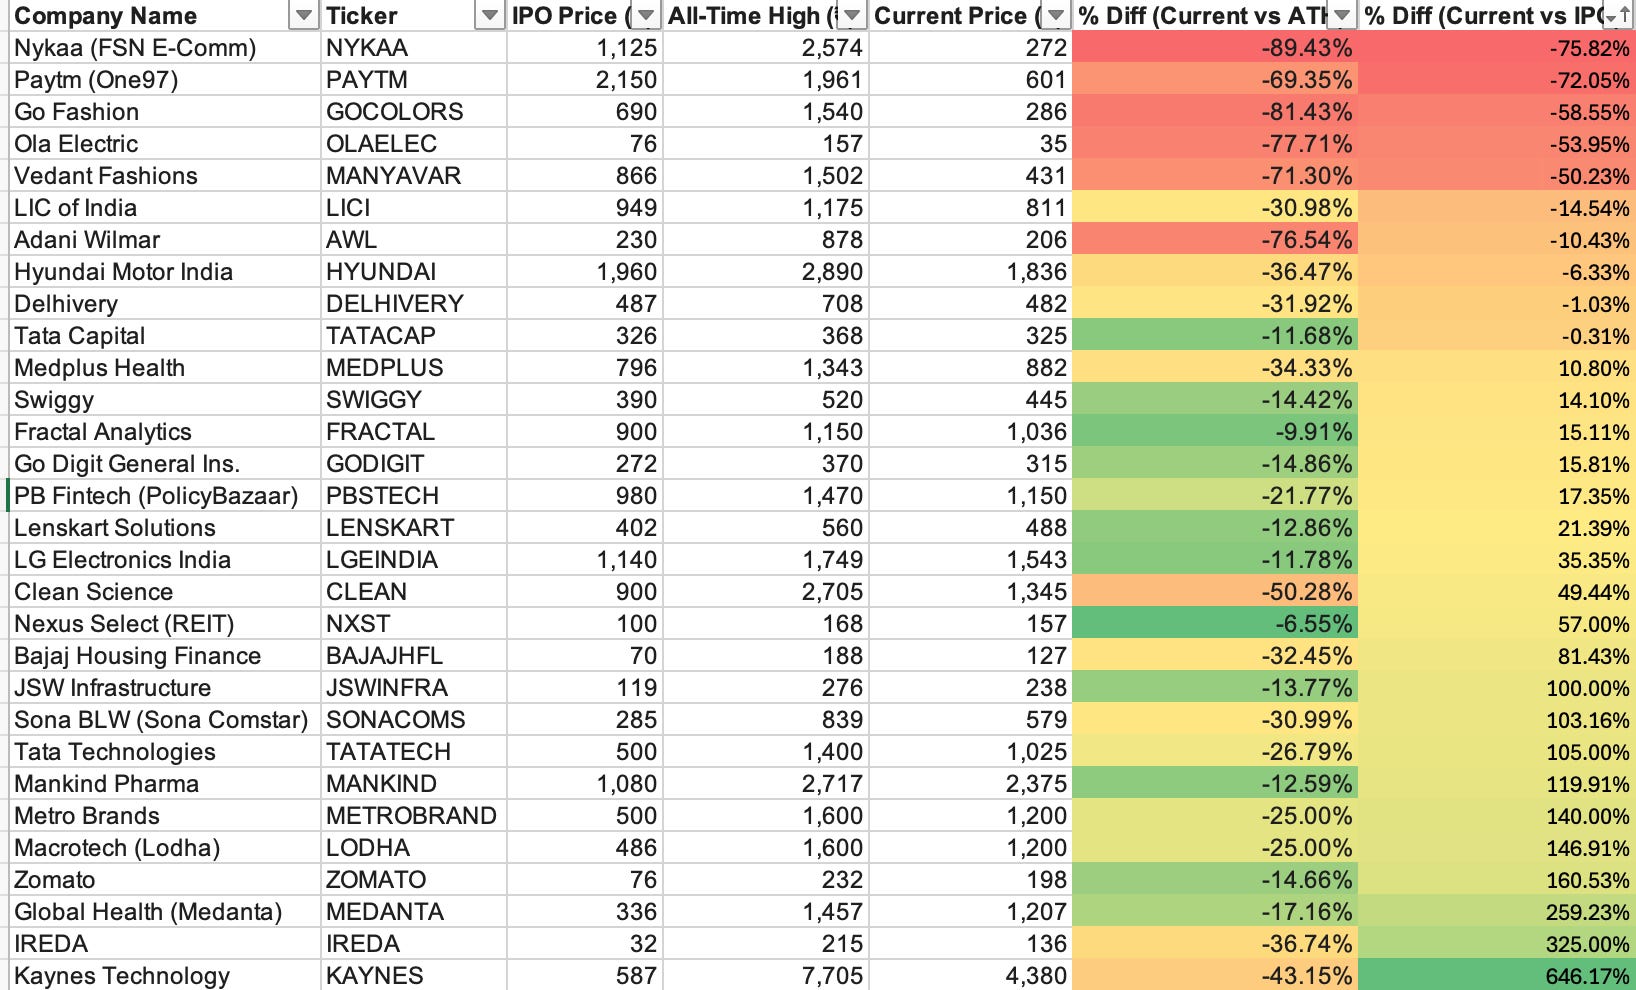
Recently going through all the consumer craze post covid and demand softening after 2024, I went through a simple table:
Thanks for reading! Subscribe for free to receive new posts and support my work.
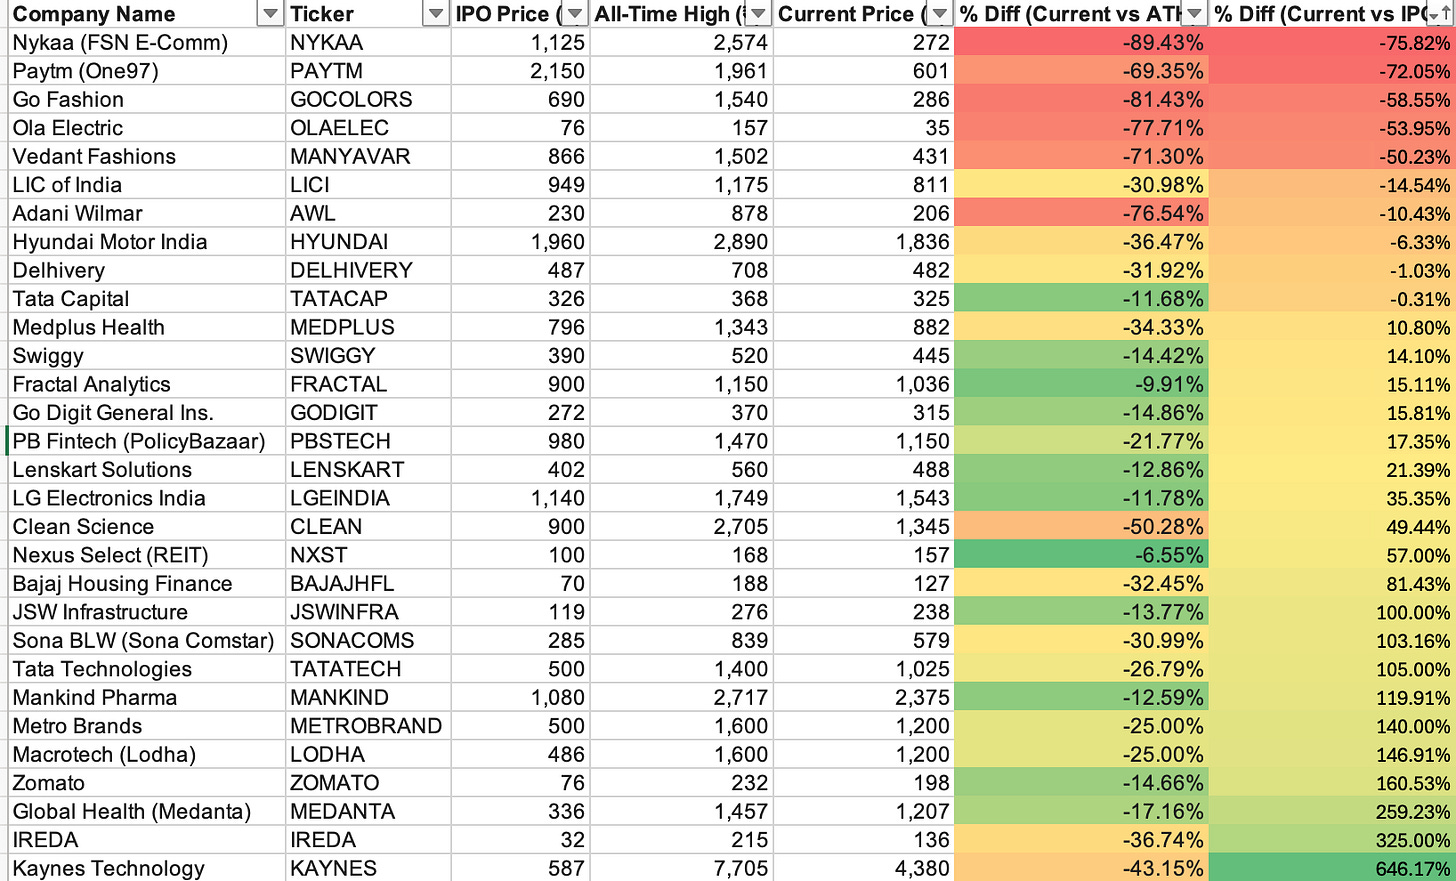
Wait: What I can observe is the Go Fashions, the same company behind the legendary Colors brand. I can also observe Vedant Fashions but for the reasons outside this scope, GoFashion is seemingly lucrative
History
While the common textbook would say that the history started in 2010, the actual history starts with Meridian Apparels Ltd in 1988. Started under the aegis of Prakash Sarogi, it catered to the exports market where they procured the raw material AKA grey fabrics and manufacture it into the finished garments in Tirrupur.
Based out of my hometown and what has been an always fascinating sector for me, operating the factory in the textile sector require huge guts and a very calculated decision making. Why?
-
You always are at the mercy of exporters where they fleece you for the sales price
-
You always have to incur maintenance capex to keep up with the machines
-
Fabric market moves in tandem with cotton yarn spread. What does this mean?
-
It requires around 1.18 kg of cotton to produce 1kg of yarn
-
Yarn prices are determined by global demand, domestic demand etc.
-
While cotton prices are determined by MSP, cotton crop expectation etc.
Why does this matter? This is because operating a garment factory is akin to running a hedge fund. You have to time your fabric procurement when yarn prices are at all time low so that even if global brands fleece you, you have room to breathe. Remember the initial days of Berkshire Hathaway and you will know why the great Warren Buffet exited the unprofitable textile mills and focussed on insurance.
But contrary to popular opinion, this is what makes the textile entrepreneurs resilient. They just don’t look at vanities like Gross Margins% or EBITDA Margins %. They are focussed on inventory days, receivable days, payable days, procurement prices. In short, they try to optimize the working capital cycle so that even if their hedge fund (procurement price) falters, they don’t turn out to be LTCM (Enthusiast people will remember the mania).
I got carried away but the point is that GoColours promoters were extremely disciplined till the time Gautam Sarogi took over in 2010. He learnt the intricacies while remaining on the factory floor (imagine the tin shed with 40 degrees temperature) and ultimately decided to move to the brand side of the business catering to the domestic market.
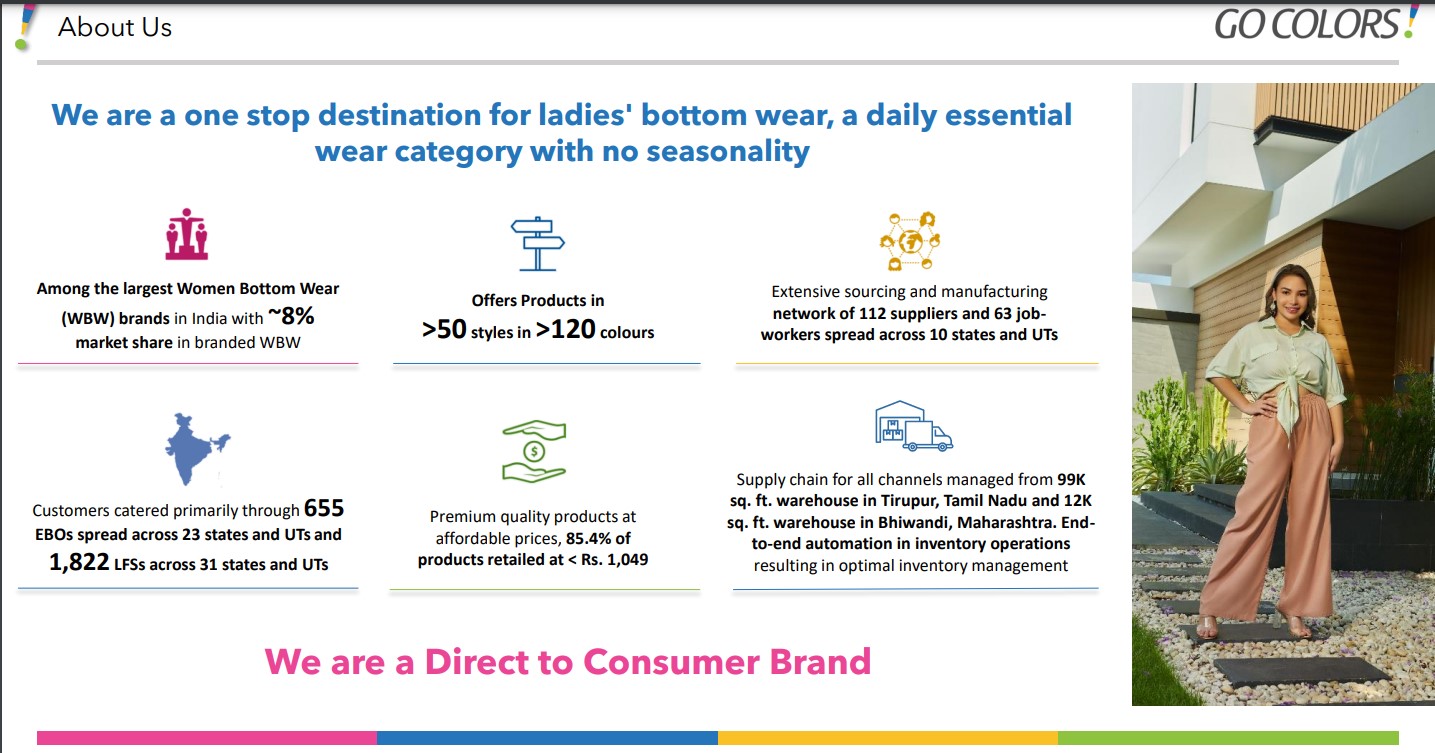
The niche identified was again contrarian, i.e., women’s bottomwear. This is due to the fact that building a brand here is extremely difficult. This is due to the fact that you cannot openly see the brand of leggings. The leggings of a local manufacturer vs a branded player seems identical. But this brave soul had a different insight.
The competition was next to none here. Competing in such a segment with a branded player seemed logical. How to compete with local guys? Make your brand affordable and yet aspirational. This was a secret sauce.
When they started, they launched two products: Churidaars and Leggings. Initially they took MBO route (multi brand outlet) but failed miserably since the customer experience was in the hands of the store owners and distributors. In 2012, they launched a kiosk in Chennai and never looked back.
Business Details
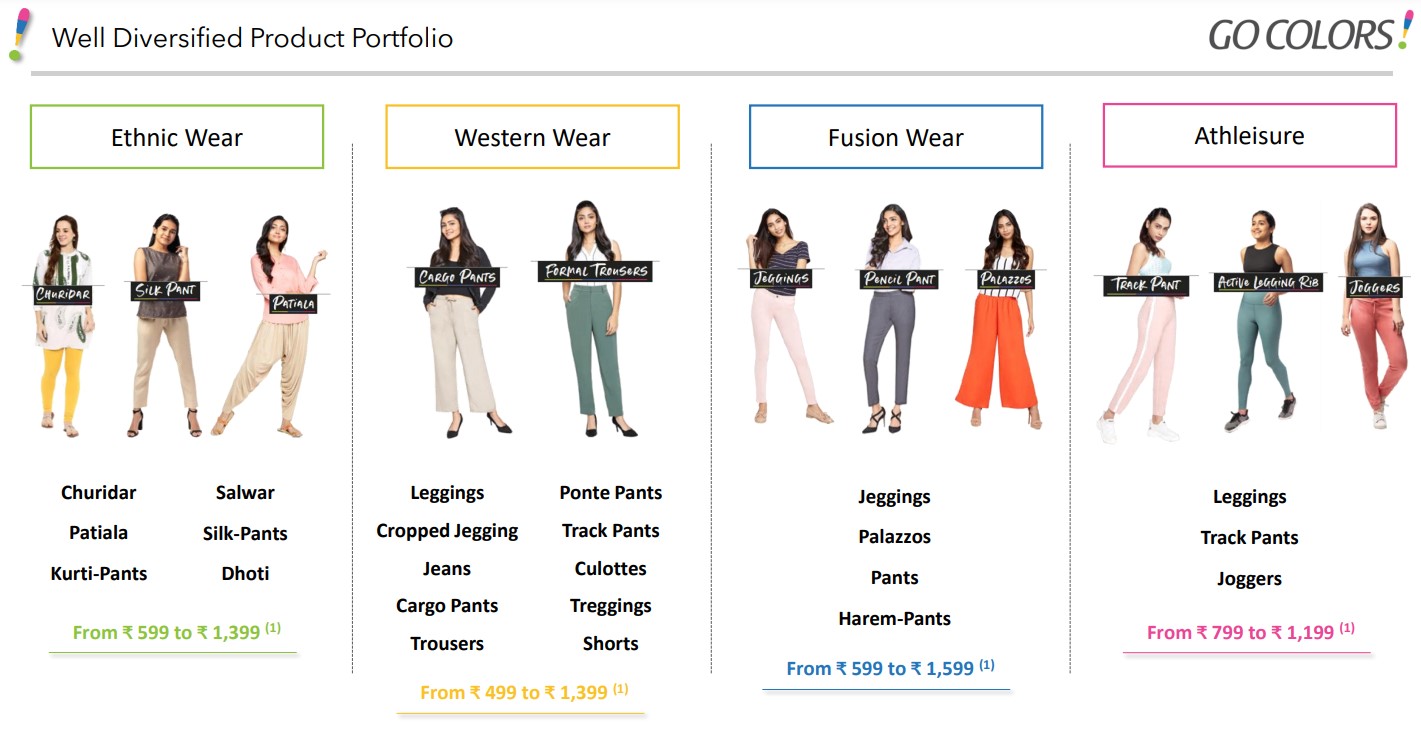
Currently, the catalogue of the company is divided into 2 parts:
-
Core Ethnic Staples: Basic Leggings, Churidars, and Salwars. These are high-loyalty, high-repeat items but have lower price points.
-
Value-Added Products: Includes Trousers, Palazzos, Jeggings, Culottes, Joggers, Cargos, and Denims. These are designed to capture a higher share of the consumer’s wallet and cater to office and festive wear.
The revenue split for these are as follows over the years:
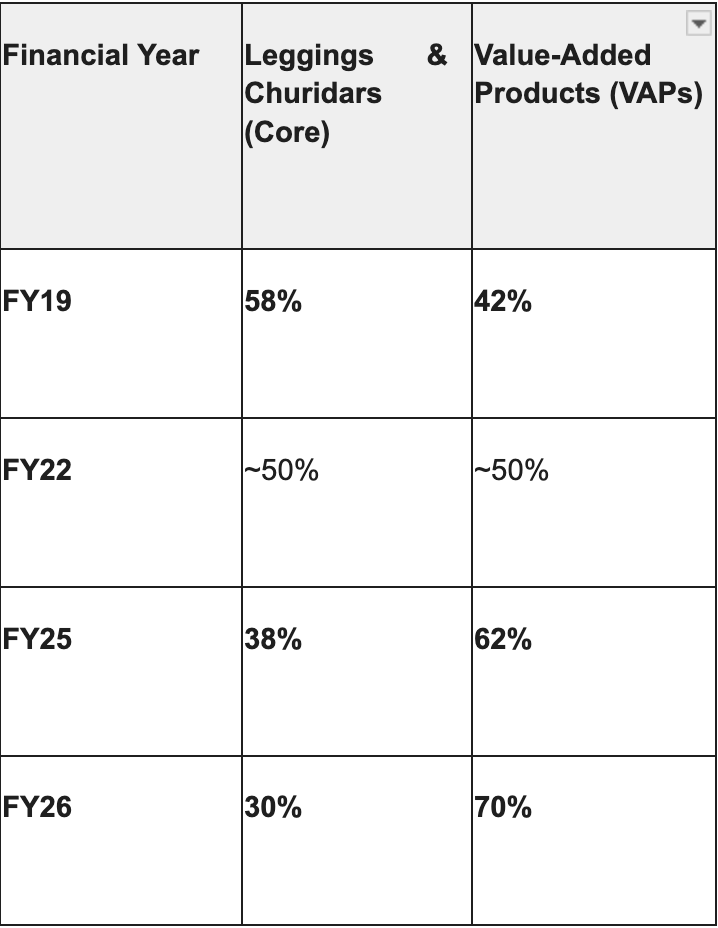
Key Trends in the Split
-
De-risking the Portfolio: Historically, Go Colors was synonymous with leggings. By FY26, the company successfully “de-risked” its business model by ensuring that non-leggings products now contribute nearly 70% of total revenue.
-
The “Pre-COVID” vs. “Post-COVID” Shift: Before the pandemic, the split was heavily skewed (60-70%) toward ethnic staples. Post-COVID, the growth of the Western wear segment (trousers, jeggings, and cargos) and the expansion into larger Exclusive Brand Outlets (EBOs) allowed for better display of these higher-margin products.
-
Margin Impact: Value-added products typically command a higher price point. This shift is a major reason why the company’s gross margins have remained resilient in the 61%–64% range despite inflationary pressures on raw cotton.
-
ASP Growth: The gradual reduction in the revenue share of churidars (the lowest ASP product) in favor of western trousers and cargos has pushed the blended ASP from ₹727 in FY23 to ₹811 in FY26
The company sells their wares primarily through 3 channels:
-
EBO: Exclusive Brand Outlets majorly (>90%) owned by the company and operated by the company
-
LFS: Large Format Stores namely Reliance Trends, Shopper Stop etc.
-
MBO: Multi Brand Outlets say the outlets we find in Lajpat market owned by local entrepreneurs
-
E-Commerce: Own Website
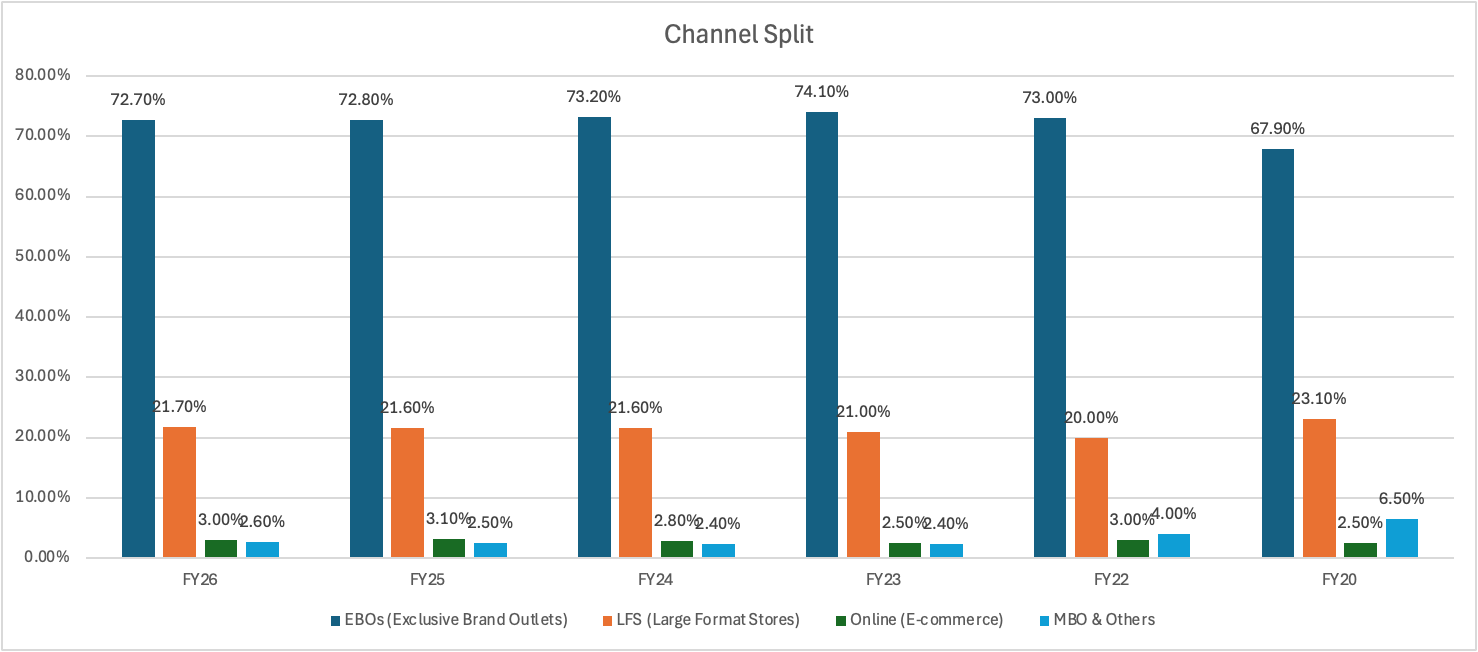
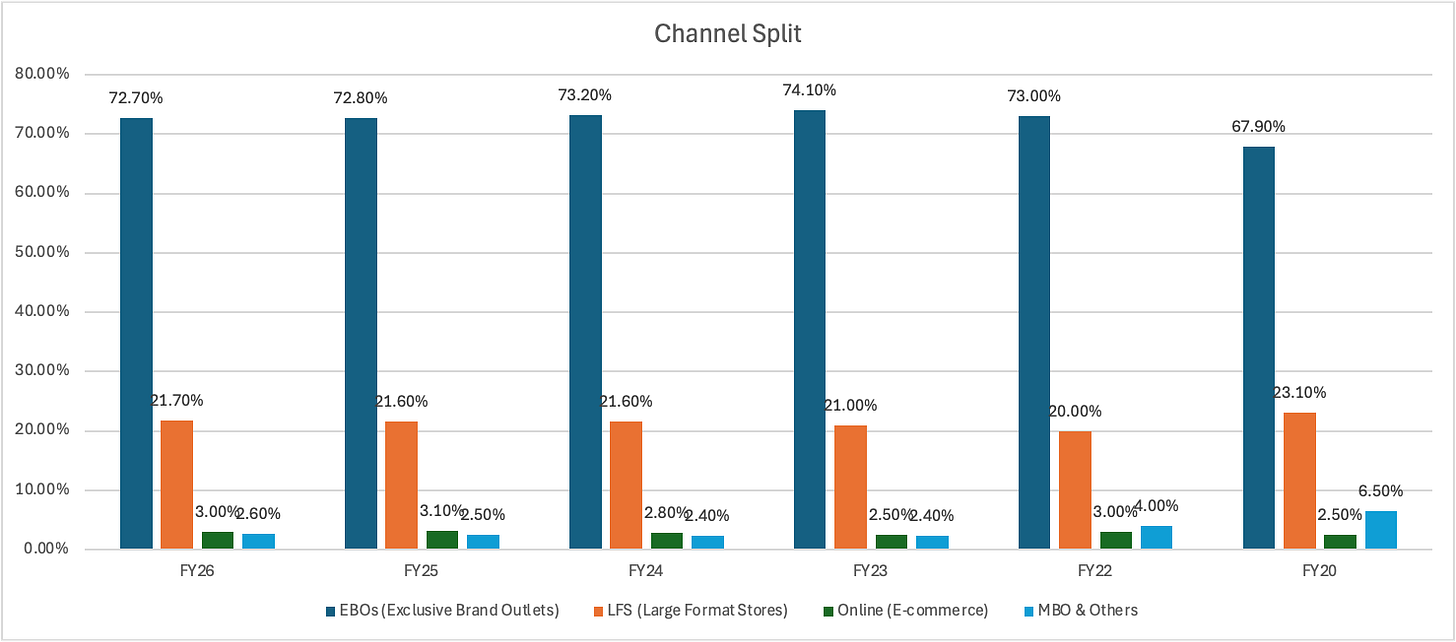
The split of revenue across the channel is as follows:
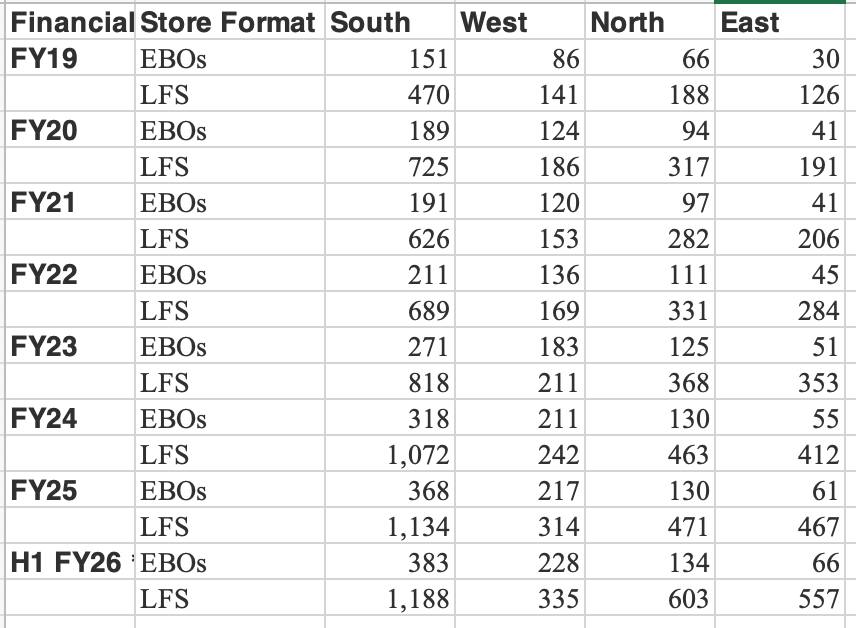
This is how the store numbers stack up across different regions:

Key Trends in the Channel:
-
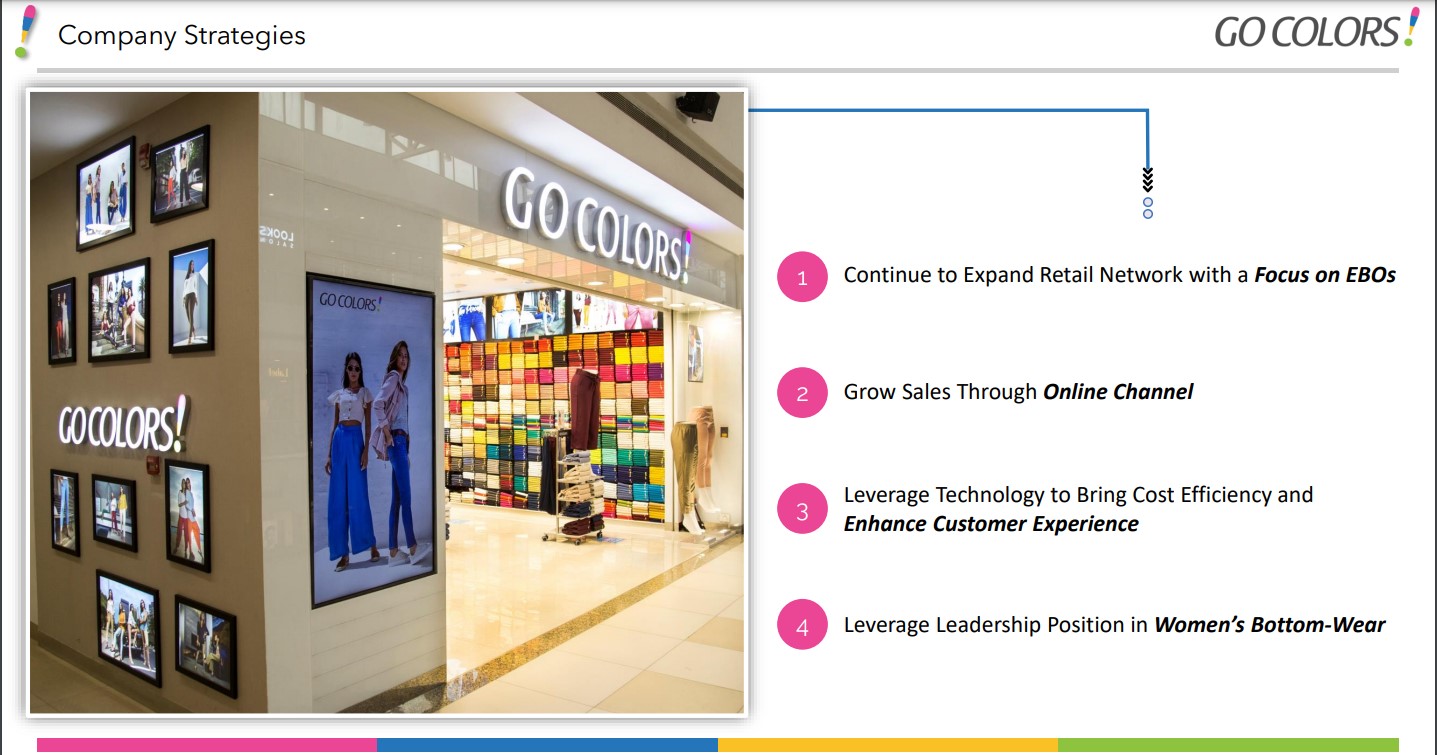
Dominance of EBOs: The company has shifted from roughly 68% EBO contribution in FY20 to a steady 73% in recent years. This is part of a deliberate strategy to control the brand experience and maximize profitability. As of FY26, the company operates over 802 EBOs across India.
-
The LFS Partnership: Large Format Stores (like Reliance Trends, Pantaloons, and Shoppers Stop) consistently contribute about 21–22% of revenue. While this channel offers lower operating margins than EBOs, it provides high volume and serves as a critical customer acquisition funnel.
-
The “Online” Stability: Despite the massive boom in e-commerce, Go Fashion’s online revenue (via their own website and marketplaces like Myntra/Amazon) has remained relatively stable at around 3%. This is largely because their product—women’s bottom-wear—often requires a “touch and feel” or “trial” experience to ensure fit, which favors physical retail.
-
Decline in MBOs: The share of Multi-Brand Outlets (MBOs) and other smaller distribution channels has halved since FY20 (from 6.5% to ~2.6%). The company has deprioritized this channel in favor of its own branded stores to better manage inventory and reduce discounting
Financials
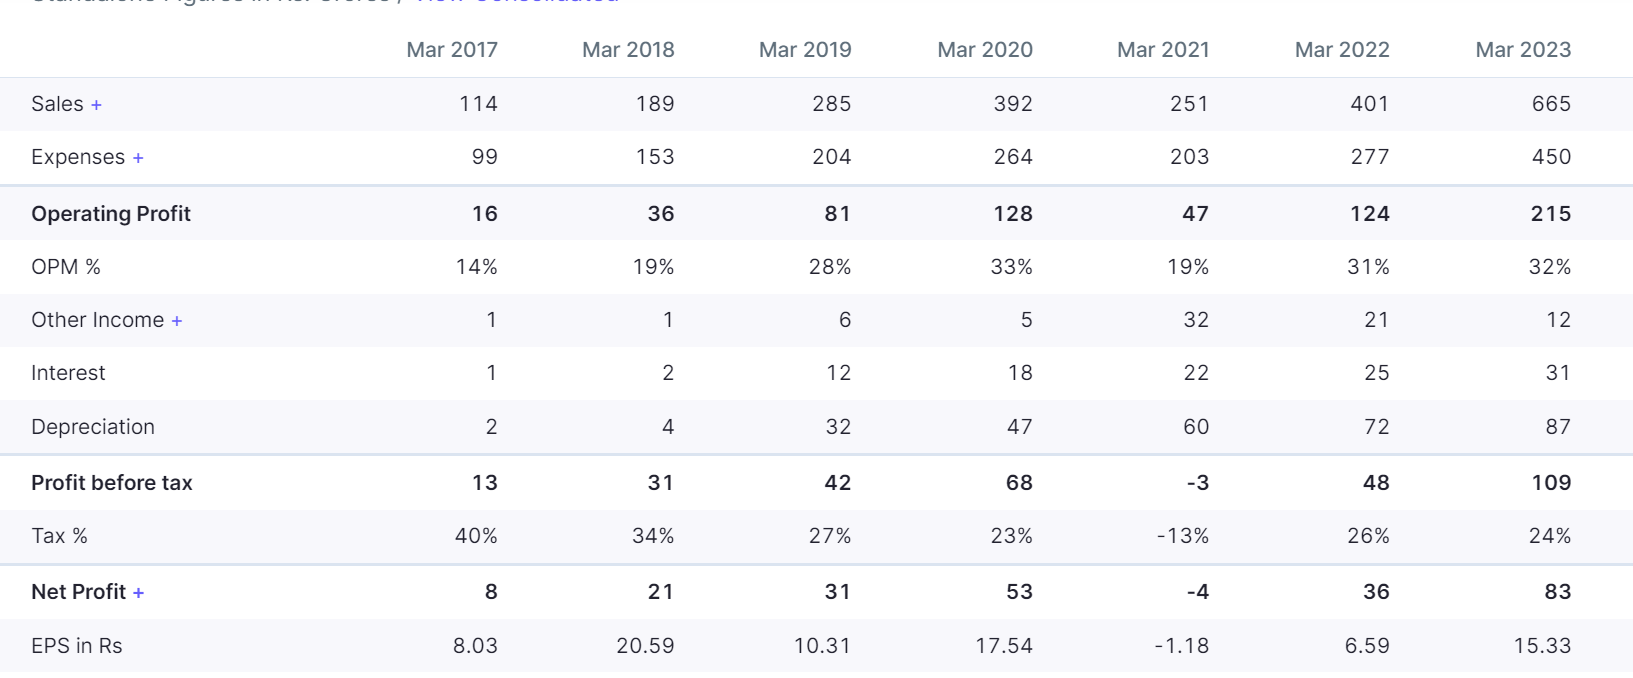
To look at the sales, EBITDA and PAT, following is the profile:
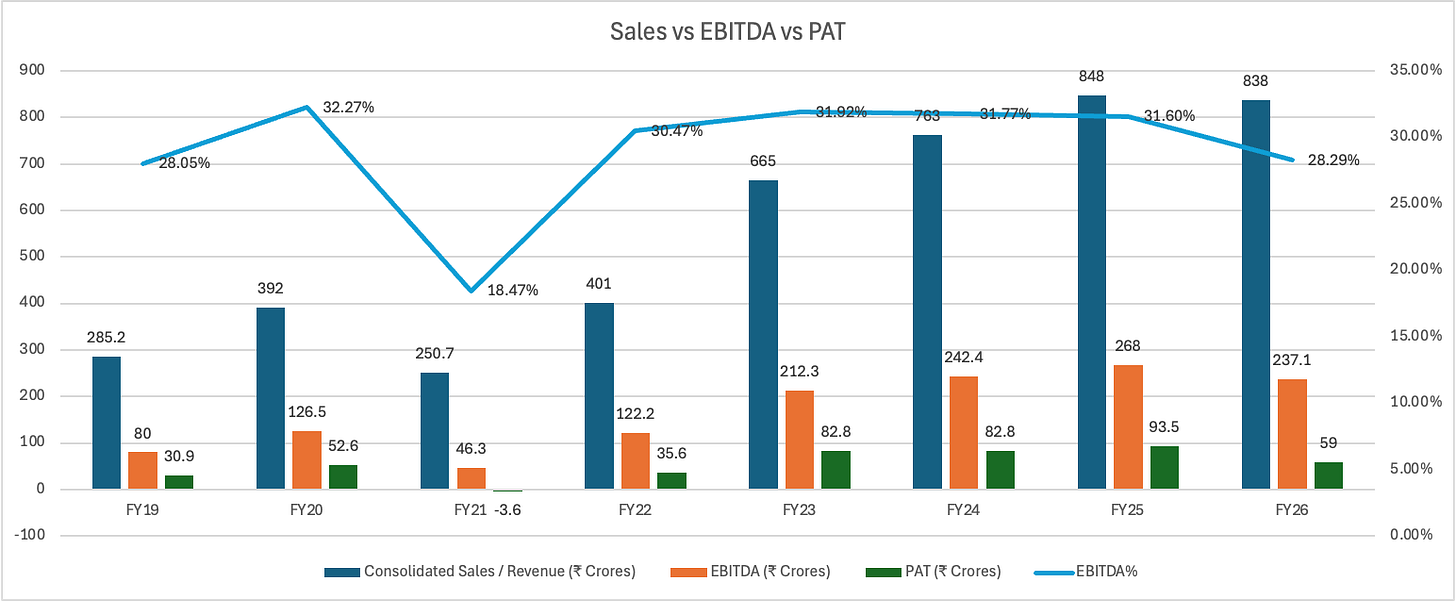
Sales have grown at the CAGR of 27% and the profits have grown at the CAGR of 70% in the past 5 years. EBITDA margin is stable at 28%-31%. These numbers look extraordinary from the perspective of asset churning. Why is it happening?
Imagine you are a business owner with a sub 300 sqft store and an assortment which does not require a wholesome display. This assortment is highly repetitive and affordable. What do you get? If you position yourself as aspirational, you get out of the mind asset turn per store.
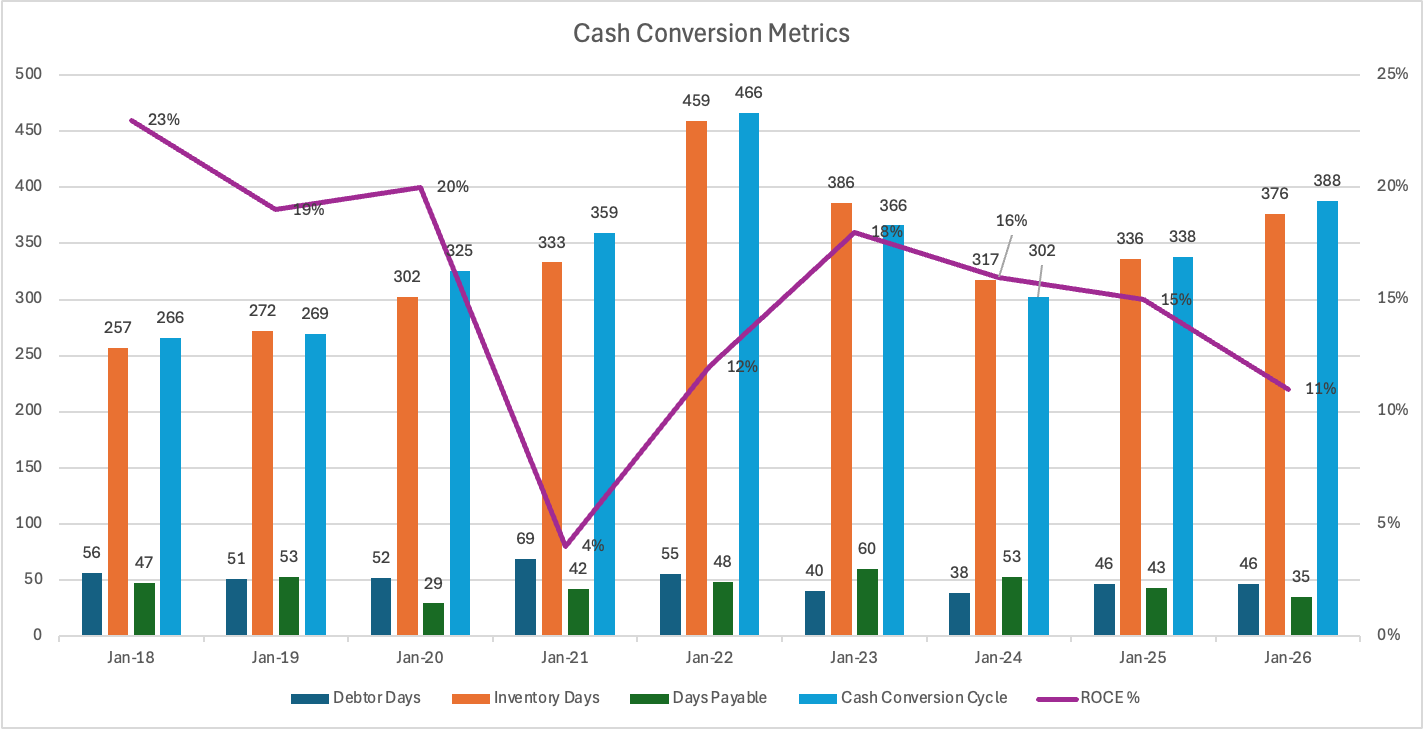
Working capital efficiency is as follows:

Currently the inventory days are high. This is really strategic because of the following value chain:
Here is the full value chain of Go Fashion:
-
Product Design and Development:
-
Data-Driven Approach: The company uses a research-led and data-centric design process, utilizing business intelligence reports generated by their internal ERP system and direct customer feedback to plan product launches.
-
In-House Teams: Go Fashion relies on its dedicated in-house design and merchandising teams to create products. To maintain focus, they have even separated the design teams for their core bottom wear and their newer “pilot” everyday-wear categories.
-
Raw Material Sourcing:
-
Direct Procurement: Rather than buying finished garments, Go Fashion procures its own raw materials, including yarn, dyed fabrics, printed/processed fabrics, and trim materials.
-
Supplier Relationships: They source from a wide base of suppliers (mills and weavers) across India. To maintain consistency in quality and ensure timely delivery, the company increasingly purchases directly from mills by blocking a significant portion of their yearly production capacity. They generally do not sign long-term agreements, preferring to issue purchase orders based on seasonal requirements.
-
Outsourced Manufacturing & Quality Control
-
Asset-Light Conversion: The company does not own manufacturing facilities. Instead, it supplies the procured raw materials (including logos and trims) to a vast network of sub-contractors and job workers spread across multiple states. These job workers are responsible for cutting, stitching, and converting the fabric into finished garments.
-
Strict Quality Assurance (QA): To protect the integrity of the brand despite the outsourced model, Go Fashion employs an in-house QA team. This team conducts rigorous periodic inspections of both the raw fabrics at supplier mills and the finished garments at job-worker units.
-
Supply Chain, Warehousing, and Logistics
-
Centralized Warehousing: The company manages its entire inventory and logistics centrally, primarily from a large 99,100 square foot warehouse in Tirupur, Tamil Nadu, supported by an additional facility in Bhiwandi, Maharashtra.
-
Technological Automation: The warehouses and procurement systems are heavily integrated with an ERP system and Supply Chain Management Systems (SCMS). This end-to-end automation allows the company to optimize inventory levels, handle complex SKU mixes, and minimize stock-outs across all channels.
-
Logistics: The company relies on third-party logistics companies and freight forwarders to transport raw materials and deliver finished goods by road.
-
Multi-Channel Retail and Distribution:
-
Exclusive Brand Outlets (EBOs): This is the company’s primary direct-to-consumer channel (driving over 70% of revenue). The company owns and directly manages these stores, ensuring complete control over the customer experience, inventory, and visual merchandising.
-
Large Format Stores (LFS): Go Fashion operates shop-in-shop formats within major retail chains like Reliance, Lifestyle, Pantaloons, and Spencer.
-
Online & E-commerce: The company sells through its own website and online marketplaces, utilizing a pure-play dropship model where marketplace orders are shipped directly from Go Fashion’s inventory. They are also building omni-channel capabilities, such as fulfilling online orders from nearby physical stores.
-
Multi-Brand Outlets (MBOs): They selectively distribute products to modern trade and family-run stores to tap into unorganized market pockets.
-
Sales and Marketing:
-
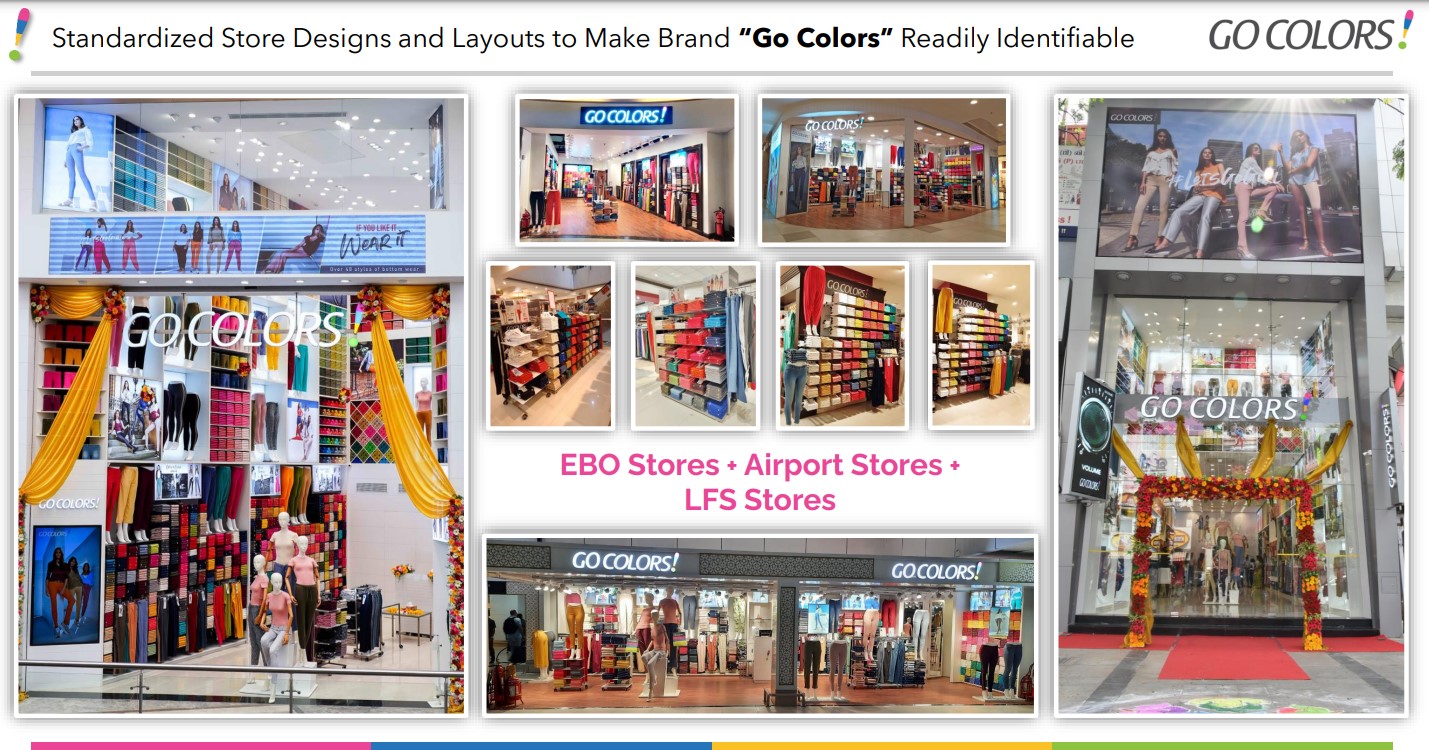
Stores as Billboards: Go Fashion strategically uses its EBOs as its primary advertising medium. By ensuring standardized, highly visible store designs across high streets and malls, they minimize transmission loss in brand spending.
-
Digital Engagement: The company utilizes social media platforms, influencer collaborations, and WhatsApp catalogs to push new product information and drive both new and repeat footfall to their store
The company has deliberately kept the manufacturing outsourced to reduce its asset risk. However with outsourced manufacturing comes higher inventory at centralized warehouse and that is what you saw with high inventory days.
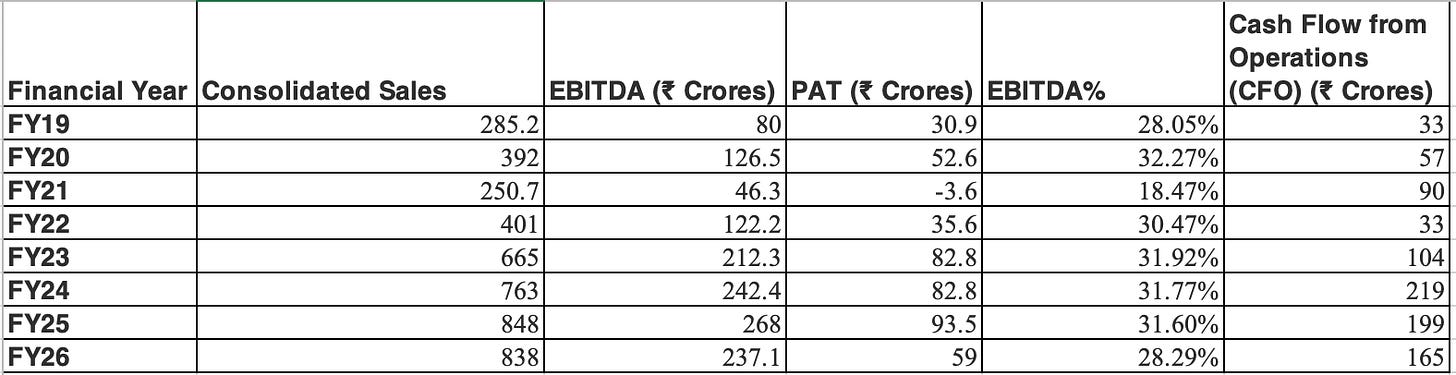
In the last 6 years, they have posted a cumulated EBITDA of 1335 crores, PAT of 435 crores and cash flow from operations of 900 crores which indicates decent cash conversions.
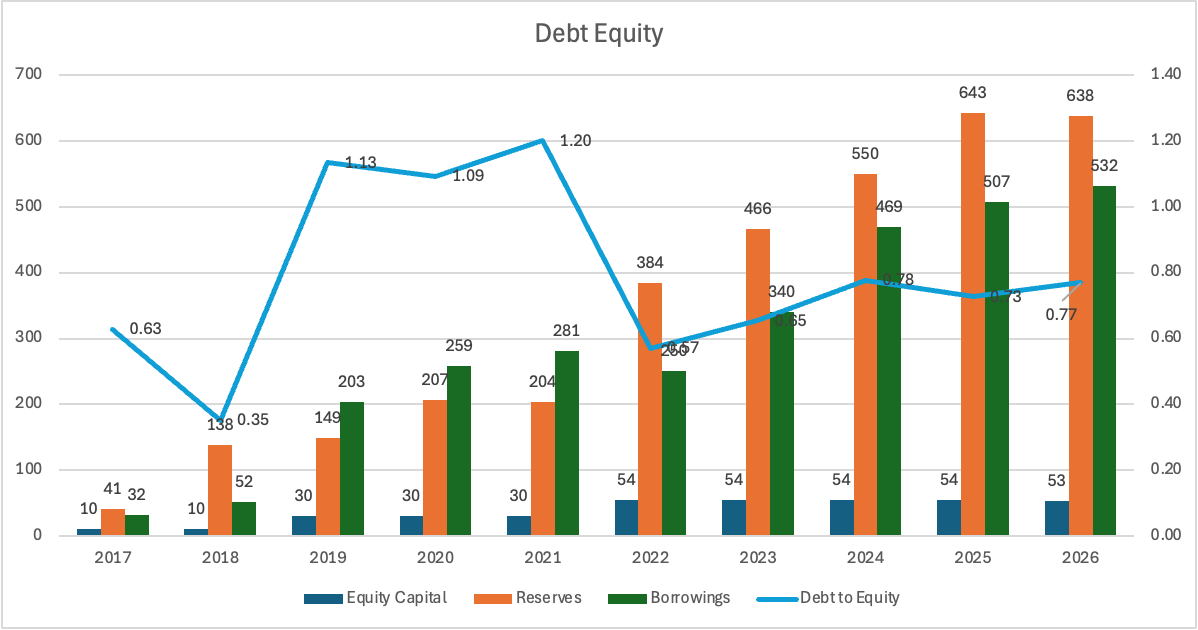
What about Balance Sheet?
This might be the soaring point for those looking at screeners. Here is what it looks like:

Debt equity of 0.77 is criminal. But wait until you see the fine print: the lease liabilities are included in borrowings.
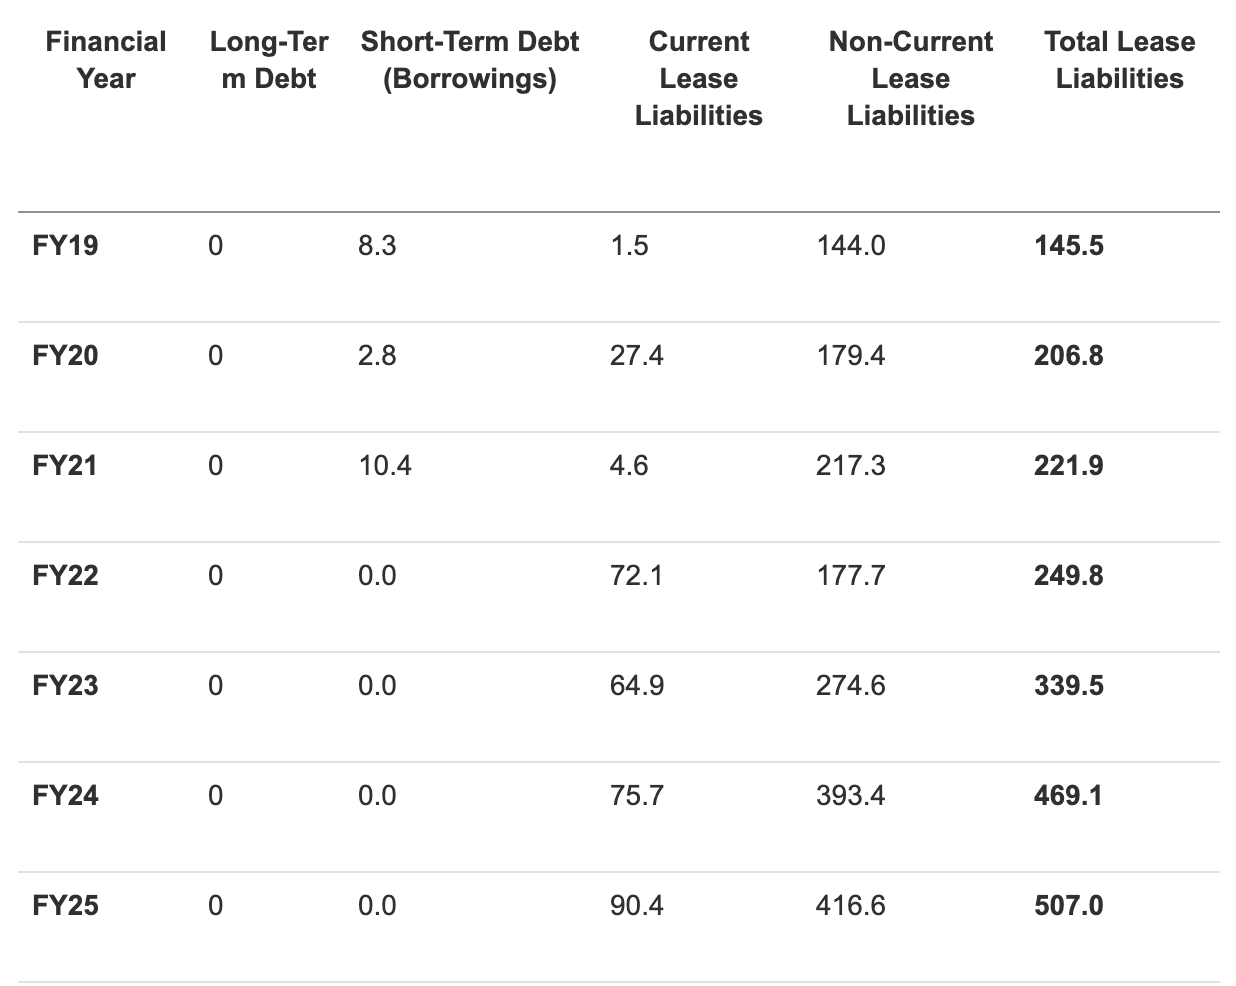
Now why does this matter? For a retail-heavy company like Go Fashion (India) Ltd., which operates over 800 Exclusive Brand Outlets (EBOs) on lease, the accounting for lease liabilities is one of the most significant line items in their financial statements.
Since April 1, 2019, Go Fashion has followed Ind AS 116, the Indian accounting standard for leases. Here is the breakdown of how they treat these liabilities and how it impacts their reported numbers.
- The Balance Sheet Treatment
Under Ind AS 116, Go Fashion does not record “Rent Expense” for its store leases. Instead, they recognize:
-
Right-of-Use (ROU) Asset: This represents the company’s right to use the store premises for the lease term. It is recorded at the present value of all future fixed lease payments.
-
Lease Liability: This represents the obligation to make those lease payments. It is calculated by discounting future payments using an Incremental Borrowing Rate (IBR).
-
The Income Statement (P&L) Impact
The traditional “Rent” line item is essentially deleted from the P&L (for fixed leases) and replaced by two different costs:
-
Depreciation: The ROU asset is depreciated over the lease term (usually on a straight-line basis).
-
Finance Cost (Interest): Interest is charged on the outstanding lease liability. This interest is higher in the early years of a lease and decreases as the liability is paid down.
This results in higher EBITDA. PAT appears lower in the initial years while it optically appears higher in final years.
The larger point is that balance sheet appears highly indebted which is actual an optical metric
Where did the engine falter?
In short the answer is Covid. It was not just a lockdown. It was a generational event which bought a profound change in consumer behavior.
Consumers adapted digitally, started demanding more experiences, concert industry boomed, health and fitness went berserk and so on.
Wait!! How does it relate to Go Fashion? Remember their whole success story?? It was hinged on small stores with catalogues which does not require huge displays along with affordable price. It faltered because consumers started demanding “experience stores”
In short, consumers got bored with small stores. The company got bored of the niche catalogue and tried expanding into VAP (plazzos etc.). And what happened was the company realized, they need to have larger stores with more displays to bring more catalogue in front of the consumer and providing a good experience.
Again bringing this chart:
And you can see why ROCE (holy grail) went from 20% to 10%-11%. The company is undergoing transition where it is shutting small stores and opening up large (upto 900 sqft) stores to build experience and display catalogues.
Time to transition is divided into 2 parts:
-
Opening up of larger stores
-
Shutting down the smaller stores to prevent cannibalization
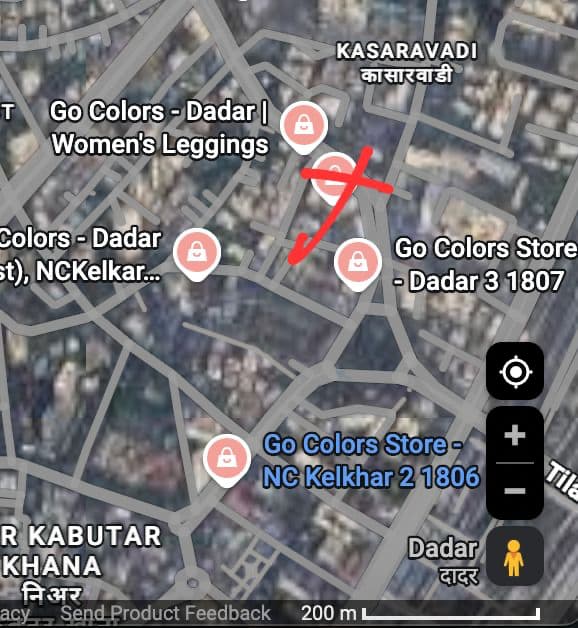
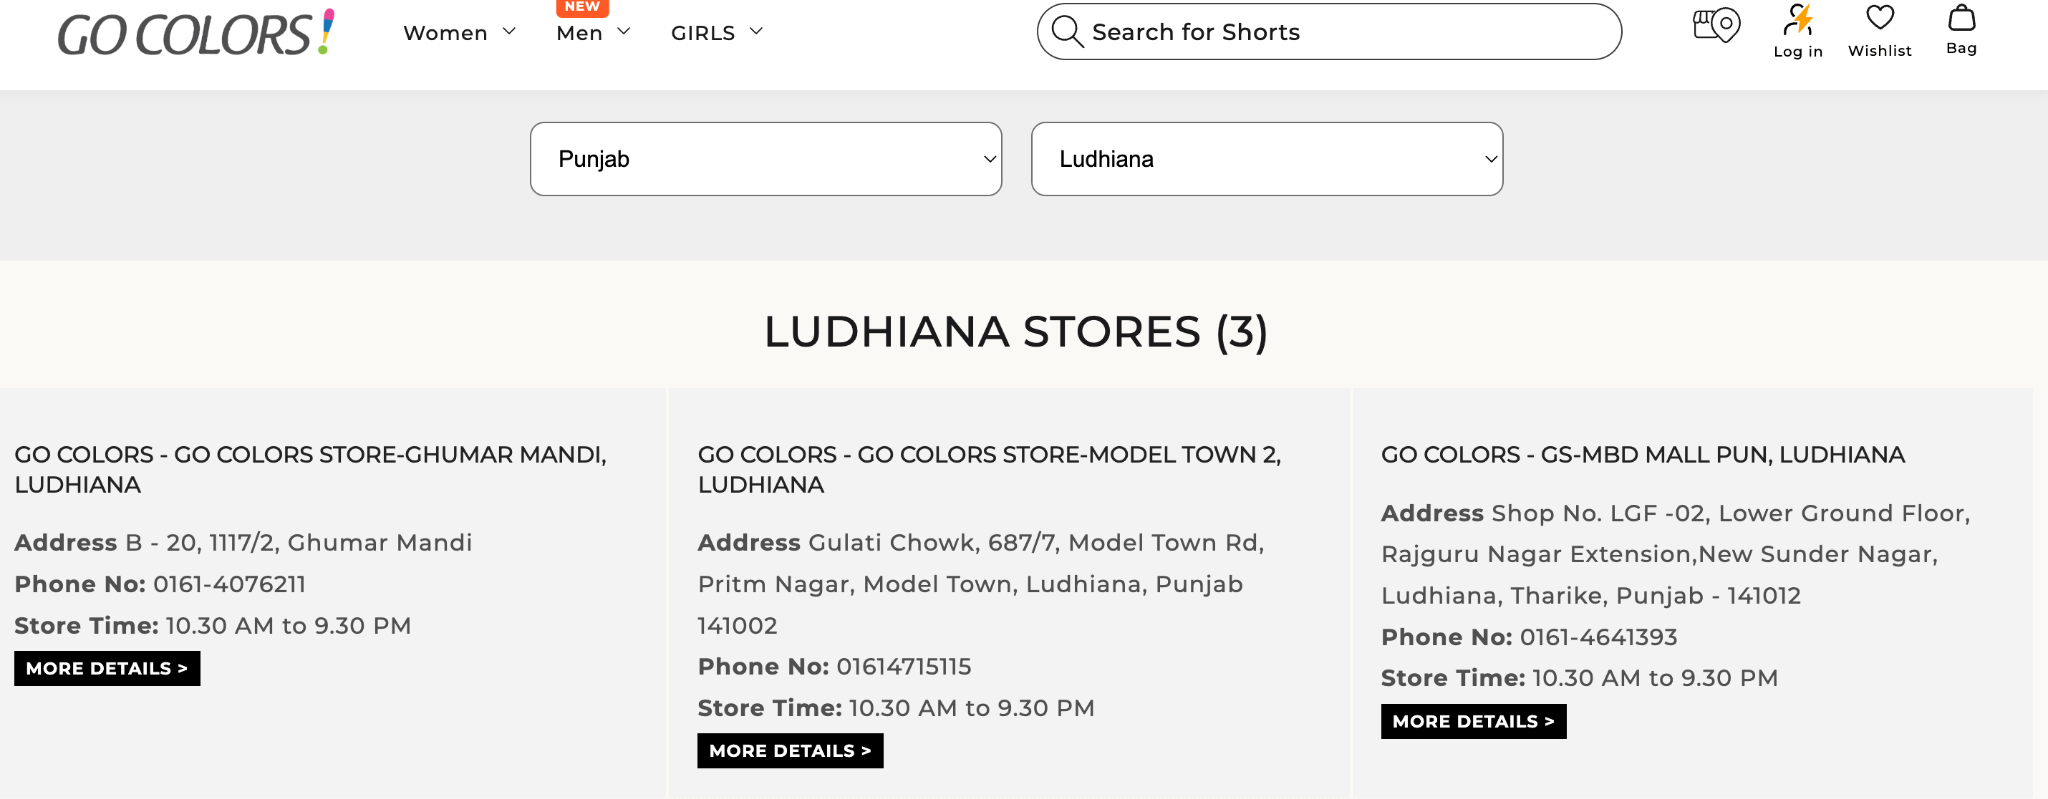
Giving a snapshot here
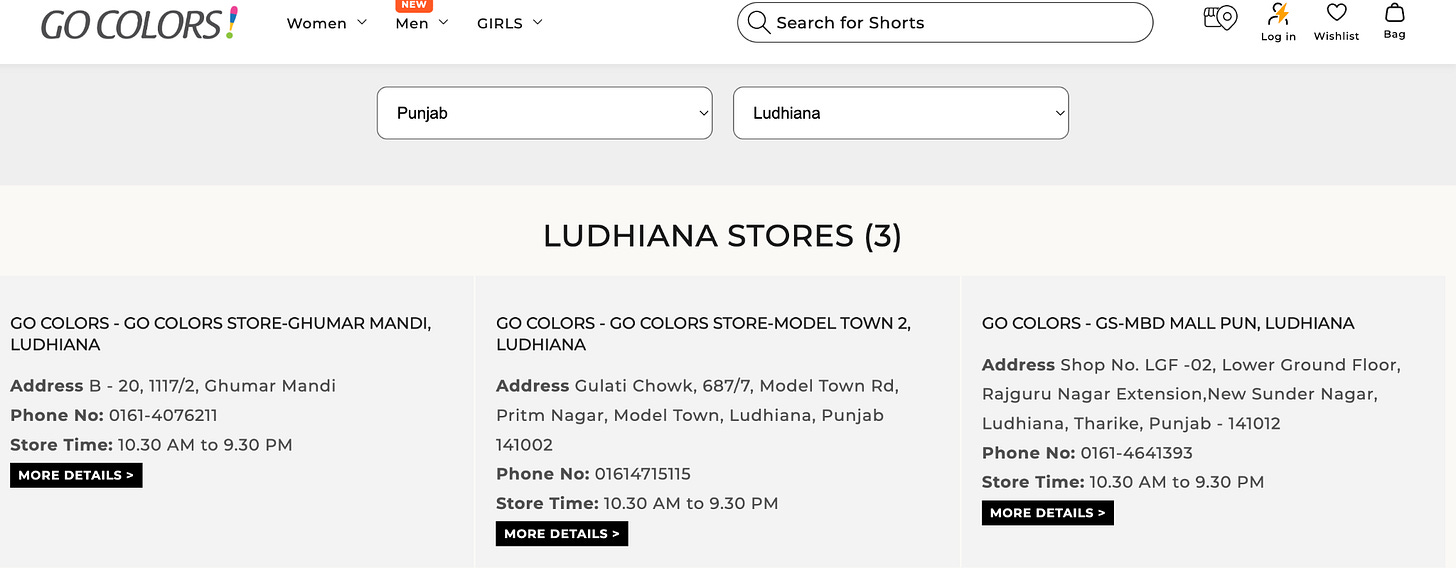
There are 3 stores in 8 km vicinity. It makes sense currently since these are small formats. Once experiential store comes into play, they have to shut down the smaller stores to play operating leverage
What are the chinks in the armour?
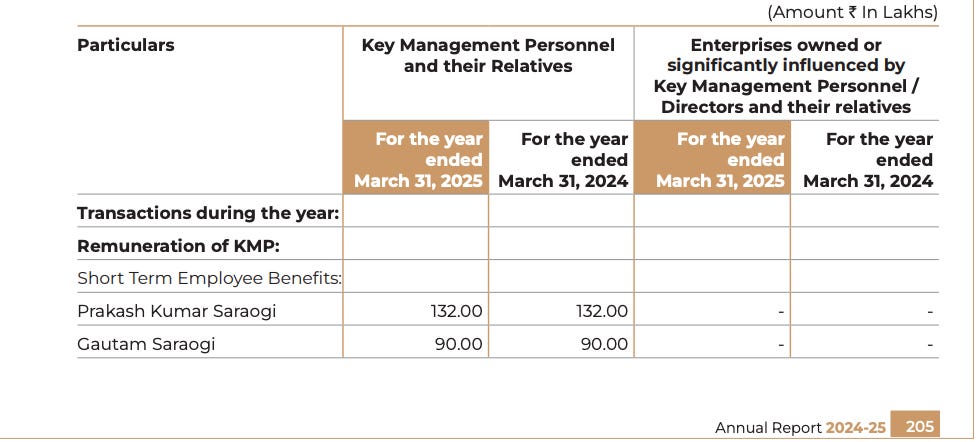
The best part is that there are minimal related party transactions. The remunerations is minimal:
-
Mr Prakash takes home 1.32 cr annually
-
Gautam takes 90 lacs annually
-
Mohan R (CFO) takes 1.68 cr annually
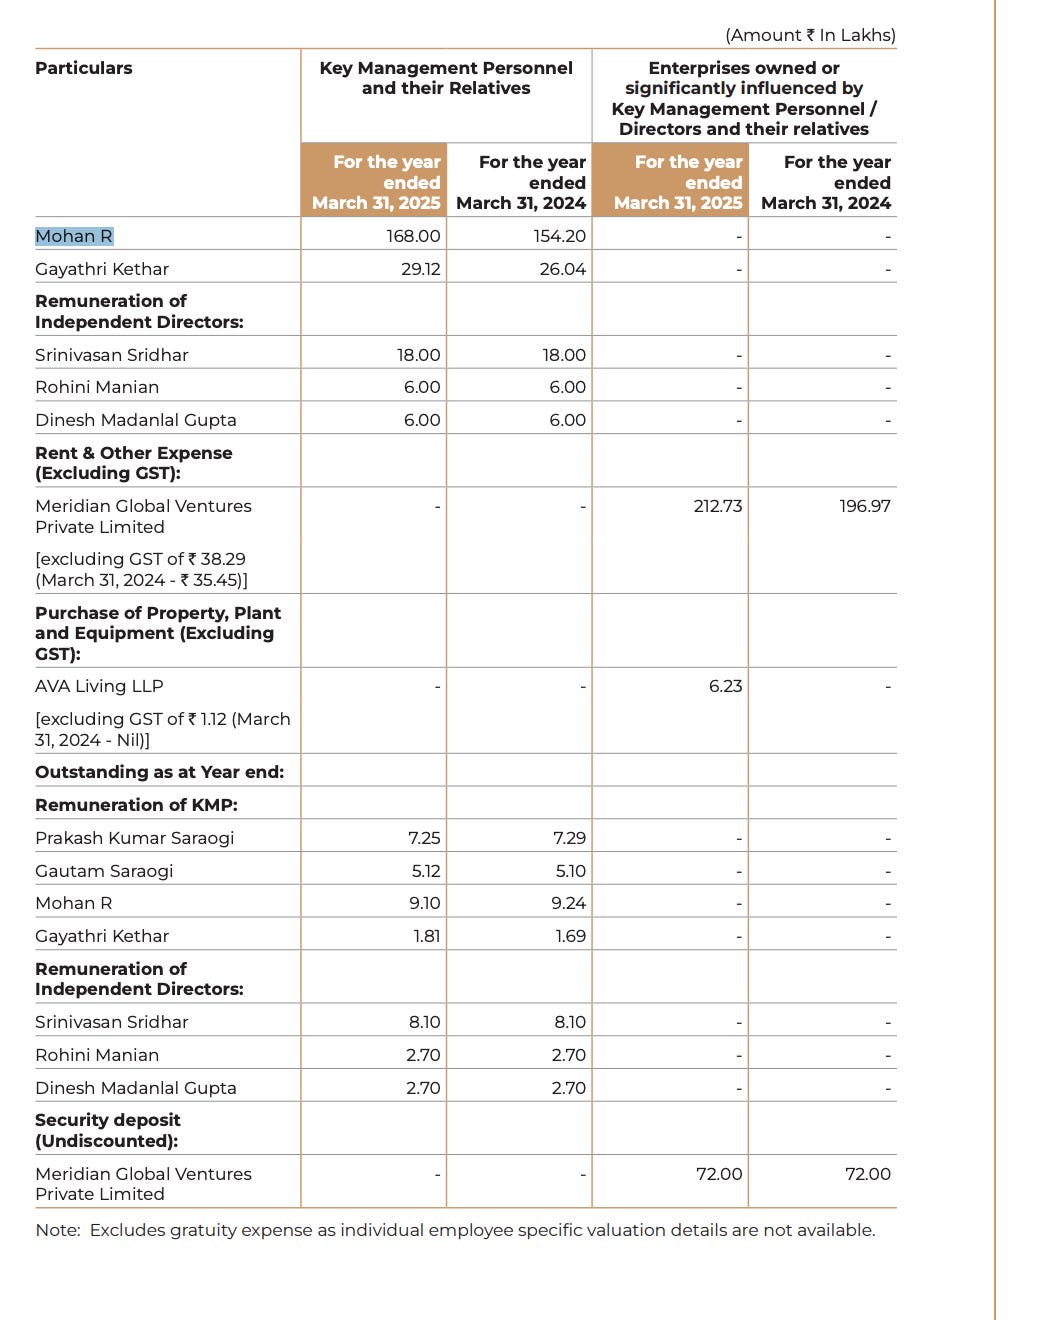

How many companies have such a remuneration structure? I will say barely.
However there are still two issues:
-
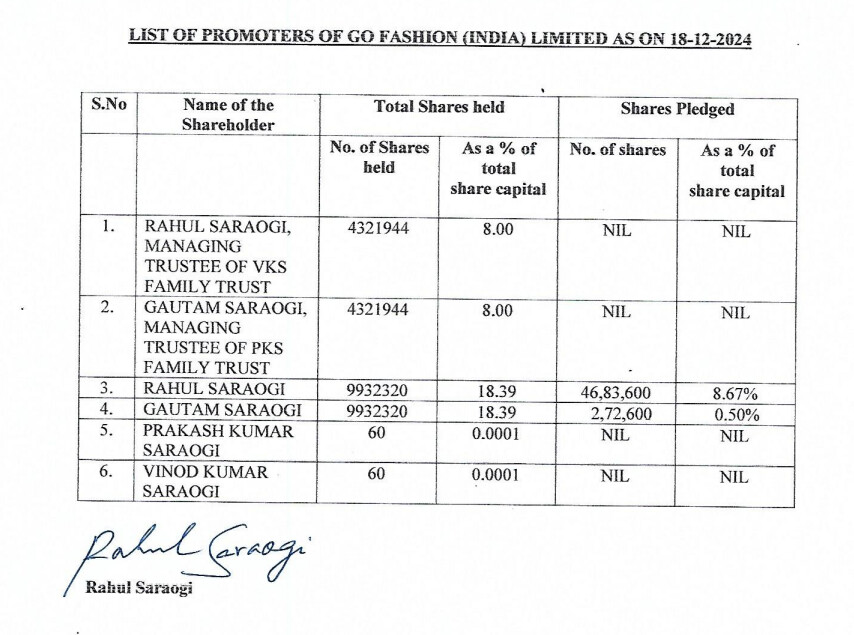
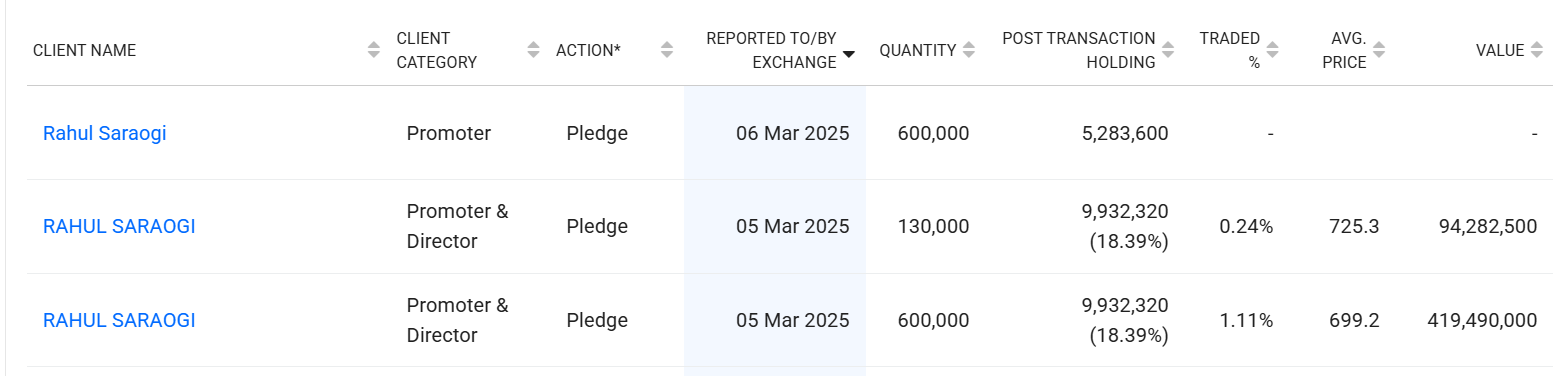
Pledging of shares: Currently promoters are having ~24.5% share pledged. In the concalls, they have been wobbly about removing the pledge:
-
May 2023: When asked for a timeline, management stated definitively, “we will be closing the pledge completely before next 31st March. It will be completely finished”
-
February 2024: An analyst pointed out they were one month away from the March deadline. Management backtracked, stating it would be “delayed by a few more months”
-
July 2024: When asked for an update, management shifted the goalpost again, stating they were “looking to clear the pledge between the window of August and December”.
-
October 2024: When pressed on the missed deadlines, management refused to give a new timeline, admitting, “every time I have given a timeline in the past, we have not met the timeline. So, for me, giving a timeline right now is very difficult”.
-
January/February 2025: An analyst noted that contrary to promises of reduction, the pledge had actually increased. Management admitted to increasing the pledge due to an “urgent requirement within the family” and continued to state they were “not having timelines in my hand” to clear it
-
Mathematical Discrepancies and Dodging Hard Data Requests Whenever analysts ask granular, math-based questions that reveal inconsistencies in management’s narrative, management habitually deflects by claiming they “don’t have the data handy” and will answer “offline”.
-
Price Hike Discrepancies: In August 2022, an analyst pointed out that a 30% value SSSG and a 16% volume SSSG implied a 14% price hike, but the Average Selling Price (ASP) had actually jumped 28% (from ₹559 to ₹718). Unable to reconcile their own numbers, management deflected: “we will have to check on that and come back to you… probably through SGA”.
-
Capex Mismatches: When an analyst calculated that a ₹28 crore CapEx for 60 stores implied a cost that was too high for their unit economics, management evaded answering: “We’ll have to check on this and come back… I’m not having that number handy”.
-
Refusal to Share Store Size Data: In January 2026, management blamed negative sales growth on their “smaller stores” underperforming. When an analyst asked to quantify the decline in these smaller stores to verify the claim, management refused, claiming they were still “calibrating the data”. The analyst pushed back, noting management must have some data to make the claim in the first place, but management continued to dodge the question.
Now what can go wrong??
-
In the world of fast fashion and D2C phenomena, they have expanded the catalog to everyone (men, women) & everything (bottomwear and topwear). How would they compete with the likes of Rare Rabbits, Andamens, Libas’s of the world?
-
Although the management has clarified that inventory numbers won’t increase with the increase in store size, I doubt the same since the new catalog requires a huge inventory for display
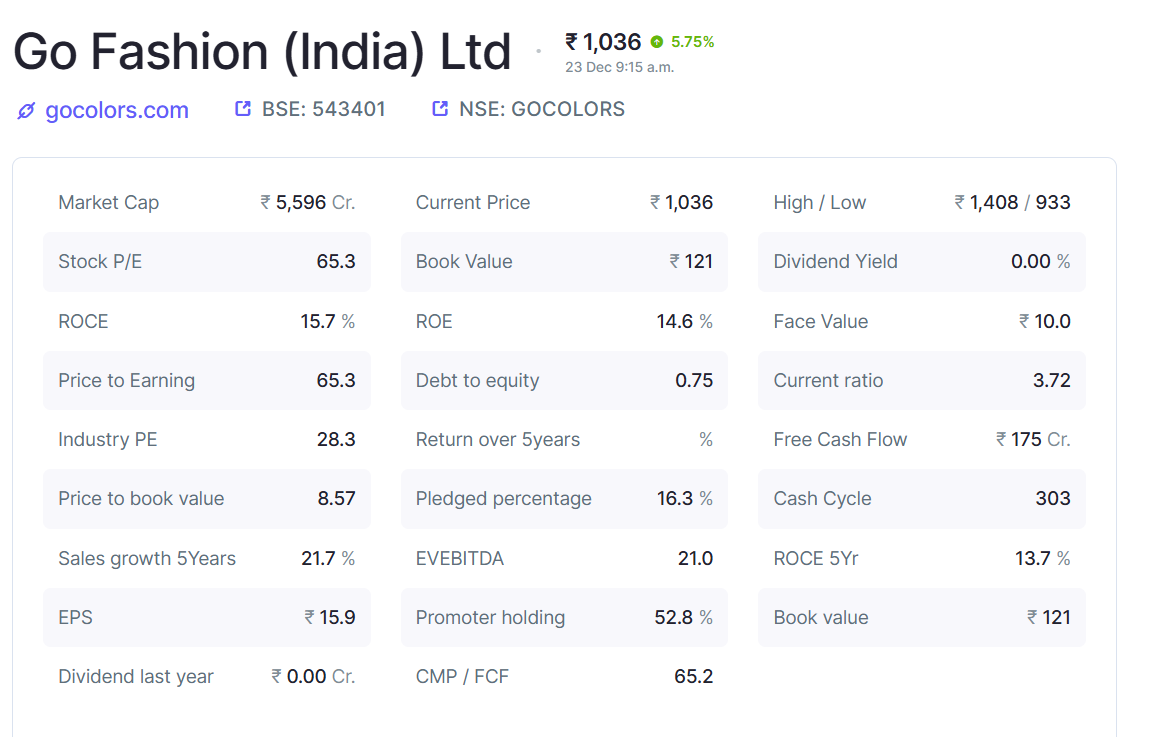
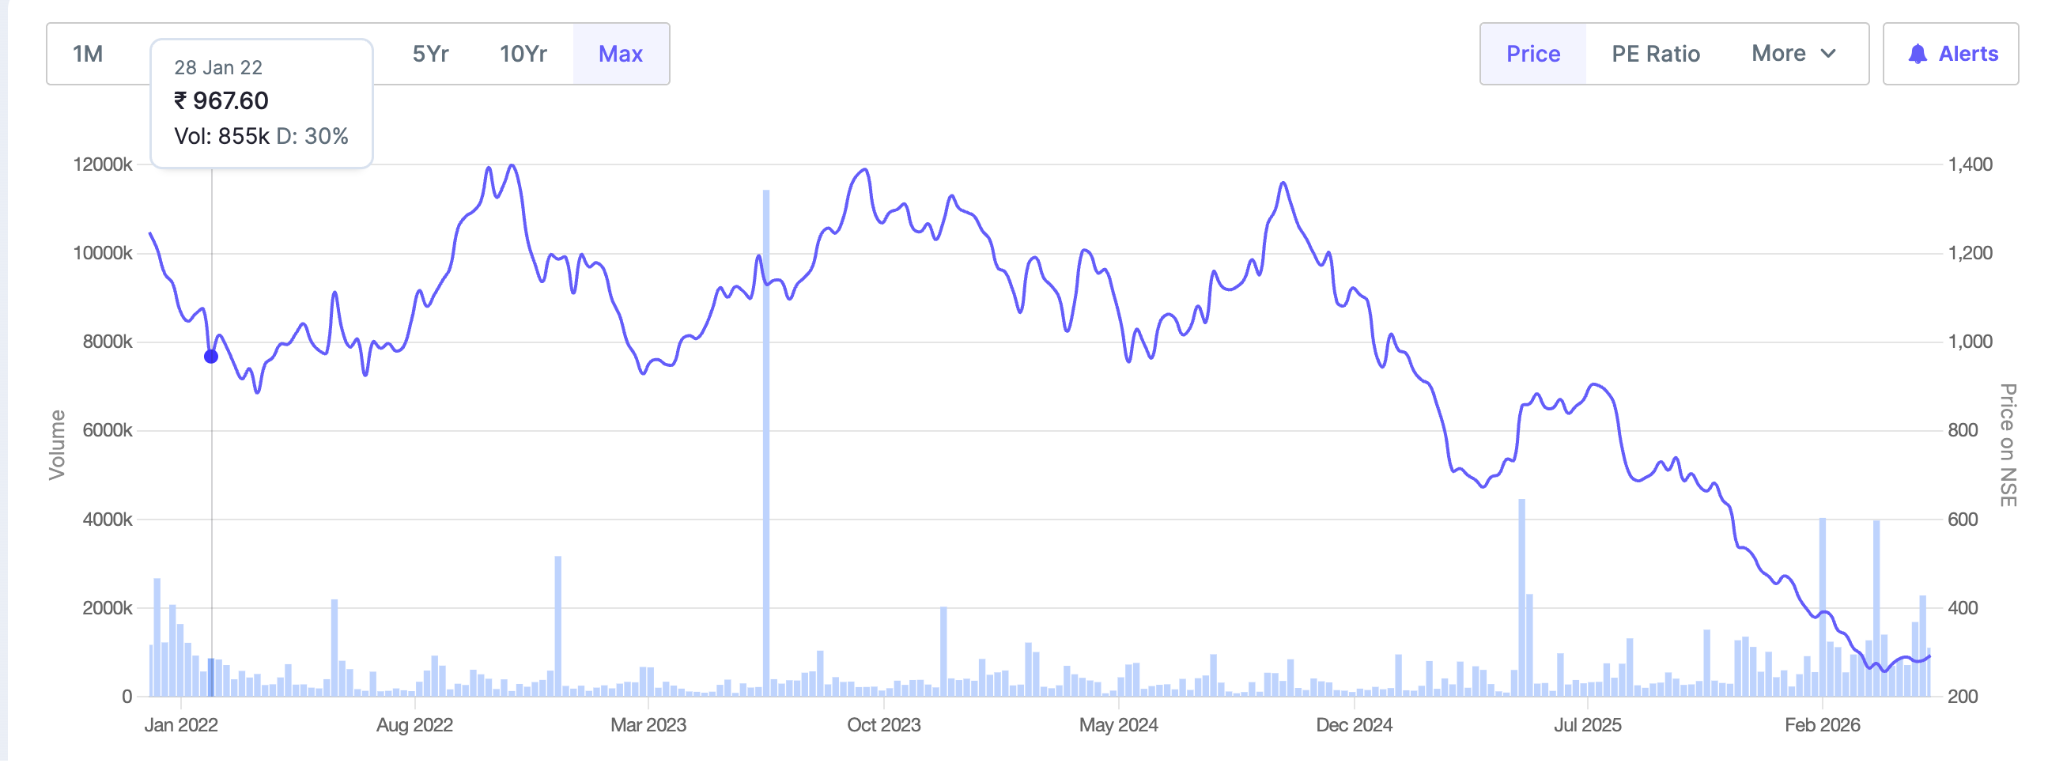
Valuations
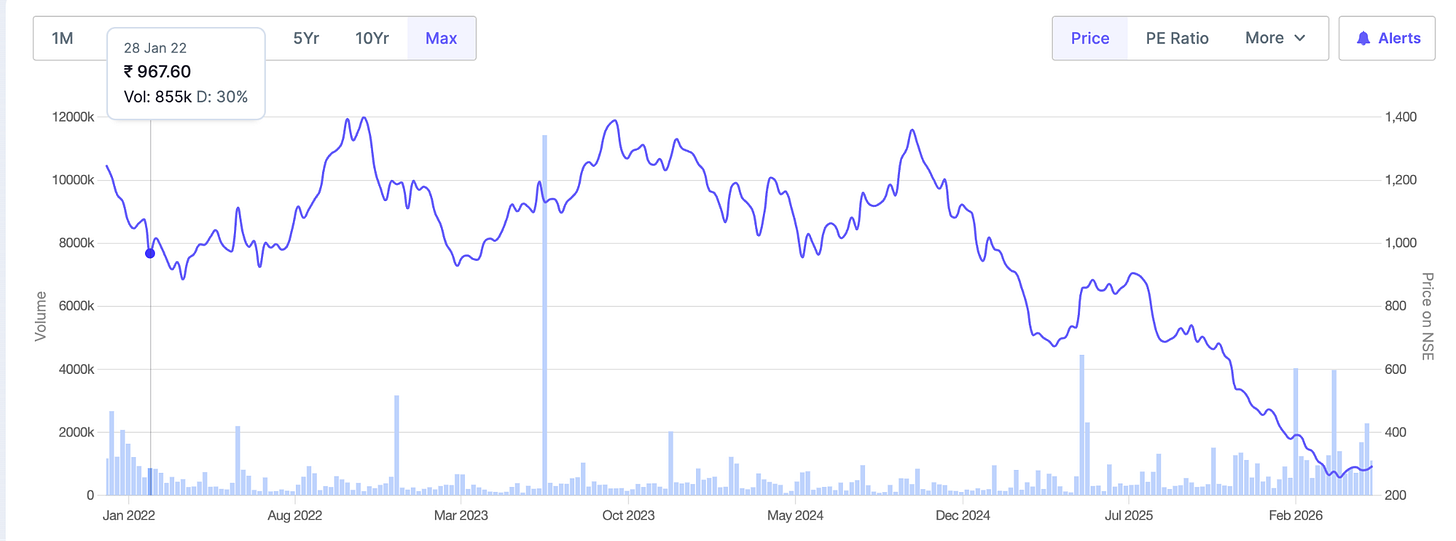
Currently it has fallen to 290 from IPO price of 1200
Since a lot of local manufacturers compete with GoFashion for their core products, GoFashion commands just 8% market share.
-
Price to Earning is 26.8 which seems optically high due to the fact that earnings are compressed
-
Book value of 125 with absolutely no debt gives another sign of relief, which makes price to book as 2.32. This is an absurd valuation for the high growth brand which has managed to grow at +25% for the past 6 years
Given the current developments, it is in my core watchlist. If the management walks the talk, this would be the 8th stock in my portfolio for now.