Analysis of Filatex’s FY22 Performance by financial Odyssey -FILATEX INDIA LTD – FY22 PERFORMANCE – Financial Odyssey
A great read - short and informative
Analysis of Filatex’s FY22 Performance by financial Odyssey -FILATEX INDIA LTD – FY22 PERFORMANCE – Financial Odyssey
A great read - short and informative
Filatex India --Q2FY23–CNBC interview–Earning Highlights --22nd Nov22 :
–Q2 was weak due to dumping from China due to China has adopted zero covid policy ,so their internal consumption has gone down drastically, so the production they have not dropped. so Producers are trying to dump where they have a mkt so to stop that we have to drop our pricess .
–There is volume growth of 22% but the margins have dropped drastically as we have to compete with the imports coming from china
–Q3 will remain similar or slightly better but from Q4 we will see Chinese have their new Year in early January after that they should open up.
–They are also thinking of reducing capacity as even after dumping they dont see their production being consumed. Already they are 75% of world production of Polyester filament Yarn so by dumping also they are not able to release.
–There is appetite downstream that we have seen our volumes increase by 22%. Our exports are down as they are dumping everywhere in the world so we are becoming uncompetitive in the world. As this gets corrected the margins will jump up.
–current prices --it depends on RM but our Margins EBITDA used to be 14/15% or 15INR/Kg has come down to almost like INR 5/kg so we have dropped our margins by about 10/11INR/Kg
–China was selling 85% of their production locally and its exports used to be hardly 12/15% before this Covid thing happened so they are bound to reduce production capacity, they have not been able to gain mkt share in exports even after dumping as they were catering to almost 80% of export mkt.
–Annual capacity of 401040/tonns that is post expansion by FY23. This has come on stream in sep’22 and we have added 43000 tonnes more this year to make it 4L. Our capacity utilization was onwards of 95% in Yarn , now we are not selling any chips any more so 100% we are converting to Yarn in-house so we are out of the chips mkt. In the old capacity utilization 100% in the new one its 85 to 90%
–Total contribution of value added products which are high margins ? --We will keep increasing our value added products by FY24. Right now its 70% as value added
–Cash of 240Cr on books , plans ? --We will retire some debt as of now & will do capex on our recycling which we are developing . We will commit a capex for that by FY23 end. 200Cr capex.
–We will bring down our debt to below 300Crs by FY23 end.
–Exports we used to do 13/15% but in this Qtr we are only able to do 3/4% due to dumping by China in the world.
This article has done a good job capturing Filatex’s Q2FY23 results, earnings call highlights and some of the insights you won’t find anywhere else.
The company’s Cost of goods sold increased by 34.7% YoY and other expenses increased by 24.77% YoY, which were the biggest contributors to the margin compression and decline in profitability. Production during the quarter increased by 13.72% to 97169 MT and sales increased by 22.18% to 101488 MT. While the selling price per MT decreased by 1.32% during the quarter, the COGS per MT increased by 10.25%.
Another amazing write up on Filatex’s business economics by Financial Odyssey.
The section on pricing power is eye opening.
Does anyone have any idea why the stock has jumped 10% today?
Hi Ganesh, are you still invested in Filatex? What’s your views? Why is this stock undervalued?
Excerpts from the Chairman Letter for FY 2023
The operating profits were impacted by several factorsincluding rising input cost of power and fuels, packing materials and consumables. Throughout the year, themargins remained under acute pressure due to large quantities of yarn being imported from China. The “zerotolerance” policy of China to contain Covid dampened their domestic demand . Even after relaxation on restrictions, the demand for yarns in China failed to gather momentum. Thus, Chinese yarn manufacturers started selling materials to India, Vietnam and other countries across the globe at very low prices. Though the material offered to Indian traders and importers was a minor fraction of China’s huge capacities and didn’t do much harm to them, but it was enough to almost destroy the domestic manufacturing capacity in India. While we did not cut operating capacity, we could sell only by matching Chinese prices. This situation led to a steep erosion of our margins. Several representations were made by Indian manufacturers through various associations and industry bodies. Surprisingly, this reality is grossly overlooked. In fact, the textiles yarn segment is not the only one that suffered. Several other industry segments had to face a similar situation. The information opacity relating to price, quantity and quality of these covert imports have made any project’ risk assessment difficult and all fresh investment plans are on “hold”. It would not be out of place to say that these imports are encouraging trading and assembling business at the cost of manufacturing investment. On one hand, we have a strained relationship due to the geopolitical situation and “Atma Nirbhar Bharat” but when it comes to imports from China , the situations seem quite different . Low Chinese prices also affected our exports. Despite slowdown in growth and disruptions in world trade and strained relations with China, imports from China to India were at a record level of over $102.25 billion in FY2022.The surge in scale and range of Chinese imports, aided and abetted by unscrupulous means including connivance among exporters, importers, clearing agents and customs, has sapped the performance, vitality and innate potential of the yarn sector. An import-dependent consumption, production and trading structure has evolved despite adequate manufacturing capacity. Cheaper imports of lowgrade quality yarn and fabrics continue to harm the Indian manufacturers. The Government of India is looking at ways and means through some policy initiative to stem this rot. QCOs on filament yarns have been prepared and are under implementation.
“The continuous and increasing influx of Chinese imports was
unabated in this quarter. In order to retain their market share,
Indian manufacturers were forced to cut their prices to align
with import rates, which are lower by INR 4-5/kg. The industry
has been grappling with an erosion of margin. This has had an
adverse impact on profit margins despite a higher volume of
sales.
To further increase the share of renewable energy, the company
has signed PPA and SHA with Onevolt Energy Pvt Ltd, a 100%
subsidiary of Amplus Energy Solutions Pte Ltd, to procure solar
power as a captive consumer under the Inter -State
Transmission System (ISTS) for both its plants in Dahej and
Dadra.”
MADHU SUDHAN BHAGERIA
Chairman & Managing Director
anybody looking at this now?
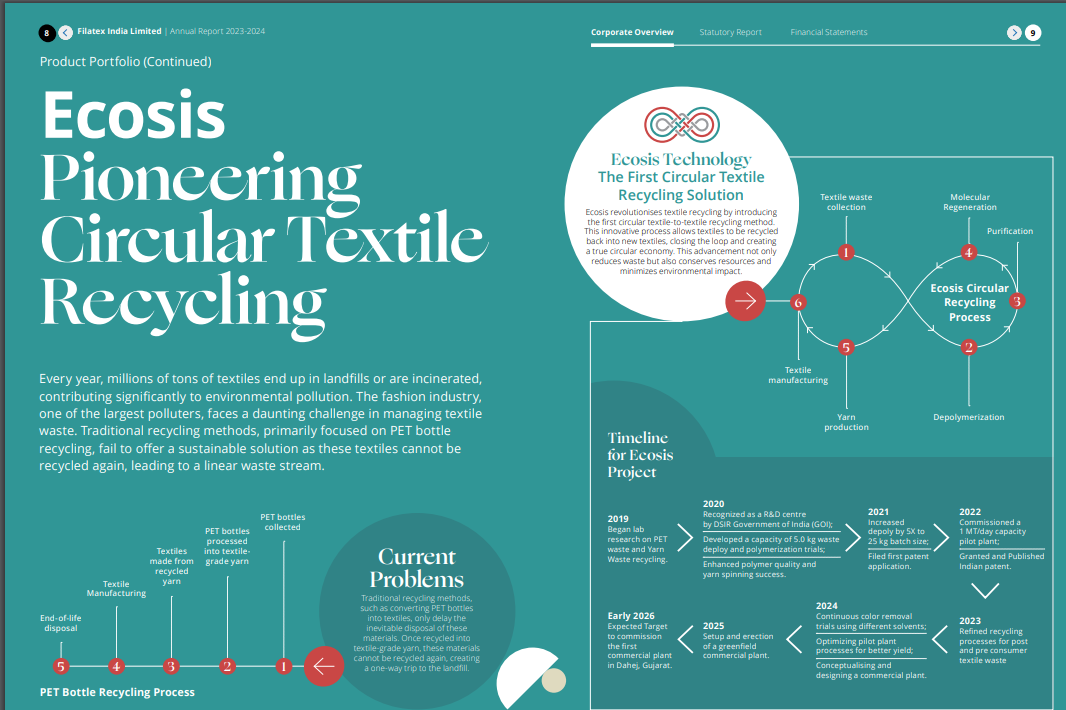
Ecosis Technology
The First Circular Textile
Recycling Solution
Ecosis revolutionises textile recycling by introducing
the first circular textile-to-textile recycling method.
This innovative process allows textiles to be recycled
back into new textiles, closing the loop and creating
a true circular economy. This advancement not only
reduces waste but also conserves resources and
minimizes environmental impact.
Filatex got screened for me, and post reading the concall here are my rough notes -
In summary, seems like the business may come out of a downturn and if recycling plant works as management is guiding, it could turn out quite great on current set of financials.
Disc: Just started studying, no positions as of today.
Let me know what more you find on recycling opportunity. they are walking very slow with this one but one way to loook at this is they are going right.
Q4 FY 25 concall Notes–
Knitted fabric from China was coming below the cost prices. So there the government has put $3.5 as the minimum price across most HS codes for fabric imports. Import of fabrics have reduced drastically, hence local producers are producing more fabrics to meet that demand. So, the yarn demand has also increased.
Tied up with Torrent power for a capacity of approximately 20 MW (out of total energy consumption of 36 MW) renewable energy from January 2026 at a landed cost of INR4.75 per unit.
As this energy cost will be lower than grid power cost, this will reduce our energy payouts by around INR19 crores to INR20 crores annually
We also operate a 30 MW captive power plant. With 20 MW from renewables, the utilization of our turbine capacity is expected to decline. we will generate only 15 MW of electricity. Surplus steam will be sold to small companies in the surrounding area.
85 to 90 cr capex is required for the steam pipeline and infrastructure inside the plant. projected annual savings – 60 cr
capacity utilization is above 95%
Additional yarn capacities at Dahej to be operational by August 26
Capex of 235 crores. This is mostly back ended. We are doing ordering now and main capex will happen from next financial year.
FDY market is gaining ground in domestic market.
will be operational by August 2026 and will give additional EBITDA 70 Cr annually
raw material cost will reduce - around 2.4 MTPA of PTA (Purified Terephthalic Acid) capacities (two) will be commissioned by CY 2025 by Indian Oil and GAIL. Reliance Industries is putting up a 3.2 MTPA by mid of 2027.
PTA is in short supply in India, and China have abundance of PTA rather they export a lot of PTA. Our cost is high due to import as port, freight, clearance charges, everything gets added.
we have started execution of our proposed recycling 26,250 tons per annum capacity plant. We expect to be in production by July 2026. Revenue of 300 crore with EBIDTA of 30% +.
Double digit EBIDTA margin by 2nd half of FY26. 1st half 1.5 to 2% higher than last year.
Revenue will be flat ( due to capacity utilization at 95%) or little less (as raw material prices would fall)
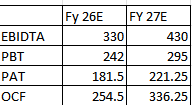
FY 26 EBIDTA to be 30% above FY 25. – ( i.e. ~330 cr )
FY 27 EBIDTA expected to be 30% more than FY 26 – (i.e. ~ 430 cr)
INR68 crores of traded goods- Basically gas, which we had to take and sell from IOC - Traded goods, we have a very small margin. There’s some commitment that we need to fulfill. That’s why we are doing it. if we were to remove that, the EBITDA margins would have been much better. —> I wonder why they are doing this low margin trading business!
Impact due to US tariff on China - No impact as per management - U.S. doesn’t import yarn that much. It imports finished garments, mostly fabrics. Yarn exports from China are to the countries where fabric is being made like Brazil, Egypt, Turkey, Bangladesh, Vietnam, Pakistan.
Company’s export is only 1 / 2% of revenue.
Capex –> 235 cr for yarn + 85 cr for steam pipeline + 24 cr for green power from torrent + 300 cr for recycle plant. Total capex = 644 cr.
capex funding →
300 cr Recycle project – 200 cr term loan + 100 cr equity by parent company
235 cr yarn – 126 ECB + rest internal accrual
ECB (External Commercial Borrowing) is cheaper than Indian loan by .8 to 1 %
Higher other income is due to write back of interest provision
Here is what I’ve got from a quick back of the envelope calculation -
Disclosure - tracking position as of now.
Have been analysing Filatex Industries. My inference is:
Company is in low margin commodity business which is dominated by Chinese players. If duty on Chinese goods is removed then margins will crash to 5% from 8% (as happened in 2023).
Best case scenario is 8% EBIDTA margins translating into 3% PAT margin.
Company is increasing capacity and also going for capex for cost reduction (steam and electricity).
Additional capacity can be negative in case margins come down due to imports from China (which can happen despite import duty).
Further is if anti-dumping duty is imposed on MEG its key input then margins can decline.
Overall Filatex is a no-go for me. But the silver lining is in the Recycling project which is expected to have 30% EBIDTA margins. While sales will be only 300cr EBIDTA contribution is 100Cr. As it is only 10% of company sales overall impact will be 2% increase in EBIDTA margin which is not much.
final take is wait and watch till recycling project is implemented and how Chinese imports will impact.
company has been allotting shares to promoters and non-promoters through preferential issues. can anyone share at what price the allotments have been done. thanks.
Company is signing MOUs for their Recycled textiles. this can be a game changer for the company. it will move from a low margins (10%) to a high margin (30%) segment.
Looks like a very good opportunity and available at very good price as market is overlooking it as it is in low margin MMF business.
I found no evidence of a preferential issue to promoters at Filatex India Ltd (NSE: FILATEX) in the last 12–18 months, based on the data I can access.
Filatex India is likely to make a loss in Q1 due to 75% capacity utilisation at breakeven EBIDTA (as per Q4 investor call). Even then the stock price is moving up due to long term prospects of company in recycling..