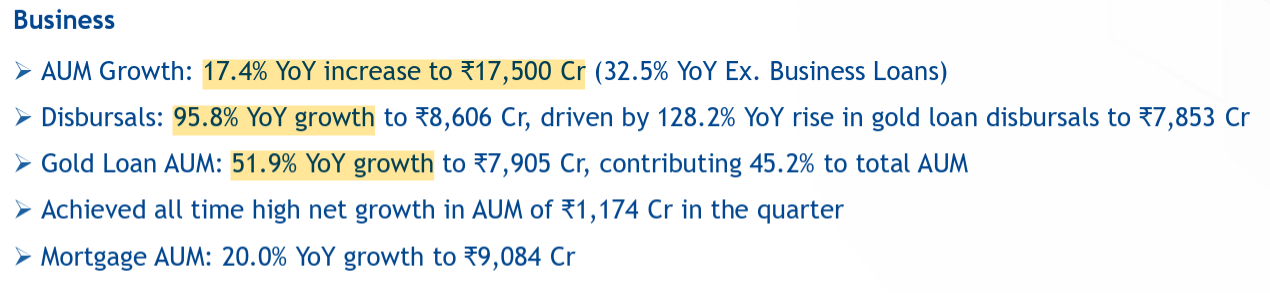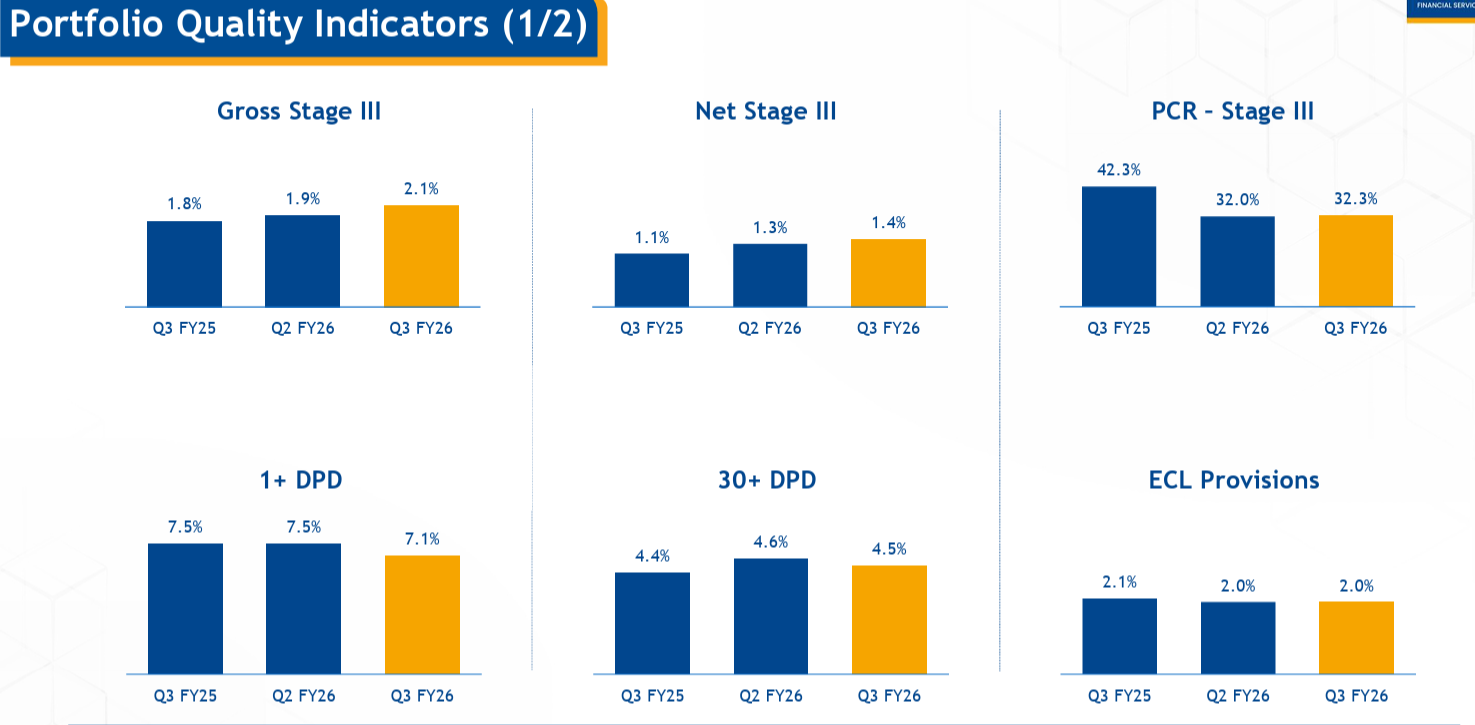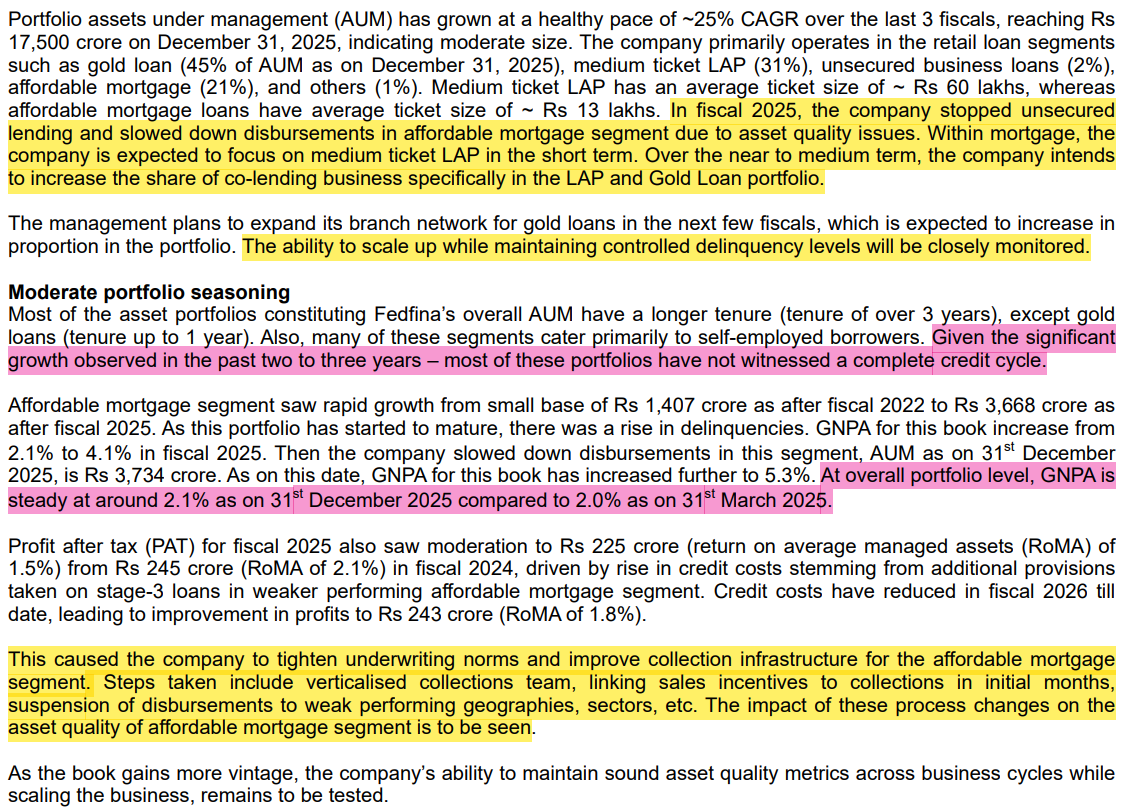
Fedbank Financial Services (FEDFINA) is shaping up to be a solid, dependable player in the Gold and MSME lending space in India. The company focuses on keeping asset quality tight, growing through two clear business lines, and building a platform that can scale without losing control. After a heavy restructuring phase from Q3 FY25 to Q1 FY26, FEDFINA seems to have settled back into rhythm.
Key Investment Thesis:
- De-risked balance sheet: Transitioned from 16% unsecured exposure (FY25) to sub-1% (Q2 FY26)
- Twin-engine momentum: Gold loans (36% of AUM, 36% growth) and secured mortgages (54% of AUM, 22% growth)
- Capital allocation discipline: Debt-equity ratio decreased from 4.03 (FY25) to 3.78 (Q2 FY26); ~150 gold branches expansion underway
- Credit cost stabilization: Guidance of 100 ± 10 bps maintained; management overlay strategies yielding results
- Operational leverage phase: Cost-to-income improved 136 bps sequentially to 56.9%; branch productivity acceleration post-expansion
- Regulatory positioning: AA ratings from all three major agencies; well-positioned for evolving NBFC guidelines
SECTION 1: COMPANY GENESIS & EVOLUTION (1995-2010) - THE FOUNDATION YEARS
Origin & Early Phase (1995-2010)
Incorporation & Initial Setup (April 1995)
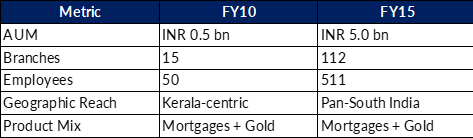
Fedbank Financial Services Limited was incorporated as a Kerala-based entity in April 1995. For its first 15 years, the company remained relatively dormant, with limited operational scale and focused presence in Kerala markets.
NBFC License & Commencement of Operations (August 2010)
- RBI granted NBFC (Non-Banking Financial Company) license in August 2010
- Company commenced operations post-license with a clear strategic mandate from Federal Bank (parent)
- Initial focus: Mortgage sourcing for Federal Bank and gold lending operations
- Regulatory classification: NBFC-ND-SI (Non-Deposit Taking, Systematically Important)
Strategic Partnership Foundation:
Parent Support & Positioning
Federal Bank’s 61.7% ownership stake provided:
- Operational infrastructure and technology backbone
- Cross-sell opportunities for home loan customers
- Credit enhancement through parent bank’s relationships
- Funding access at favorable rates through parent bank channels
SECTION 2: NBFC TRANSFORMATION & INFANCY PHASE (2010-2015)
Scale-up Period Characteristics
Business Model Genesis (2010-2015)
- Sourcing Model: Originated loans for Federal Bank’s retail portfolio
- Direct Operations: Built branch infrastructure for direct mortgage and gold loan sourcing
- Product Focus: Two-product strategy - mortgages and gold loans
- Geographic Strategy: Concentrated in Southern states (Tamil Nadu, Karnataka, Andhra Pradesh)
Development Metrics - The Infancy Years

Operational Achievements (FY10-FY15)
- Built foundational credit infrastructure for mortgage underwriting
- Established gold loan valuation and security framework
- Developed collection systems for secured lending
- Achieved breakeven operations by FY12
- Stabilized asset quality with GNPA < 1.5%
Constraints of the Period
- Limited profitability due to dependence on parent bank for sourcing
- Technology investments lagged peer institutions
- Management bandwidth stretched across multiple initiatives
Valuation metrics remained conservative due to limited scale
SECTION 3: FOUNDATION PHASE & SCALE STRATEGY (2015-2019)
Pre-Strategic Investment Period (FY16-FY18)
Business Model Transition
- Shift from pure sourcing partner to direct retail lender
- Development of proprietary underwriting frameworks
- Investment in distribution infrastructure independent of parent bank
Key Operational Developments (FY16-FY19)

FY16-FY18 Achievements
- GNPA controlled at 1.0-1.5% despite scaling
- Gold loan productivity improved through branch specialization
- Mortgage book quality enhanced with selective underwriting
- Operating expenses stabilized at 5.7% of AUM
- ROA maintained at 1.7-2.0% range
Competitive Positioning (FY16-FY19)
- Emerged as regional player in South India
- Built reputation for asset quality in secured lending
- Technology adoption lagged larger HFCs
- Limited presence outside South/West regions
SECTION 4: STRATEGIC INFLECTION POINT - TRUE NORTH PARTNERSHIP (FY19), The True North Investment (November 2018)
Investment Structure & Valuation
- Investor: True North (Leading Indian mid-market PE fund)
- Stake: Significant minority investment (~25-30%)
- Valuation: Implied post-money valuation of INR 1,200-1,400 crores
- Investment thesis: Scaling secured MSME lending play with Pan-India distribution opportunity
Strategic Rationale for Partnership

Immediate Post-Investment Changes (FY19-FY20)
- New management appointments with true MSME lending experience
- Aggressive branch expansion programme initiated
- Technology platform modernization accelerated
- Geographic diversification strategy formalized
- Capital raising strategy implemented
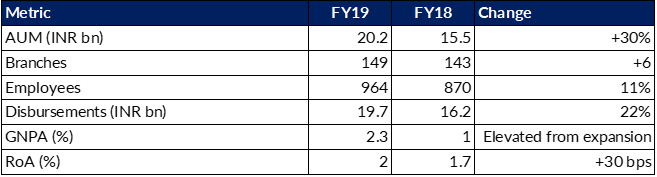
FY19 Financial Snapshot (Post-Investment)
SECTION 5: SCALE-UP PHASE & ACCELERATION (FY20-FY22)
Post-True North Strategy Execution
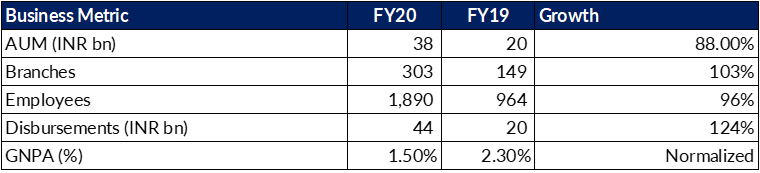
FY20: Foundation of Rapid Expansion
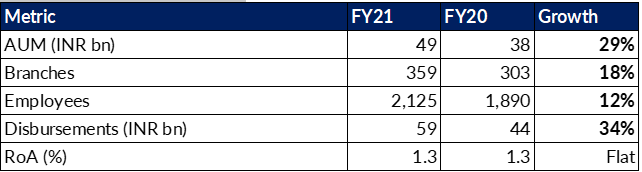
FY21: Momentum Continuation
SECTION 6: DELIVERY & MARKET RECOGNITION PHASE (FY23-Q3FY24)
FY23: Profitability Achievement
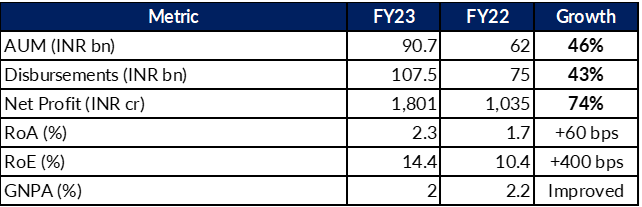
FY23 Operational Metrics
- Branches: 575 (+60 from FY22)
- Employees: 3,570 (+715 from FY22)
- AUM per branch: INR 157 crores (from INR 120 in FY22)
- Disbursements per branch: INR 187 crores (from INR 145 in FY22)
Credit Rating Milestones - FY23
- January 2023: CARE Ratings upgraded to AA (from AA-)
- Marked company entry into AA-rated NBFC cohort
SECTION 7: KEY QUARTERLY EXECUTION DELAYS POST IPO
H1 FY24 (Apr-Sep 2023) - Normalization Phase

Journey: Company demonstrated pricing power and market acceptance of mortgage + gold dual model
Q1 FY25 (Apr-Jun 2024) - Post-IPO Momentum

Q1 FY25: Early Signs—Asset Quality Deterioration and Operational Strain
- Unexpected Delinquencies: The company experienced a sharp rise in credit costs, hitting 1.2% (120bps) annualized, well above guidance of 80bps. This was driven mainly by early delinquencies in the mortgage portfolio, with gross non-performing loans (GNPL) in mortgages rising to 3% from 2.2% sequentially. The percentage of 1-day past due loans (1 DPD) climbed from 7.4% to 8%, indicating systemic stress.
- Collections and Infrastructure Deficit: The surge in delinquencies was not purely macro-driven. Management later acknowledged that its collections infrastructure, especially for ST LAP, had not kept pace with loan book growth. Processes and field force proved inadequate for the granularity and geographical depth of newer originations.
- Business Mix Misalignment: A strategic push on new originations and distribution expansion (e.g., gold branches and ST LAP) occurred before process, technology, and collections capacity were fully scaled. This “growth-through-capacity” strategy exposed operational bottlenecks when stress emerged in granular lending.
- Market Environment: While the company cited general election and heatwave disruptions, these events only exacerbated deeply rooted process weaknesses rather than being the root cause.
Q2 FY25 (Jul-Sep 2024) - Stress Indicators Emerge
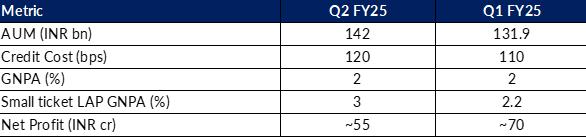
Q2 FY25: Escalation—Provisioning, Cautious Disbursal, and Conservatism
- Management Response to Stress: In Q2, management took a more conservative stance, slowing disbursals within ST LAP and focusing on collections and portfolio management over loan book growth. This decision was made despite headline improvements in 1 DPD and 30 DPD, as underlying customer cashflows and environment had not improved.
- Elevated Provisions and Overlay: Additional discretionary ECL provisions were made (INR 22 crore overlay), reflecting the need to “get ahead of the curve” before annual risk model refreshes. This pushed the cost of credit higher, with management conceding that full-year credit costs would overshoot earlier guidance (now 90–100bps+ expected).
- Branch and Opex Pressure: 46 new branches were added to support gold/ST LAP ambitions, increasing cost-to-income to 58.6%. These upfront investments further weighed on profitability just as income from newly opened branches had not yet stabilized.
- Root Cause—Customer Profile and Economics: The principal drivers of stress were stagnant or declining real incomes for the underbanked, self-employed target segment—exacerbated by expense inflation and flat business recovery post-COVID. The segment’s cashflow volatility required far more intensive collections and risk screening than was in place.
Q3 FY25 (Oct-Dec 2024) - Crisis & Restructuring

Q3 FY25: Climax—Restructuring, Management Change, and One-Time Clean-Up
- Leadership Transition: Parvez Mulla replaced Anil Kothuri as Managing Director mid-November 2024, reflecting the Board’s intent to pivot swiftly to risk containment and operational discipline.
- Aggressive Balance Sheet Clean-Up:
- Elevated provisioning: INR 75.5 crore one-time provision for deep NPA pools and overlays for delayed resolutions.
- Full annual ECL refresh to reset PD/LGD models for all buckets.
- Assignment/derecognition of large unsecured business loan books (770+ crore), both to ringfence new originations from legacy risk and to release capital for secured business redeployment.
- Sale of deep-delinquent small LAP NPAs (~INR 80 crore) to ARC, with upfront cash realization and improvement in reported asset quality and PCR.
- Collections and Tech Overhaul: New CBO (Chief Business Officer) and verticalized collections structure were introduced; BRE-powered Salesforce LOS was rolled out to enforce stringent new loan origination and policy discipline for granular lending.
- Clear Acknowledgement of Roots: Management admitted underinvestment in collections and branch-level controls; the stress was not seen as purely environmental but rooted in internal process/back-end underdevelopment.
Corrective Actions (Q3 FY25 Onward)
- Strategic Capital Allocation: Pivot to a “twin engine” model focusing on gold and secured LAP, with sub-1% unsecured exposure.
- Aggressive Tech and Collections Build-Out: Field force doubled in six months; leader roles in collections verticalized and empowered.
- Cost Rationalization, Branch Co-location: 49 ST LAP branches co-located within gold branches, freeing up costs; planned addition of >150 gold branches for FY26 in more strategically measured sequence.
- Prudent Credit Cost Guidance: Management explicitly retained 1% credit cost guidance for FY26, unwilling to reduce guidance prematurely during clean-up.
- ECL and Underwriting Revamp: Higher proportion of higher CIBIL scores and policy tightening for new customers.
- Opex and Scale Reset: Commitment to keep cost-to-income at 56–58% levels through FY26 recovery, with expectations to unlock operating leverage only in FY27
FY26 Positioning—Outcome and Follow-Through
- Secured Book: Over 99% of on-book portfolio now comprises secured gold and mortgage loans.
- Collections Muscle: Significantly expanded, with resolution metrics stabilized.
- Cost Structure and Branch Network: Growth investments (new branches, tech, field force) embedded in FY25 numbers, with future periods expected to benefit from these fixed cost bases as new branches ramp up.
- Return Metrics: Credit costs returned to normative ranges; ROA/ROE on improvement path.
- Business Philosophy: Candid admission that the FY25-26 period is a “rebuild and recovery” phase, with focus on consistency, predictability, and resilience above headline growth.
SECTION 8: TRANSFORMATION PHASE - FY26 STRATEGIC RECALIBRATION
Q1 FY26 (Apr-Jun 2025) - First Full Quarter of Rebuild
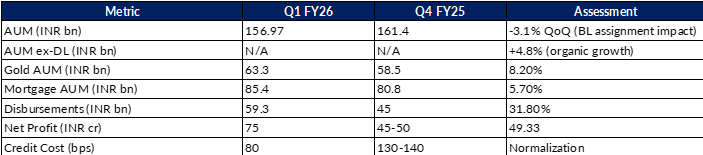
Q1 FY26 Strategic Milestones
De-risking Initiatives:
- 100% assignment of INR 770 crores unsecured BL portfolio (full credit risk transfer)
- Residual unsecured BL book reduced from INR 1,064 crores to INR 270 crores
- ARC sale: INR 25 crores of ST LAP delinquent NPAs via 85-15 SR structure
- Maiden ECB issuance: INR 100 million (external commercial borrowing)
Product Mix Transformation:
- Gold loans: 44% of on-book AUM (from 40% beginning of fiscal)
- Mortgage (secured): 54% of on-book AUM
- Unsecured MSME: 2.3% of on-book AUM
Operational Infrastructure:
- Branch co-locations: 23 ST LAP branches merged into gold locations
- New MSME hubs planned: 100+ new branches in pipeline
- Collection team expansion: Onboarded senior leadership; field team strengthening target Q2
- Technology deployment: System-driven BRE (Business Rule Engine) across ST LAP (200+ branches on Salesforce)
Capital & Leverage Management:
- Capital adequacy increased 49 bps (21.9% → 22.4%)
- Debt-equity ratio improved to 3.89 from 4.03
- External commercial borrowing: 8.5% of borrowing mix (70-80 bps cheaper than local)
- Incremental borrowing cost: Sub-8% (down from 8.5% in Q4 FY25)
Q2 FY26 (Jul-Sep 2025) - CURRENT QUARTER MOMENTUM
Latest Performance (September 30, 2025)

SECTION 9: BUSINESS MODEL ARCHITECTURE
The Twin-Engine Strategy
Engine 1: Gold Loans (32-46% of AUM)
Growth Trajectory:
- FY19: INR 4.5 bn (22% of AUM)
- FY22: INR 24.0 bn (39% of AUM)
- FY25: INR 42.0 bn (37% of AUM)
- Q2 FY26: INR 67.3 bn (42% of AUM) CURRENT
Strategic Positioning:
- Upper-end of gold lending market (INR 100k average ticket size)
- Less price-sensitive customer segment vs. mass-market competitors
- LTV managed conservatively at 62-64% (vs. 70%+ market standard)
- Zero credit loss track record over past 3+ years
Channel Model:
- 494 specialized gold branches (437 in FY25 → 494 in Q2 FY26)
- ~2,000 DSA network across India
- Doorstep gold loan service (DSGL) - 71% YoY growth in Q1 FY26
- 10.7 tons inventory as of Q2 FY26 (4% YoY growth)
Profitability Metrics:
- Yield: 15.3% (Q2 FY26)
- Credit cost: Near-zero
- RoA equivalent: 3.0%+ (highest among product lines)
- GNPA of 0.1% and NNPA of 0.0%
Engine 2: Mortgage Loans - LAP (54% of AUM)
Sub-segments within mortgage:
2a) Small-Ticket LAP (26% of overall AUM)
- Ticket size: INR 1-3 million (vs. INR 500k-2.5mn market standard)
- Niche positioning: Upper-informal segment
- Yield: 16.1%
- GNPA: 3.4% (elevated but improving from 4%+ stress levels) and NNPA of 1.9%
- Strategy: Scale to 40% of AUM by FY26E
2b) Medium-Ticket LAP (26% of overall AUM)
- Ticket size: INR 2.5-10 million
- Prime/near-prime customer segment
- Yield: 12.7%
- GNPA: 4.9% (Elevated from stress levels) and NNPA of 2.8%
- Strategy: Grow via direct assignment (minimize capital allocation)
2c) Affordable Housing/Home Loans (2-3% embedded in ST LAP)
- Ticket size: INR 3-10 million
- First-time home buyer focus
- Yield: 14.8%
- Strategy: Cross-sell from LAP customer base
Mortgage Engine Growth:
- FY19: INR 8.8 bn
- FY22: INR 39.2 bn (+346% over 3 years)
- FY25: INR 74.3 bn
- Q2 FY26: INR 88.0 bn CURRENT
Product Portfolio Evolution

SECTION 10: Management Commentary
Management Guidance - FY26 (Parvez Mulla Regime)
Core Commitments:
- AUM Growth: 20-25% normalized (vs. 28% organic ex-DL in H1)
- Credit Cost: 100 ± 10 basis points (bps) full year
- Cost-to-Income: Range-bound from Q4 FY25 levels (~56-57%)
- Return on Assets: Stabilizing toward 2.4-2.5% by FY27
- Return on Equity: 13-15% range (post equity dilution from IPO)
SECTION 11: CREDIT FRAMEWORK & RISK MANAGEMENT
Underwriting Standards - Current Framework
Gold Loans
- LTV: 62% (Avg) vs. 70%+ market average
- Minimum loan size: INR 3,000
- Maximum tenure: 45 months (avg)
- Renewal rate: 70% of customers
- Collection strategy: Bullet repayment + EMI options
Small-Ticket LAP
- Income assessment: 100+ data points per customer
- CIBIL scores: 74% above 700, 26% in 650-700 range
- LTV: 52.8% average
- Ticket size: INR 1-3 million (avg INR 1.3 mn)
- Tenure: 7-7.5 years (long-tenure benefit)
Medium-Ticket LAP
- CIBIL requirement: Established professionals
- LTV: 55.1% average
- Ticket size: INR 4.9 million (avg)
- Tenure: 4-5 years
- Revenue model: Predominantly fixed rate
Collection Infrastructure - Q2 FY26 Status

Collection Performance Metrics (ST LAP)
- 1+ DPD: 7.8% (Q2 FY26) vs. 8.0% (Q1)
- 30+ DPD: 4.8% vs. 5.0%
- Cure rates: 1+ to 30+: ~30% (target: 40%+ by year-end)
Regulatory Framework & Compliance
Credit Ratings (All Three Agencies = AA)
- CARE Ratings: AA Stable (January 2024 upgrade)
- CRISIL: AA Positive (January 2024 first-time)
- India Ratings: AA Stable (February 2024 two-notch upgrade)
RBI Compliance:
- NBFC-ND-SI Category: Meets all regulatory requirements
- Bank-owned NBFC Guidelines (Oct 4 circular): Under consultation with RBI
- Digital disbursement mandate (May 8, 2024): Fully compliant
- External benchmarking framework: 45% of borrowings on external benchmarks
SECTION 12: VALUATION FRAMEWORK & INVESTMENT CASE
Valuation Framework
Bear Case
- AUM growth normalizes to 18-20% (below guidance)
- RoA remains compressed at 2.0% (vs. 2.6%+ target)
- Cost-to-income stays elevated at 58%+
- Credit costs spike to 120+ bps due to ST LAP stress
- Price-to-Book multiple compression to 1.8-2.0x
Base Case)
- AUM growth achieves 22-25% guidance
- RoA improves to 2.3-2.4%
- Cost-to-income improves to remains at or around 58%
- Credit costs normalize to 80-90 bps by Q4
- Price-to-Book multiple 2.0-2.5x (reflecting growth + quality)
Bull Case
- AUM growth accelerates to 28-30% (gold price tailwind)
- RoA expands to 2.6-2.8%
- Cost-to-income improves to below 58% (operating leverage)
- Credit costs decline to 60-70 bps (ST LAP recovery)
- Price-to-Book multiple 2.5-3.0x (reflecting re-rating)
What I think Financials might turn out over a period of next 3 years:
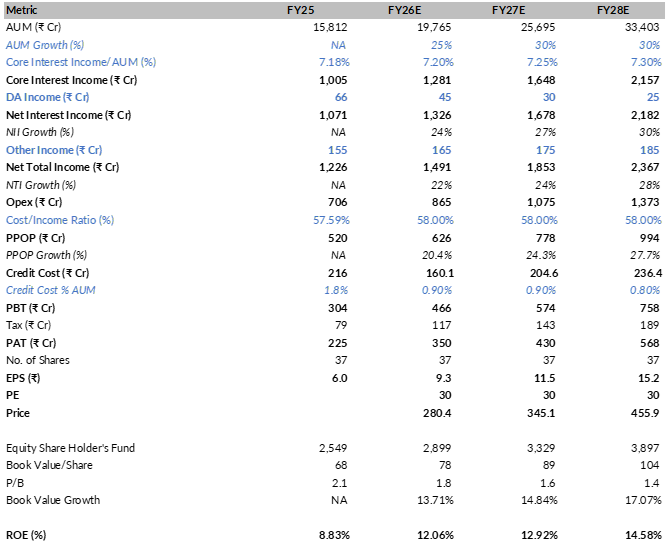
SECTION 13: RISKS
Key Downside Risks
- ST LAP Portfolio Deterioration: Continued stress in small-ticket mortgage book could necessitate higher provisions
- Regulatory Headwinds: Bank-owned NBFC guidelines implementation could limit growth potential
- Technology Execution: Salesforce migration and BRE implementation risks
- Competition Intensification: Larger players expanding into secured lending could compress yields
- Gold Price Normalization: Sharp decline in gold prices would reduce gold loan growth momentum
Disclaimer: Invested and Baised, Buy Transaction in Last 10 days
Regards
Mann