
Any guidance/updates post the quarterly earnings for Dec’23 ? There seems to be a momentum loss as far as growth is concerned. Any new information/updates/analysis will be highly appreciated! Thanks!
I tried to contact co. representatives to get more clarity on the ‘No growth Issue’ But they won’t reveal anything more than what is mentioned in the presentation.
If we look at picture from a broader point of view.
The sales of other biggies like Welspun,Trident etc. is also hovering in the same range since last many qtrs.
Their growth no’s looks good bcz their sales were horribly impacted last year, whereas Faze 3 was able to maintain their Rev. no’s.
Now when the industry headwinds turn into tailwinds in FY25 then we will the full impact of Op. lev coming into play.
Its just a matter of time when thing turn around.
2 Likes
Similar commentary given by PDS wherein they are expecting some growth to resume from Q4 onwards. But what is interesting to note is that PDS has onboarded Target as one of its client and it is expecting massive ramp up in revenue coming from Target. Target is one of the top 3 clients for Faze three in terms of revenue. Not sure if this development of Target with PDS is going to have any impact on Faze three’s business.
2 Likes
Anybody still tracking this ?
Q4 topline growth is good. I think highest revenue achieved till now.
But margins shrunk to ~11% on consolidated basis and 10% on standalone basis.
Even if we discount the one time expense of 4 Cr, margins are still under 13%.
Drop of around 4% when compared to last few quarters.
Management commentary is good but they have indicated some margin pressure in the near term till their new products reach break even levels.
Does anybody have any more insights into this ?
1 Like
It is expensive at PE of 20. It is commodity business and margins will be lower… there is too much competition.
Even PDS margins will be low going forward.
1 Like
Fy24 was a slow one for the whole industry. They have everything in place now all they need is demand push. Margins hv been impacted as majority of capex is completed now.
For fy25 they should be able to do 20% growth.
At 20 P.e it is definitely not expensive rather near about fair valuations.
In case the demand comes back strongly their margins will claw back & then 20 P.e will also look cheap.
1 Like
June’24 quarterly results are out. Topline growth seems promising but the EBITDA margins have taken a hit for the second time in a row. Margins are ~11%. I went through their presentation and they have given reasons behind the margin hit and those reasons seem to make sense. But does anyone know when will the margins be back to 16%+ levels ? In the latest credit rating report, they have specified that the EBITDA margins for the current year would be around 15-16% range. The company also adds up the other Income while considering their EBITDA margins so even with that calculation the margin is close to 12.5% for this quarter.
Any insights or details from anybody would be of great help.
Disc: Invested.
1 Like
Can anyone clarify on this point - The company does order backed production + order backed raw material stocking then why there is a lag in passing the increase in raw material prices? Even if the raw material stocking is 85-90% of the order, there should not be much impact on margins because of increase in raw material prices. This being said the raw material prices as a % of sale have gone from 45% to 52% YOY. According to this there should not be any volume growth in this quarter then.
And if anyone can also help me understand - what are these new products which company is entering into? As per my understanding they are already well diversified in home textile category.
Disc: Invested
1 Like
Hi,
Is anyone planning to attend the AGM today? If yes then please ask the mgmt about their diminishing margin profile and when will it be back to 16-18% range. Who are their top 3 clients right now? If they have added any new clients in the last year. What are the new products that they keep talking about. Are there any plans for buyback or bonus or stock split?
Thanks in advance!
Looks like promoter Ajay Anand has added 1.79% stake to his existing holding. Goes with the last quarter commentary of better margins and topline going ahead.
1 Like
Ajay Anand has not bought it from open market. It is a tranfer of shares in the form of gift from Neerav Hans to Ajay Anand. If you check last quarter’s public shareholding, you will Neerav Hans holding 1.79% shares and that has been transferred in this quarter. Neerav Hans name would be missing from this quarter’s shareholding.
1 Like
Thanks for the clarification.
There has been a sharp move in the stock in past 3 days despite the overall market being very volatile.
Agreed that in Top of the bed products and floor coverings China is a dominant player in the USA and with very heavy tariffs on China this is bound to change and may shift to India or some other country hence companies like faze3 can benefit hugely.
But, due to tariffs the discretionary spending in the USA can come down drastically which can impact these firms more negatively. Am I missing something here?
2 Likes
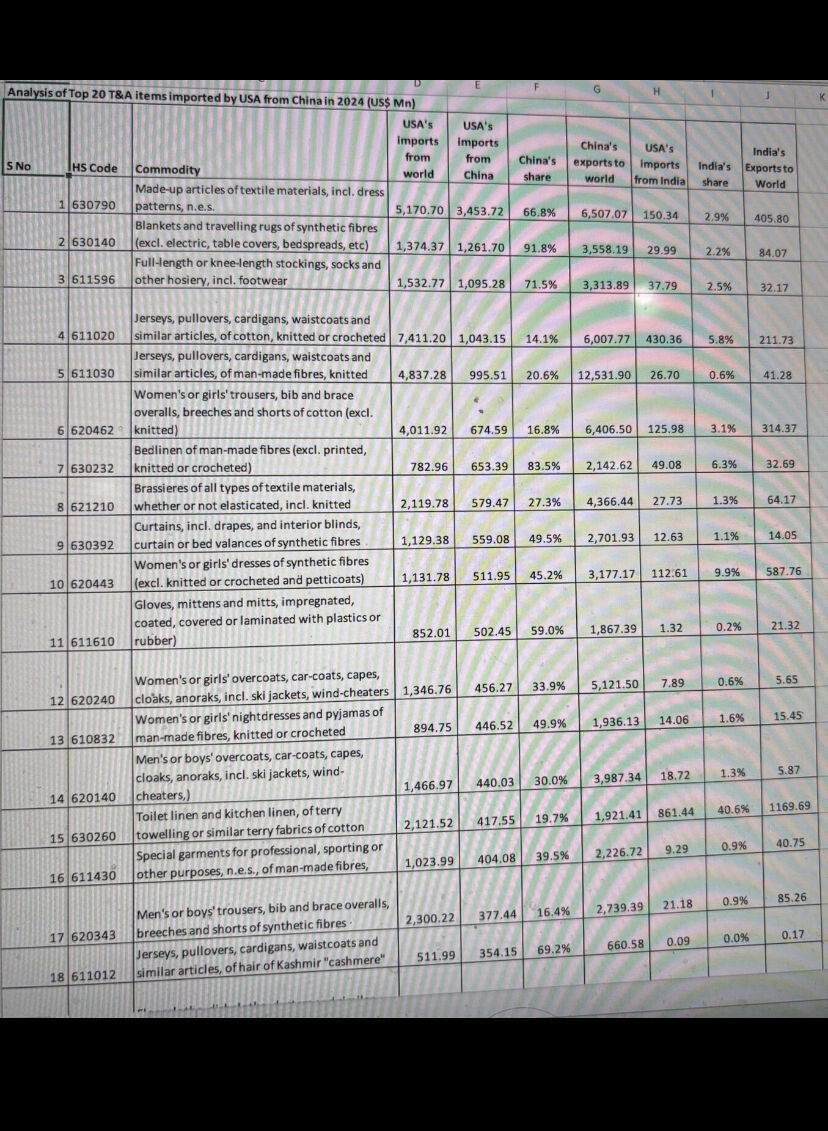
A comparison of exports of textile products to the USA. India Vs China.
Towels and bedsheets being the only segment where India has a very good market share in the USA.
I feel there’s not much of a cost difference between China and India for these items. Huge opportunity lies for companies like Faze3
2 Likes
Hi,
Did anyone attend the AGM?
If yes then can someone please share the notes.
It would be great to hear management’s views on the current scenario and how it impacts the company’s business and growth prospects.
Thanks!
Gross margins of this company is constantly decreasing since FY 23.. In 9 months FY 26 same is mainly due to tariffs.. But other than that no reason why it should decrease.. If anyone has attended agm and clarified by management.
| 9M fy 26 | mar 25 yr | mar 24 yr | mar 23 yr | mar 22 yr | mar 21yr | mar 20 yr | |
|---|---|---|---|---|---|---|---|
| sales | 639.36 | 689.94 | 564.52 | 558.18 | 504.46 | 324.59 | 302.17 |
| cost of ma | 361.77 | 377.83 | 286.65 | 215.84 | 247.42 | 159.78 | 132.5 |
| change | -33.16 | -35.4 | -29.78 | 26.64 | -28.63 | -8.96 | 5.51 |
| cogs | 328.61 | 342.43 | 256.87 | 242.48 | 218.79 | 150.82 | 138.01 |
| % cogs | 51.40% | 49.63% | 45.50% | 43.44% | 43.37% | 46.46% | 45.67% |
| margin | 48.60% | 50.37% | 54.50% | 56.56% | 56.63% | 53.54% | 54.33% |
| empl | 92.42 | 103.65 | 81.85 | 69.23 | 65.19 | 51.29 | 52.26 |
| 14.46% | 15.02% | 14.50% | 12.40% | 12.92% | 15.80% | 17.29% | |
| oth | 170.21 | 163.43 | 139.3 | 152.12 | 140.88 | 74.7 | 78.2 |
| 27% | 23.69% | 25% | 27% | 28% | 23% | 26% | |
| ebitda | 48.12 | 80.43 | 86.5 | 94.35 | 79.6 | 47.78 | 33.7 |
| 7.53% | 11.66% | 15.32% | 16.90% | 15.78% | 14.72% | 11.15% |