In classical Technical Analysis, one of the most reliable topping formation is the Head and Shoulders top. This is very effective in predicting the short term and long term tops and also gives a reliable downside target too.
On the other hand, according to Technical Analysis guru - Walter Deemer, there is nothing quite as bullish as a failed head and shoulders pattern.
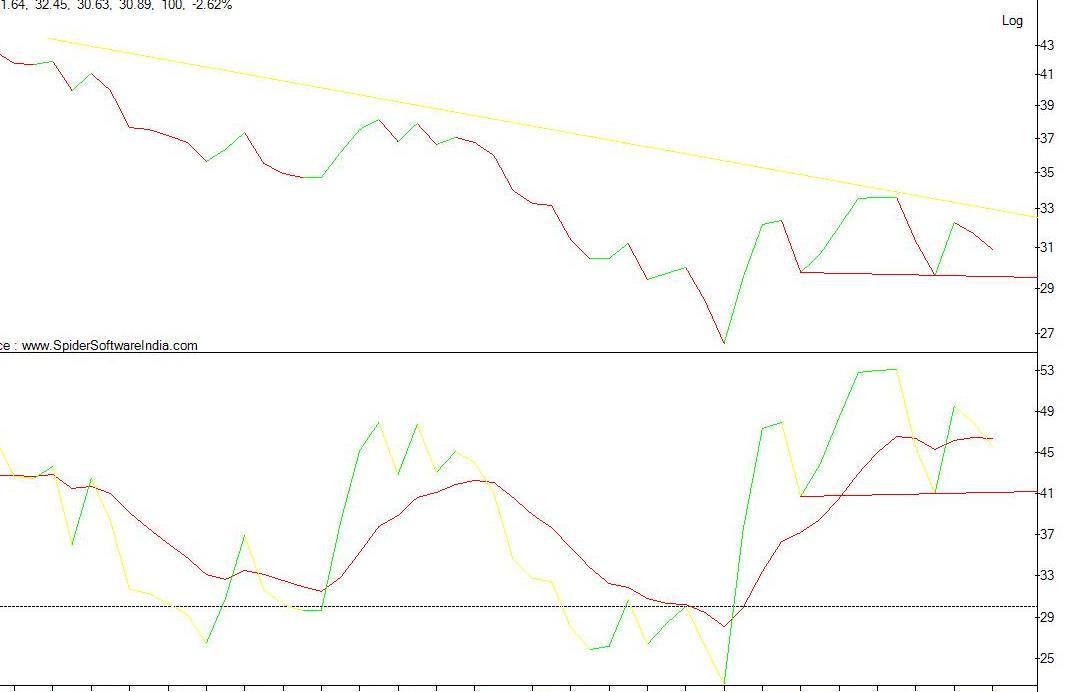
If we look at the daily line chart of the WTI crude, the just below the downtrend line it is forming a short term head and shoulders pattern…The neckline is at 29.60 dollars and if this neckline is broke then the next downside target is 25.60…but if the neckline remains intact and the oil bounces from the neckline (or from a little below the neckline)…then it can be taken as a very bullish signal.
Since RSI is supposed to be a leading indicator…i suggest that the development of the head and shoulders pattern on daily charts of WTI crude can be more appropriately be monitored through RSI indicator…