Hello members, Which company can be benefited with high oil price?
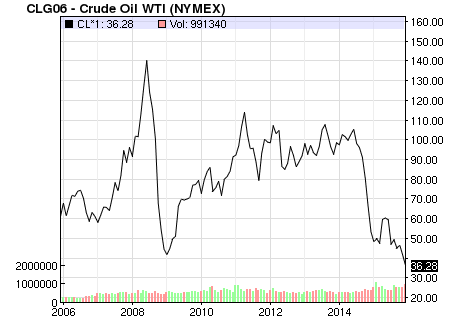
We all know that Crude has came to all time low.And might go lower than that.After all it is a commodity it will comeback and companies related to this sector will shine again.
I think all the Oil transportation and Oil rigging supplier company.and also that oil storage company.
As mention by Mohnish Pabrai in Dhando Investor, he used opportunity like this (lower crude oil price) in his early investing.
Seniors please throw some light on this.
I am tracking Selan exploration , it would benefit from a oil rebound. There are others like Aban offshore trading at a discount to BV but suffer from high debt. Even with Selan , it may have to take on debt if the oil price remains at these levels. It would need capital for its new wells. This could reflect on its stock price. I am waiting for a steeper decline on its stock price to enter.
Regarding oil price rebound : The production is not slowing down . More oil is being pumped by oil rich nations(Saudi, Russia…) to keep their economy afloat, American oil companies are continuing to pump it to service their debt. So the near term oil price is headed lower. What’s not being taken into the equation is gradual scale back or abandoning exploration for new wells. The existing wells oil production will reduce or dry up in time. New operations /explorations take a lot of time to be initiated and developed into mature wells. This will cause a rebound in oil price.
The extent of scale back or closure of new operations depend on the severity of the oil price weakness . A severe short term crash in oil price will help in a quicker rebound of the oil prices to profitable levels.
It would be great if other senior members who actively track oil, selan to provide their inputs.
It will take a while before any uptick is evident. Investing in aban , selan can wait till some upward trend is visible. Also high debt is a concern. Keep on radar- no doubt valuations are attractive but no hurry
According to me lubricant players like castrol, paint shares like kansai nerolac, polyfilm players like uflex, even all the fmcg companies specially bajaj corp .
In classical Technical Analysis, one of the most reliable topping formation is the Head and Shoulders top. This is very effective in predicting the short term and long term tops and also gives a reliable downside target too.
On the other hand, according to Technical Analysis guru - Walter Deemer, there is nothing quite as bullish as a failed head and shoulders pattern.
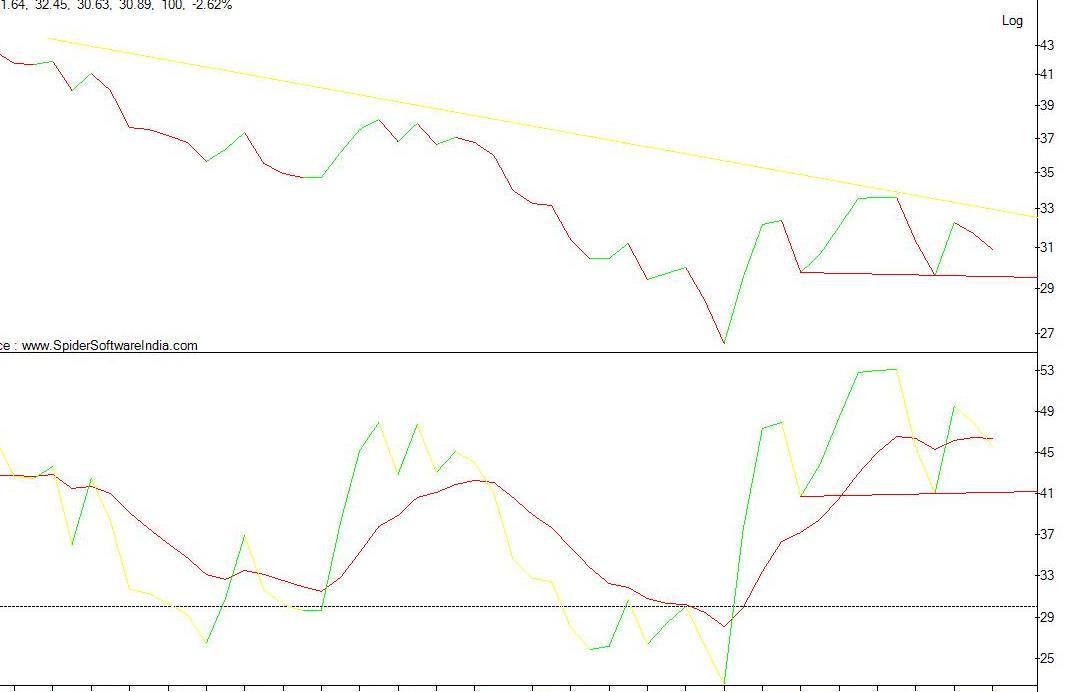
If we look at the daily line chart of the WTI crude, the just below the downtrend line it is forming a short term head and shoulders pattern…The neckline is at 29.60 dollars and if this neckline is broke then the next downside target is 25.60…but if the neckline remains intact and the oil bounces from the neckline (or from a little below the neckline)…then it can be taken as a very bullish signal.
Since RSI is supposed to be a leading indicator…i suggest that the development of the head and shoulders pattern on daily charts of WTI crude can be more appropriately be monitored through RSI indicator…
The price of crude oil now has important implication for Indian market too…Nifty is now corelated with the crude oil price movement…if crude goes down to 25.60, then NIFTY too may go below 7200 or even 7000…
If crude oil rallies, then in the short term NIFTY too goes up…
I have recommended use of RSI indicator for another purpose too…If the Neckline is not broken and RSi bounces from the neckline…then it would mean RSI getting support at 40-41 level…those conversant with the RSI movement ranges in bull and bear market would take this a the first sign in bottom formation of crude oil…
Once RSI finds support at 40-41, then the down trend is over…it may then move sidewaays or prepare for uptrend…
Dear Fatimaji: Your spotting of head and shoulder formation is correct and neck line value is also correct. Still I see 30 as crucial number and it should bounce back from here. Although it Crude is moving in down ward slopping trend line and it has touched this line at 33.62 (recent high) and started coming down. Unless this trend line is broken, it will maintain bearish bias.
Looking to international scenario, Venezuela has again taken lead to unite OPEC and non-OPEC countries as their survival is at stake now. There are several other small countries surviving on crude and are likely to exert pressure on OPEC.
Thus I see more chance of revival in crude as recent low of 27.56 was over reaction based on redemption pressure from leading hedge funds as well as algorithm based triggers from London and US based players.
Sugarbull: Yesterday WTI crude fell and touched the neckline…it then closed just above the neckline Kline @29.69. Today it has bounced to above 30 level.
Now it it again falls to the neckline, then that would lead to a bullish divergence on daily RSI…that too just above the neckline / support line…For me that would be a very bullish signal and marks the short term bottom atleast.
I still feel that WTI crude may go below 26 dollars in the next 1-2 weeks…but I will let the market decide and follow the market, instead if leading the market.
I am now posting the daily price chart of Indian crude…just to show how precariously it is sitting on the neckline…next 2 -3 days are very crucial for crude oil…Uploading…
WTI crude oil broke the neckline and fell to 26.10 USD…It is now in a pullback to the neckline. It touched the neckline and closed just below the neckline. Now, if it again starts falling, then in classical chart analysis, that would be taken as a confirmation of the head and shoulders pattern and the point most traders will build up hugely shorts.
This any correction in the WTI in this week may then push it below 26 or even much lower level.
On the other hand, if WTI crude rises above the neckline and overcomes the strong resistance @30.50 USD, then it may even cross the downtrend line and go above 32.50 …towards 34.50 …and even 38 level. In such an event the budget rally on NIFTY would get extended to end of march or April
The Stressed-Out Oil Industry Faces an Existential Crisis:
The Saudis may go public, OPEC’s in disarray, the U.S. is suddenly a global exporter, and shale drillers are seeking lifelines from investors as banks abandon them.
Welcome to oil’s new world order, full of stresses, strains and fractures. For leaders gathering in Houston next week at the IHS CERAWeek conference – often dubbed the Davos of the energy industry – a key question is: what will break first? Will it be the balance sheets of big U.S. shale companies? The treasuries of Venezuela and Nigeria? The resolve of Saudi Arabia, whose recent deal with Russia to freeze output levels offered the first hint of a rethink?
After watching prices crash through floor after floor in the worst slump for a generation, the industry is eager for answers. Insiders say it’s not too hard to visualize what markets might look like after the storm – say five years down the line, when today’s cost-cutting creates a supply vacuum that will push up prices. But it’s what happens in the meantime that’s got them scratching their heads.
“This is a weird thing for a market analyst to say because it’s usually the opposite case, but I have more conviction in my five-year outlook than my one-year outlook,” said Mike Wittner, head of oil market research for Societe Generale SA. “Maybe I’m letting my head get turned upside down by the last couple months.”
SQ:
Brent dropped for a second day as Russia signaled Iran won’t join major producers in freezing output to manage a global glut.
Futures lost as much as 2.2 percent in London after falling 2.1 percent Monday. Iran has “reasonable arguments” for not joining an alliance to cap production now, Russian Energy Minister Alexander Novak said after meeting with his Iranian counterpart. Talks on the freeze are most likely to occur in Qatar’s capital Doha next month, according to Gulf OPEC delegates. U.S. stockpiles probably expanded last week, keeping supplies at the most since 1930.
Technicals: If we see daily chart of last one year of WTI, we can see that crude has just touched the downward slopping trend line and started going down. There might be some penetration across trend line, but not real break out. If break out is confirmed than we can build up position in crude based ETF, otherwise it might be blocking of fund.
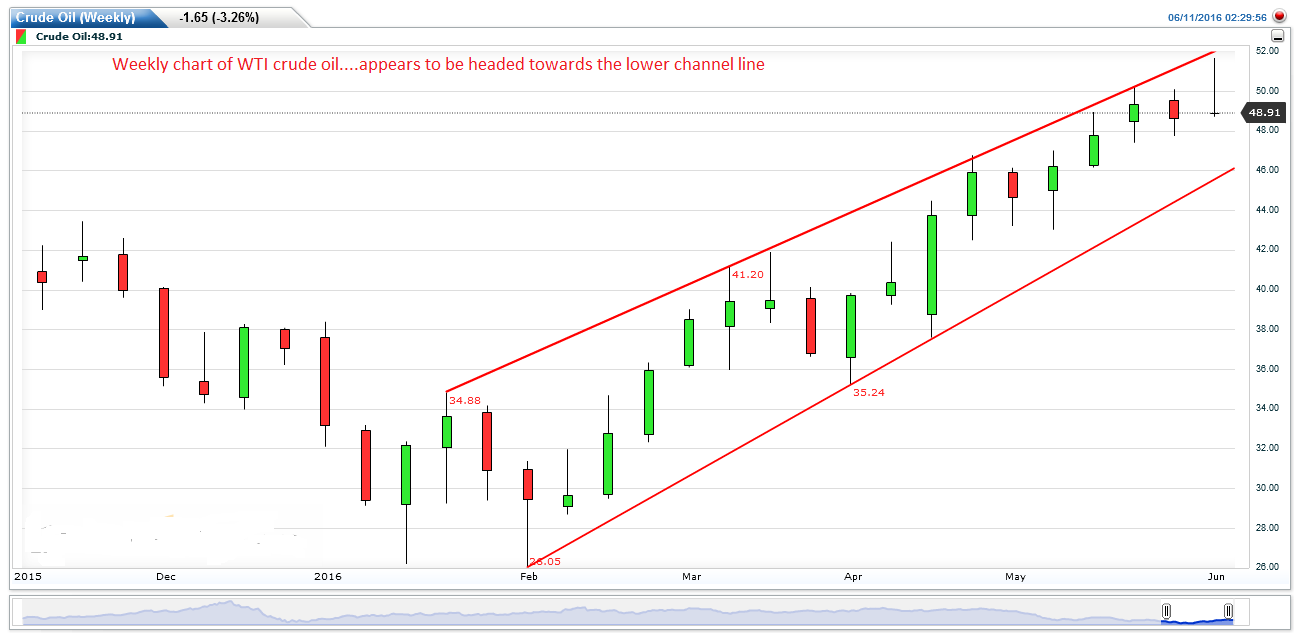
Those conversant with the Japanese candlestick technical analysis would recognise the last bar on weekly charts as Gravestone doji… a very bearish formation…
It indicates indecision at the top / after a big rally… now all that is left for the market is to fall steeply…
If next week wti forms a long red candle, then it signals the end of crude oil rally… and as oil falls, NIFTY too may fall quite steeply.
As anticipated the WTI crude has fallen steeply and the NIFTY too is down…from the daily chart of WTI CRUDE it definitely appears to be the beginning of the downtrend in crude…
Why is it that NIFTY falls when the crude oil prices are down? Should it not be the other way round?
I understand that fall in crude oil prices is due to decrease in global demand and also that it affects the oil exporting nations, but is it not actually beneficial to India which is a major oil importing nation. I think that India, being a consumer led economy, should benefit whenever there is a fall in oil prices (the lower the oil prices, the better it is). Kindly request the board members to clarify on this.