Can low volatility outperform benchmarks over the long term with lower risk? I have always liked the idea of investing in low-volatility stocks. The main allure was the index plus returns with much lower volatility. Obviously, the downside is that during bull runs such a portfolio will significantly underperform the index but will make up for it during the bad times.
I have decided to try out my hand with low-volatility stocks which are trading close to their 3-year highs. I have invested in the following stocks as of 2nd Jan 2023 and would do a monthly rebalance for the same:
Why put so much effort into this? NSE has introduced low volatility related indices and there are ETF available for tracking the performance too. One of NSE low volatility indices is NIFTY 100 Low Volatility 30 - https://www.niftyindices.com/indices/equity/strategy-indices/nifty-100-low-volatility.
In this link given, you have the research paper and methodology as well as constituents of the index. ICICI ETF is one of the popular one under this category. There are other strategical indices too for exploration.
NSE indices are primarily focused only on the large-cap index which leaves out the opportunity for other stocks. Next, they rank purely on basis of low volatility which I am not comfortable with - a second layer of momentum i.e. close to their highs is a good parameter for excess returns. The book “High Returns from Low Risk” by Pim Van Vliet has good literature on this approach.
Overall, I want to have a conservative portfolio with first layer of low volatility and second layer of 3-year high based momentum aspect.
I like this idea of investing in low volatility stocks and will follow your updates diligently as I too was looking for something similar.
However why do a monthly rebalance? And on what basis will you do the rebalance.
Volatility defined this way will lead to exclusion of stocks which are rising in favour of stocks which are stuck in a range. One can just create a portfolio of non-cyclicals such as Pharma+ FMCG + Utilities and broadly get the same result. As regards downside protection, even during corrections the strongest stocks usually fall the least (or bounce back the quickest). The endeavour should be to reduce volatility at the portfolio level and not necessarily of individual stocks. Stocks with high volatility but uncorrelated (or even negatively correlated) with each other can be combined to create a portfolio which has lower volatility than its individual components, while letting one capture the full upside in individual stocks. Just my thoughts…
Monthly rebalancing is just to check that if volatility increases drastically in any of the stocks then that is replaced. I don’t expect a huge churn but this prevents us from holding something which has gone into a high-vol regime.
Overall the strategy is to keep a stock if it is within the top 40 ranks to give it some wiggle room. However if it falls from top 40 then we have to replace it
Not necessarily. Rather this is focusing on stocks that are rising without significant deviations on either upside or downside. The way it is defined it looks for stocks that have steady price movements. The rest of the things that you mentioned have quite a bit of discretionary input which I am not comfortable with at all. To build a lower volatility in a portfolio mathematically at least, we would have to deploy a minimum volatility matrix-based allocation which takes the correlation of volatility between different stocks in a portfolio for allocation. While that is a novel strategy the backtests in different papers have shown that it doesn’t differ much in terms of returns with low-volatile portfolio which has a momentum wrapper.
I am not saying that what you are proposing is wrong. It’s just that I want a proper entry-exit model which incorporates low volatility and close-to-high momentum. These rules work for me to be able to stick with them during the good and bad times.
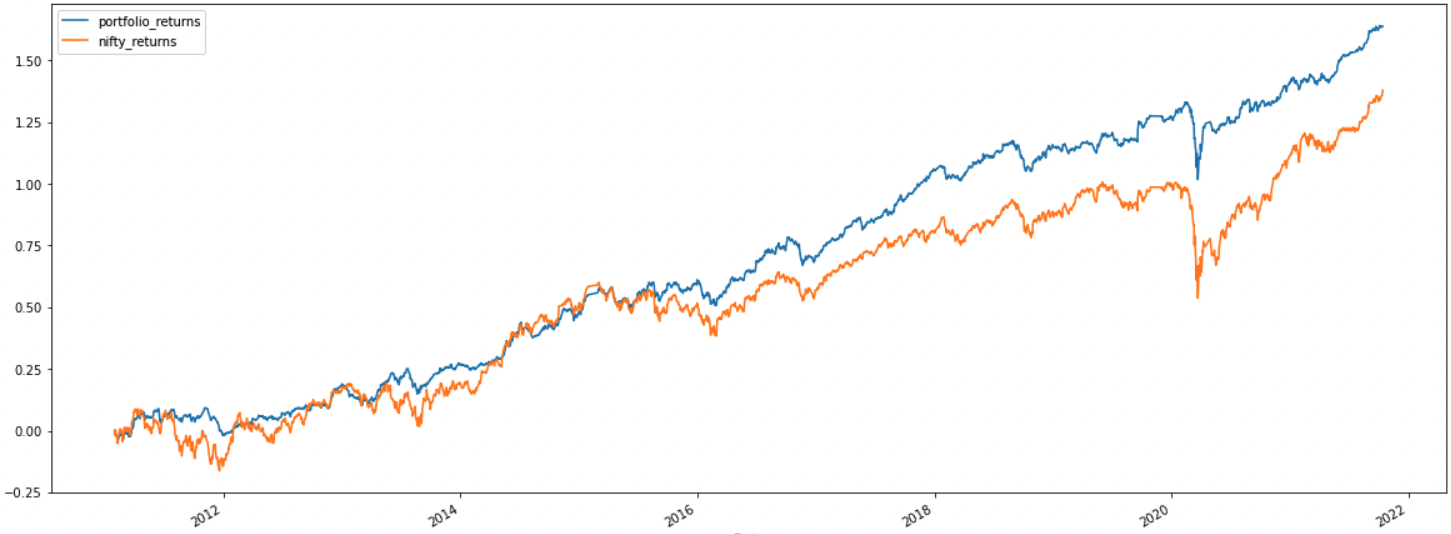
Backtest Period:- Jan 2011 to Oct 2021
Benchmark:- Nifty 50
CAGR:- 12.75%
Annual Volatility:- 11.01%
Beta:- 0.47
Sharpe Ratio:- 1.37
Omega Ratio:- 1.29
Sortino Ratio:- 1.92
Max Drawdown:- 27.98%
Disclaimer:-
This is not an investment advice. The above data has represented for study purpose only. I am not SEBI approved investment advisor.
The above data is prone to calculation mistakes, inaccurate data etc.
This looks interesting concept.
I have been also thinking of focusing on low volatile stocks for quite some time, but have not implemented this idea.
I have a simple criteria. I look for stocks which have fallen least during tough times like 2018, 2019 and Covid crash.
By looking at screener, you will realize that, there are stocks like HDFC Bank, TCS, V-Guard, Marico and many others which have low drawdowns during 2018 and 2019, and have generally performed well even after that.
Mostly these will be Large Caps. I may start working on this concept in near future.
Such a portfolio will not give massive returns during bull markets but will protect the downside during markets like 2018 and 2019.
With low volatility approach, one would tend to invest in stocks with either Low SD and/or Low Beta.
It will result into a portfolio with Asian Paints, Pidilite, HDFC Bank, Kotak Bank, TCS, HCL TECH, Marico, V-Guard, VST Industries and many others. Stocks like IDFC FIRST Bank, Yes Bank, Laurus Labs, NMDC will be out due to their high SD and Beta. This kind of portfolio would be high quality stocks.
Most of these are good compounders. This approach will not able to detect future compounders as an investor will reply on historical data.
But even with this approach, I can see that, an investor would have compounded his/her portfolio with much higher returns than Index.
I am not sure whether back testing can be used to prove that, low volatility investing can result into good returns with lower risk all the time. Mostly returns will be less in years like 2007, 2021 but it will protect the downside in years like 2008, 2020, 2018-19.
I am analyzing such stocks for my study. Currently I am investing in all kind of stocks, but I allocate more to stocks with Low SD and/or Beta, and less to stocks which are volatile. If SD/Beta is very high say SD > 15, avoid such stocks.
I do not have investments in all the stocks mentioned.
I guess, then the approach towards such stocks should be mathematical, and one does not need to do any kind of FA. Have some process in place, based on numbers, enter, adjust/exit as per the set rules, just like a factor based index. If this is indeed true, then the return too could be similar to that of an index, probably more than Nifty, but not probably more than 25%.
One can look at factor based indices, but these too are not perfect, sometimes the definitions could be arbitrary, and may not repeat the back tested results.
No interest in investing in stocks based on these kind of ideas, yet. Just saying.