What Does Company do?
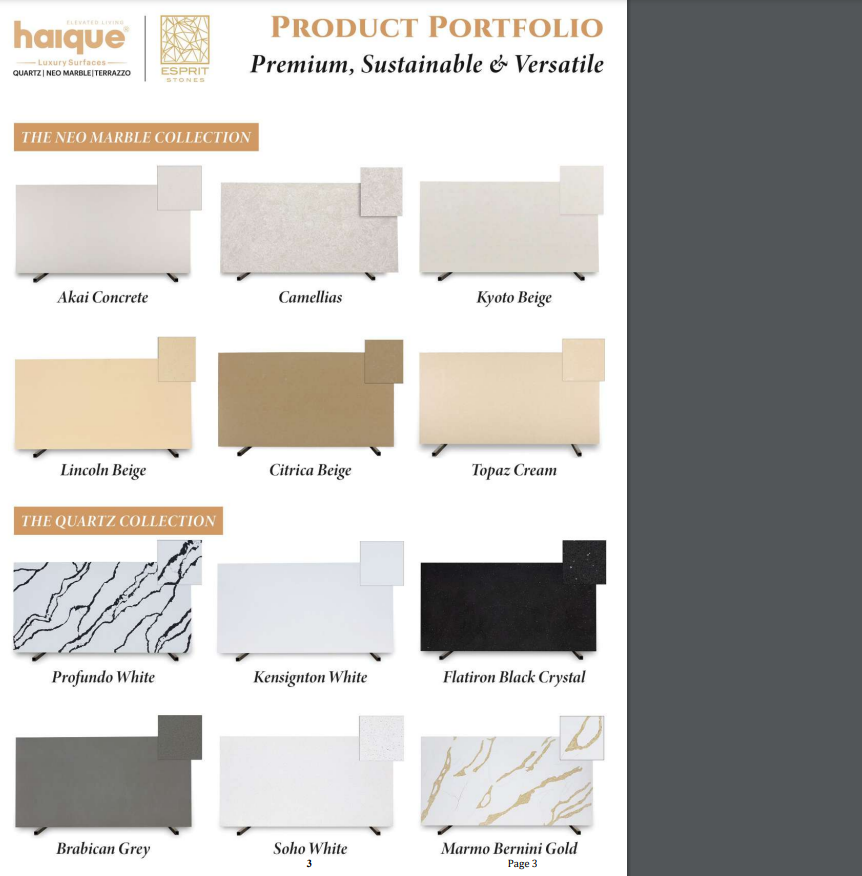
Company manufactures engineered quartz surfaces and, through its subsidiary HSPL, produces engineered marble surfaces. They are a leading player in the engineered stones market in India.
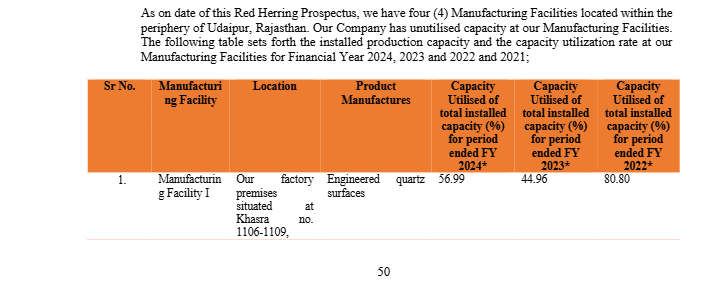
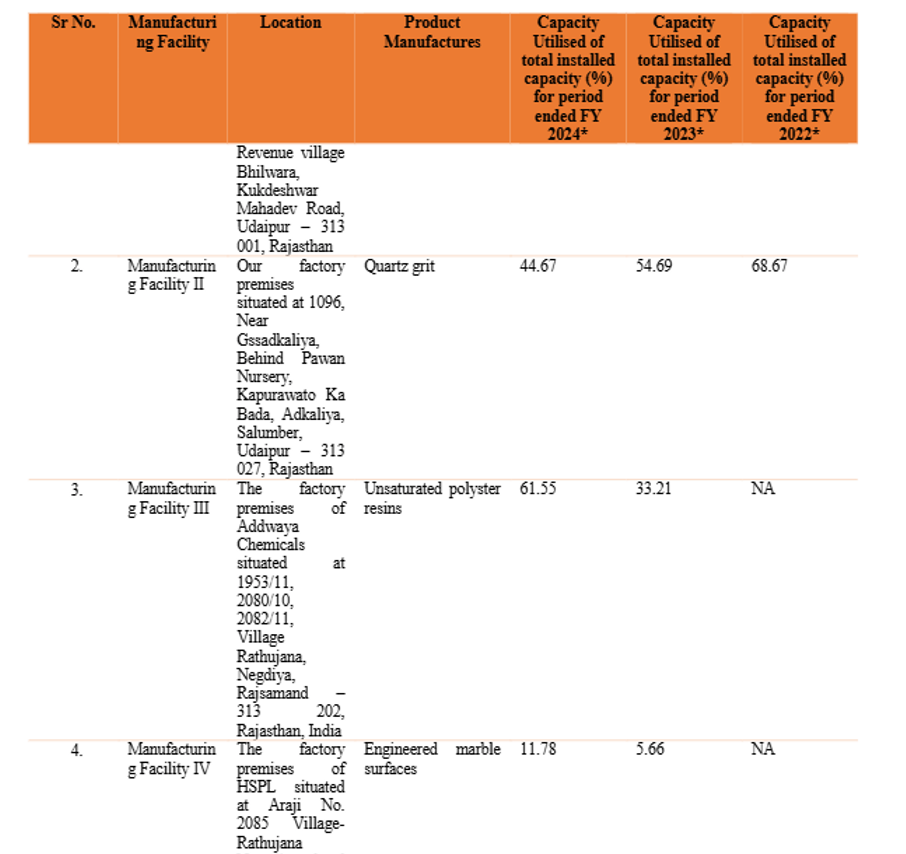
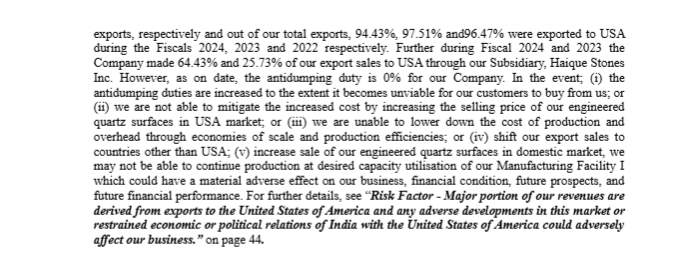
Large unutilized capacity and strong demand from USA for Quartz because China has 300% Anti dumping duty in US where as India has almost 0.
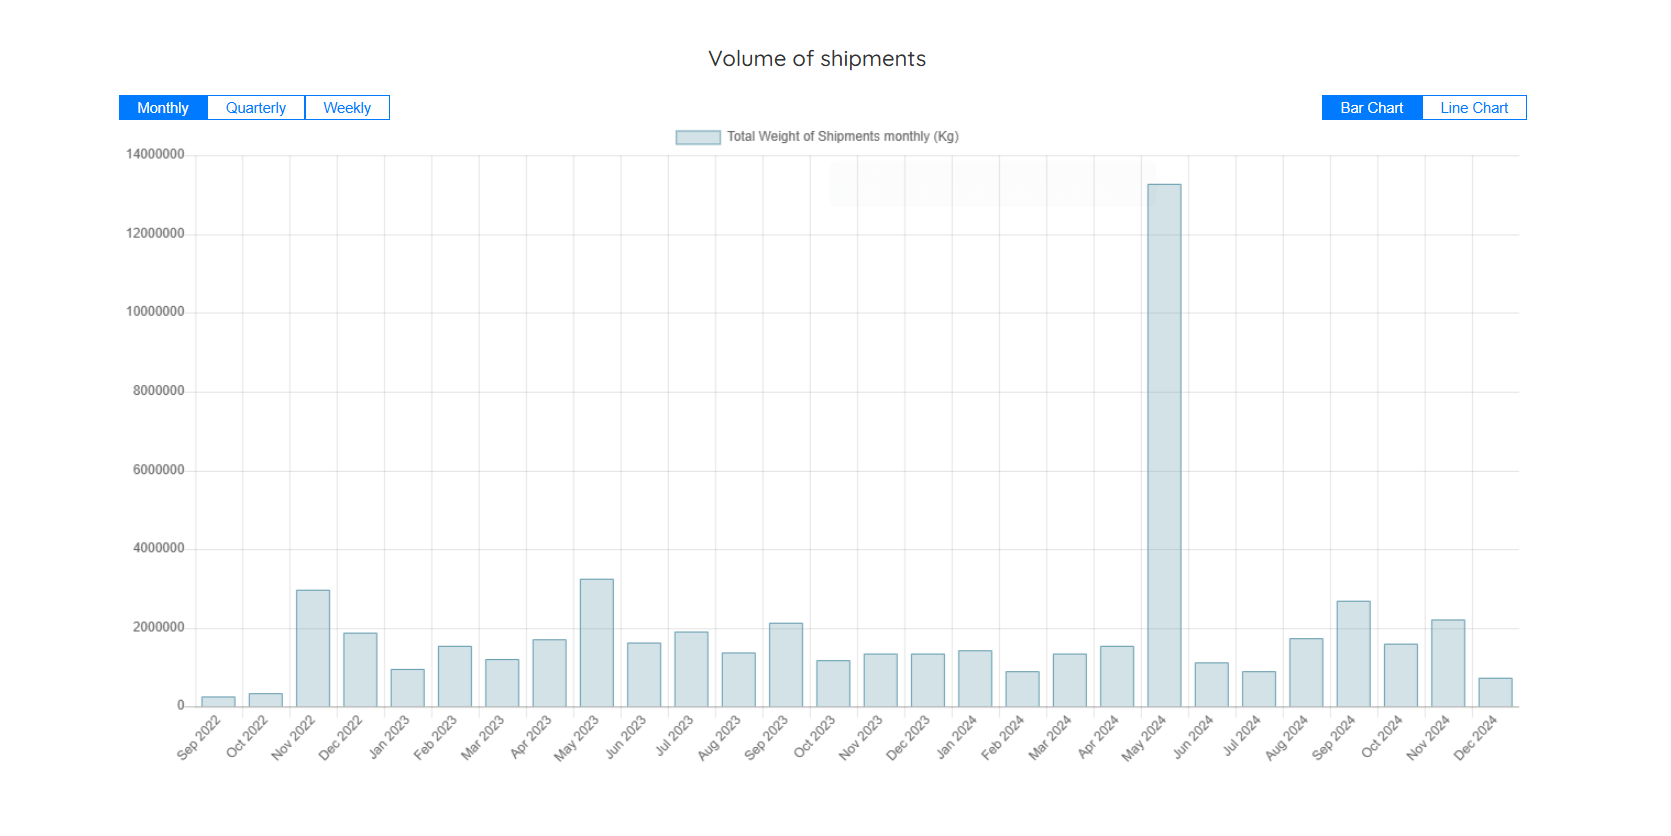
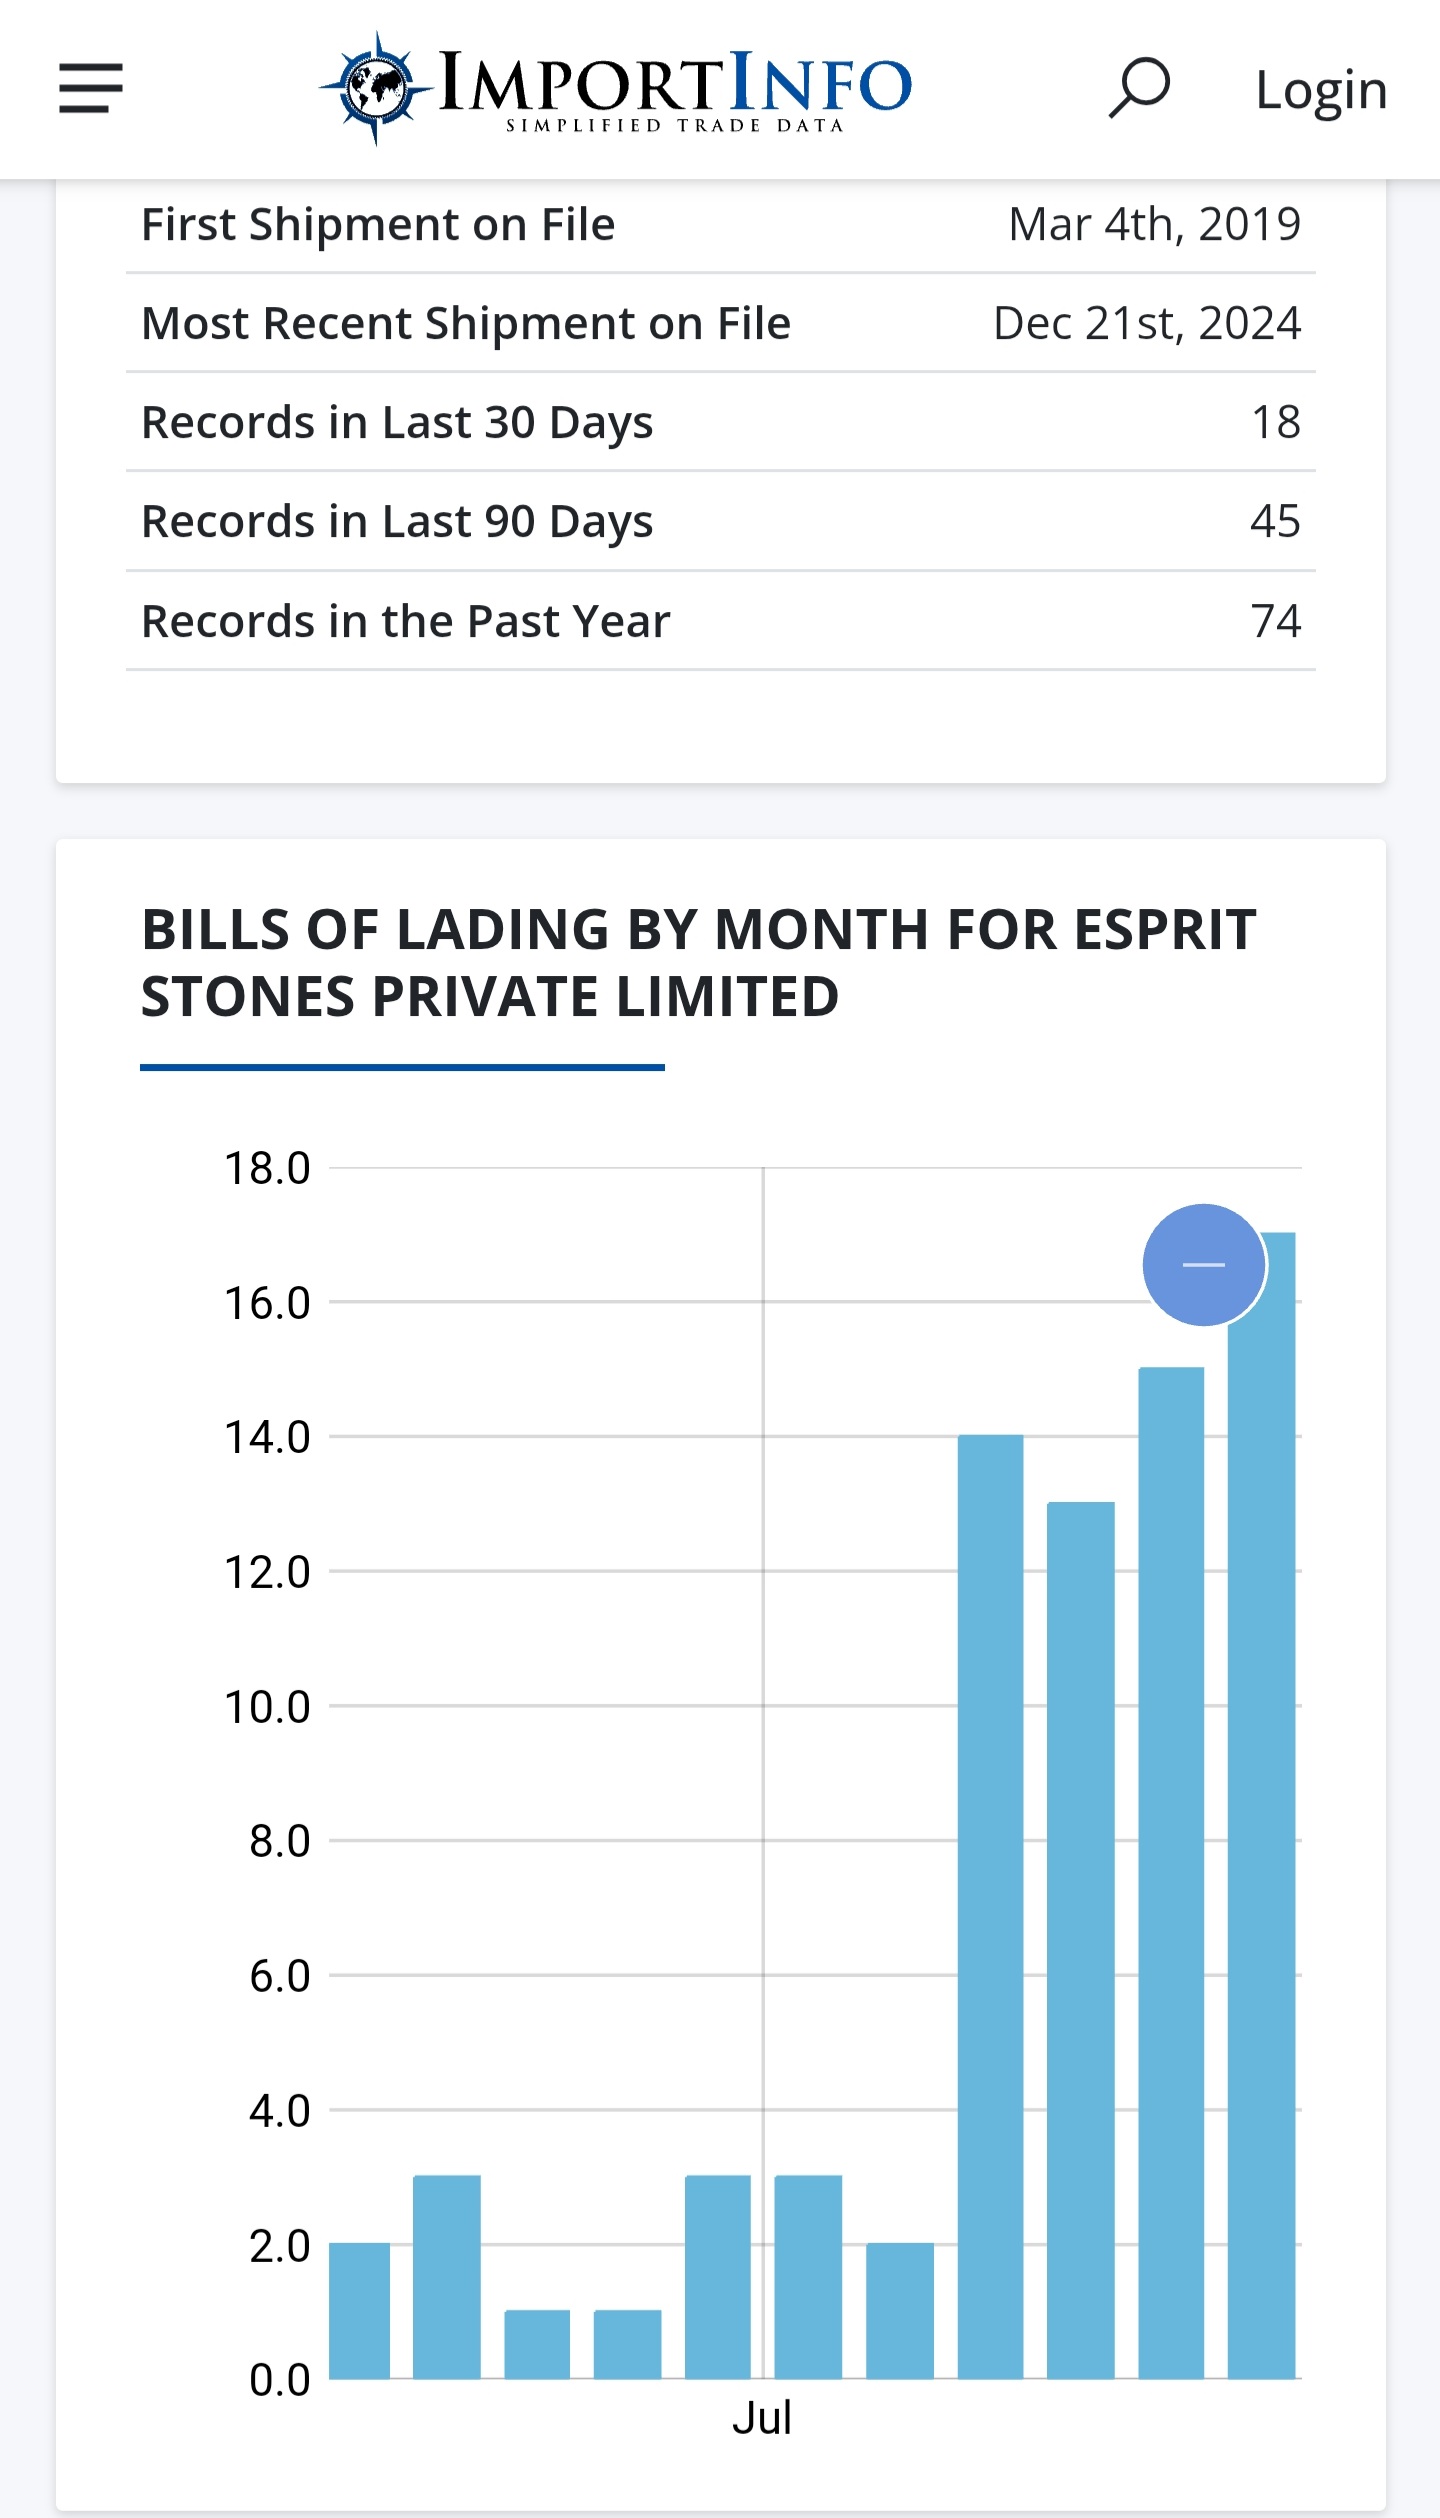
Strong demand is also seen in export volume in recent months.
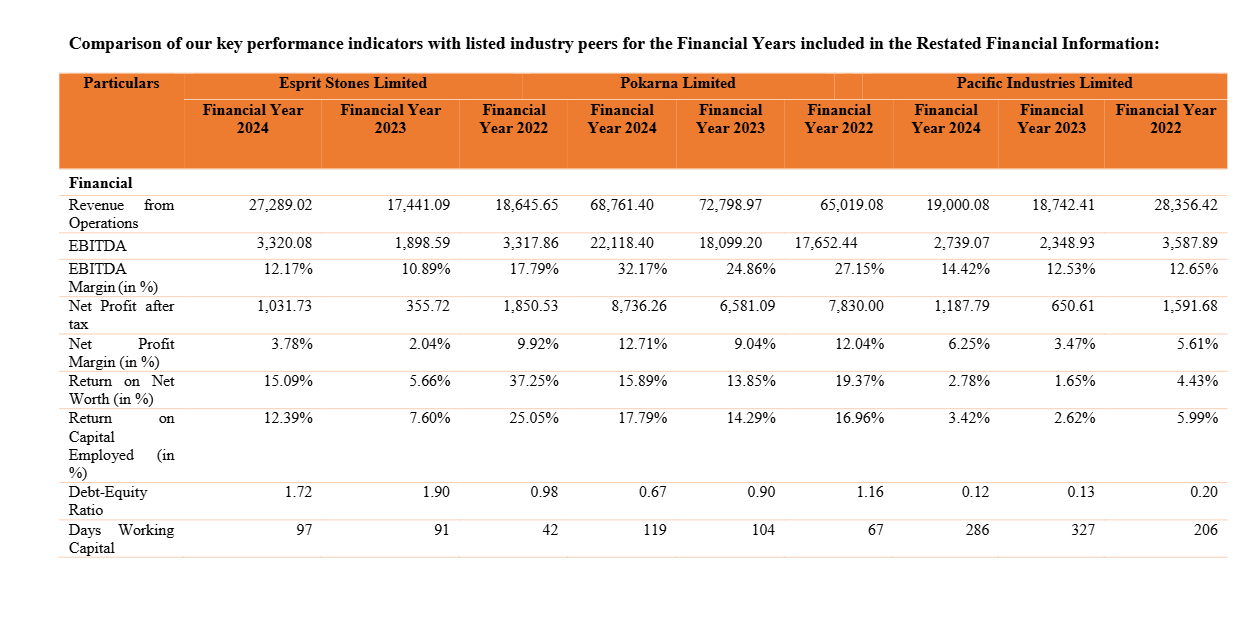
Currently 57% capacity is utilized for Quartz manufacturing facility which accounts for about 170 cr which means 100% capacity utilization would roughly equate to 300cr. If we consider 90% utilization then we get 270cr from Quartz facility alone. Assuming that revenue from other segments remain the same to be on conservative side, we can add another 100cr and thus we get a total revenue of 370cr. In 2022 they had 80% capacity utilization for Quartz and had roughly 10% PAT Margin. If we assume PAT margin to be 12% (improvement possible due to backward integration which is recently commissioned and potential improvement in marble unit utilization) then we get PAT of 44cr and at 20 PE we get a market cap of 880cr vs current market cap of 240cr.
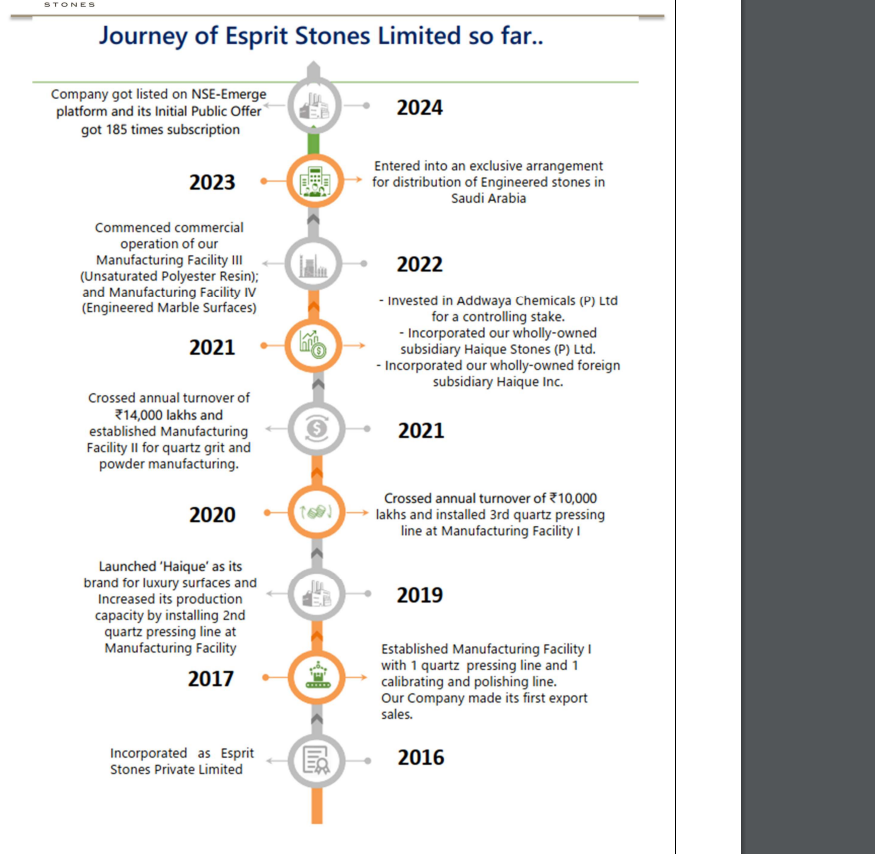
Recently company entered into agreement with large distributor in Saudi.
Madhu Kela’s fund Founders Capital is one of the anchor investors.
Risks
Tarif related risks. Anti Dumping Duty and Countervailing Duty can be imposed any time specially with new admin.
Both geographical and client concentration is high.
Data available is less because its an SME and it is listed in 2024
Esprit Stones Limited approved the financial results for the year ending March 31, 2025.
Consolidated
YoY FY25 vs FY24
Revenue Up 18% At ₹321.48 Cr Vs ₹272.89 Cr
Tot. Rev Up 18% At ₹323.98 Cr Vs ₹274.78 Cr
Expenses Up 16% At ₹301.90 Cr Vs ₹260.68 Cr
PBT Up 57% At ₹22.08 Cr Vs ₹14.10 Cr
PAT Up 67% At ₹17.20 Cr Vs ₹10.32 Cr
Net Profit Up 67% At ₹17.20 Cr Vs ₹10.32 Cr
EPS (Basic) Up 24% At ₹7.83 Vs ₹6.29
EPS (Diluted) Up 24% At ₹7.83 Vs ₹6.29
HoH H2FY25 vs H1FY25
Revenue Down 0% At ₹160.57 Cr Vs ₹160.91 Cr
Tot. Rev Up 0% At ₹162.30 Cr Vs ₹161.68 Cr
Expenses Down 1% At ₹150.51 Cr Vs ₹151.39 Cr
PBT Up 15% At ₹11.79 Cr Vs ₹10.29 Cr
PAT Up 20% At ₹9.39 Cr Vs ₹7.81 Cr
Net Profit Up 20% At ₹9.39 Cr Vs ₹7.81 Cr
EPS (Basic) Up 1% At ₹3.93 Vs ₹3.90
EPS (Diluted) Up 1% At ₹3.93 Vs ₹3.90
YoY H2FY25 vs H2FY24
Revenue Up 25% At ₹160.57 Cr Vs ₹128.67 Cr
Tot. Rev Up 25% At ₹162.30 Cr Vs ₹129.62 Cr
Expenses Up 21% At ₹150.51 Cr Vs ₹124.24 Cr
PBT Up 119% At ₹11.79 Cr Vs ₹5.38 Cr
PAT Up 126% At ₹9.39 Cr Vs ₹4.15 Cr
Net Profit Up 126% At ₹9.39 Cr Vs ₹4.15 Cr
EPS (Basic) Up 54% At ₹3.93 Vs ₹2.56
EPS (Diluted) Up 54% At ₹3.93 Vs ₹2.56
Few things to note:
Recent tariff scenario has been in favor of Indian players with high tariffs already in place. China US deal if realized can be a risk but not too likely yet.
Trump has recently mentioned that India has offered practically 0% tariff in exchange of a trade deal. If India is chosing to do this than it will again be beneficial for Esprit as it might relax taxes some more.