
I’ve spent last the last few months understanding the whole energy theme and its first order effects. This post unifies my learnings in a single place. Even though, I’ll share some stocks towards the end that I’m investing in, the larger aim is to share my understanding and invite healthy feedback and gaps that still exist in my knowledge.
Please note that it may not be possible to absorb all this content in a single go. It may take days because it’s highly technical and it took me months to connect the dots (i’m a B.Tech grad in CSE from IIT Dhanbad and would describe myself a nerd).
Basic terminology
1 unit of energy = 1kwh, where kw stands for kilowatt and h is hour.
watt is a unit of power which is defined as rate of energy production (per unit time)
kw = 10^3 watt, mw = 10^6 watt, gw = 10^9 watt, and so on.
AC = alternating current, DC = direct current.
CUF = capacity utilization factor in %, measures how much of capacity of plant is used when averaged over the year.
PLF = plant load factor in % (same thing as CUF)
PV = solar photo voltaic (cell/module)
RE = renewable energy
RPO = renewable purchase obligations for DISCOMs
LFP = lithium iron phosphate battery
LCOE = levelised cost of electricity. it’s the generation cost per unit averaged over a long span like 1y
VGF = viability gap funding scheme of government
Power generation
Energy from nature or its resources is harnessed and converted into electricity. The mechanisms of conversion are different depending upon the source like rotating a turbine or running an engine. Except solar, all these will include rotating a magnet around a coil of copper wires at some stage. This is called an alternator (or generator) which generates AC.
Humanity designed power generators to produce AC because the voltage of AC can be stepped up or down using transformers. This isn’t possible with DC. While transmitting energy over long distances via cables, the rate of energy loss is inversely proportionaly to voltage. Hence at higher voltage, losses are very low.
AC and transformers were both invented by Nikola Tesla.
An important aspect of power generation is frequency synchronization with grid. The AC current in the grid has a certain frequency and the power generated from source must also be in the same frequency. Sources that generate power with alternator are called synchronous while solar is asynchronous because it doesn’t use that. Instead the generated power has to follow the grid frequency via feedback making it slightly unreliable. In presence of sudden spike in load (power demand), the transmission system can crash causing a large grid failure. Sometimes expensive software inverters and other feedback based equipments are needed with async sources to manage this unreliability problem. Wind is also async but for a different technical reason which i’ll skip in this post.
When you setup a power plant, you have to setup everything - turbine/engine, generators, transformers and cables to nearest substation. Once the power reaches this substation, the central power grid (more on this later) will deliver it to the customer who purchased that power.
The capacity of power plant specified on paper is its max capacity. Most of the plants utilisation rates are much lower. It is calculated as CUF % (see glossary). Renewables are obviosuly much lower than traditional sources due to unpredictable and intermittent nature of fuel (sunlight/water/wind).
CUF values of different power sources:
| Source | CUF in Inida | Notes | |
|---|---|---|---|
| Solar PV | 21-24% | High irradiance and less cloud days in deserts of Gujarat/Rajasthan can take it to 24%. | |
| Wind (onshore) | 21% | Seasonality is strong; annual average is near low‑20s | |
| Hydro | 32-38% | Rainfall‑driven volatility | |
| Coal | ~70% | ||
| Nuclear | > 85% | The best among all sources |
This will help you understand India’s present energy mix (2025):
| Source | Installed | Actual (avg.) | Actual contribution |
|---|---|---|---|
| Thermal | 250 GW | 175 GW | 70% |
| Renewables (solar, wind, biofuel) | 190 GW | 37 GW | 20% |
| Hydro | 52 GW | 16 GW | 6% |
| Nuclear | 8 GW | 7 GW | 3% |
| Total | 500 GW | 237 GW |
As you can see the actual energy generation is less than 50% of paper capacity and it will keep on decreasing as we scale up solar’s share in the mix. Despite that, India is not energy deficient. We are net exporter of electricity (to Myanmar, Bangladesh). Below graph shows the demand side of the equation, the peak demand was 270 GW in May 2025 (12% yoy growth).
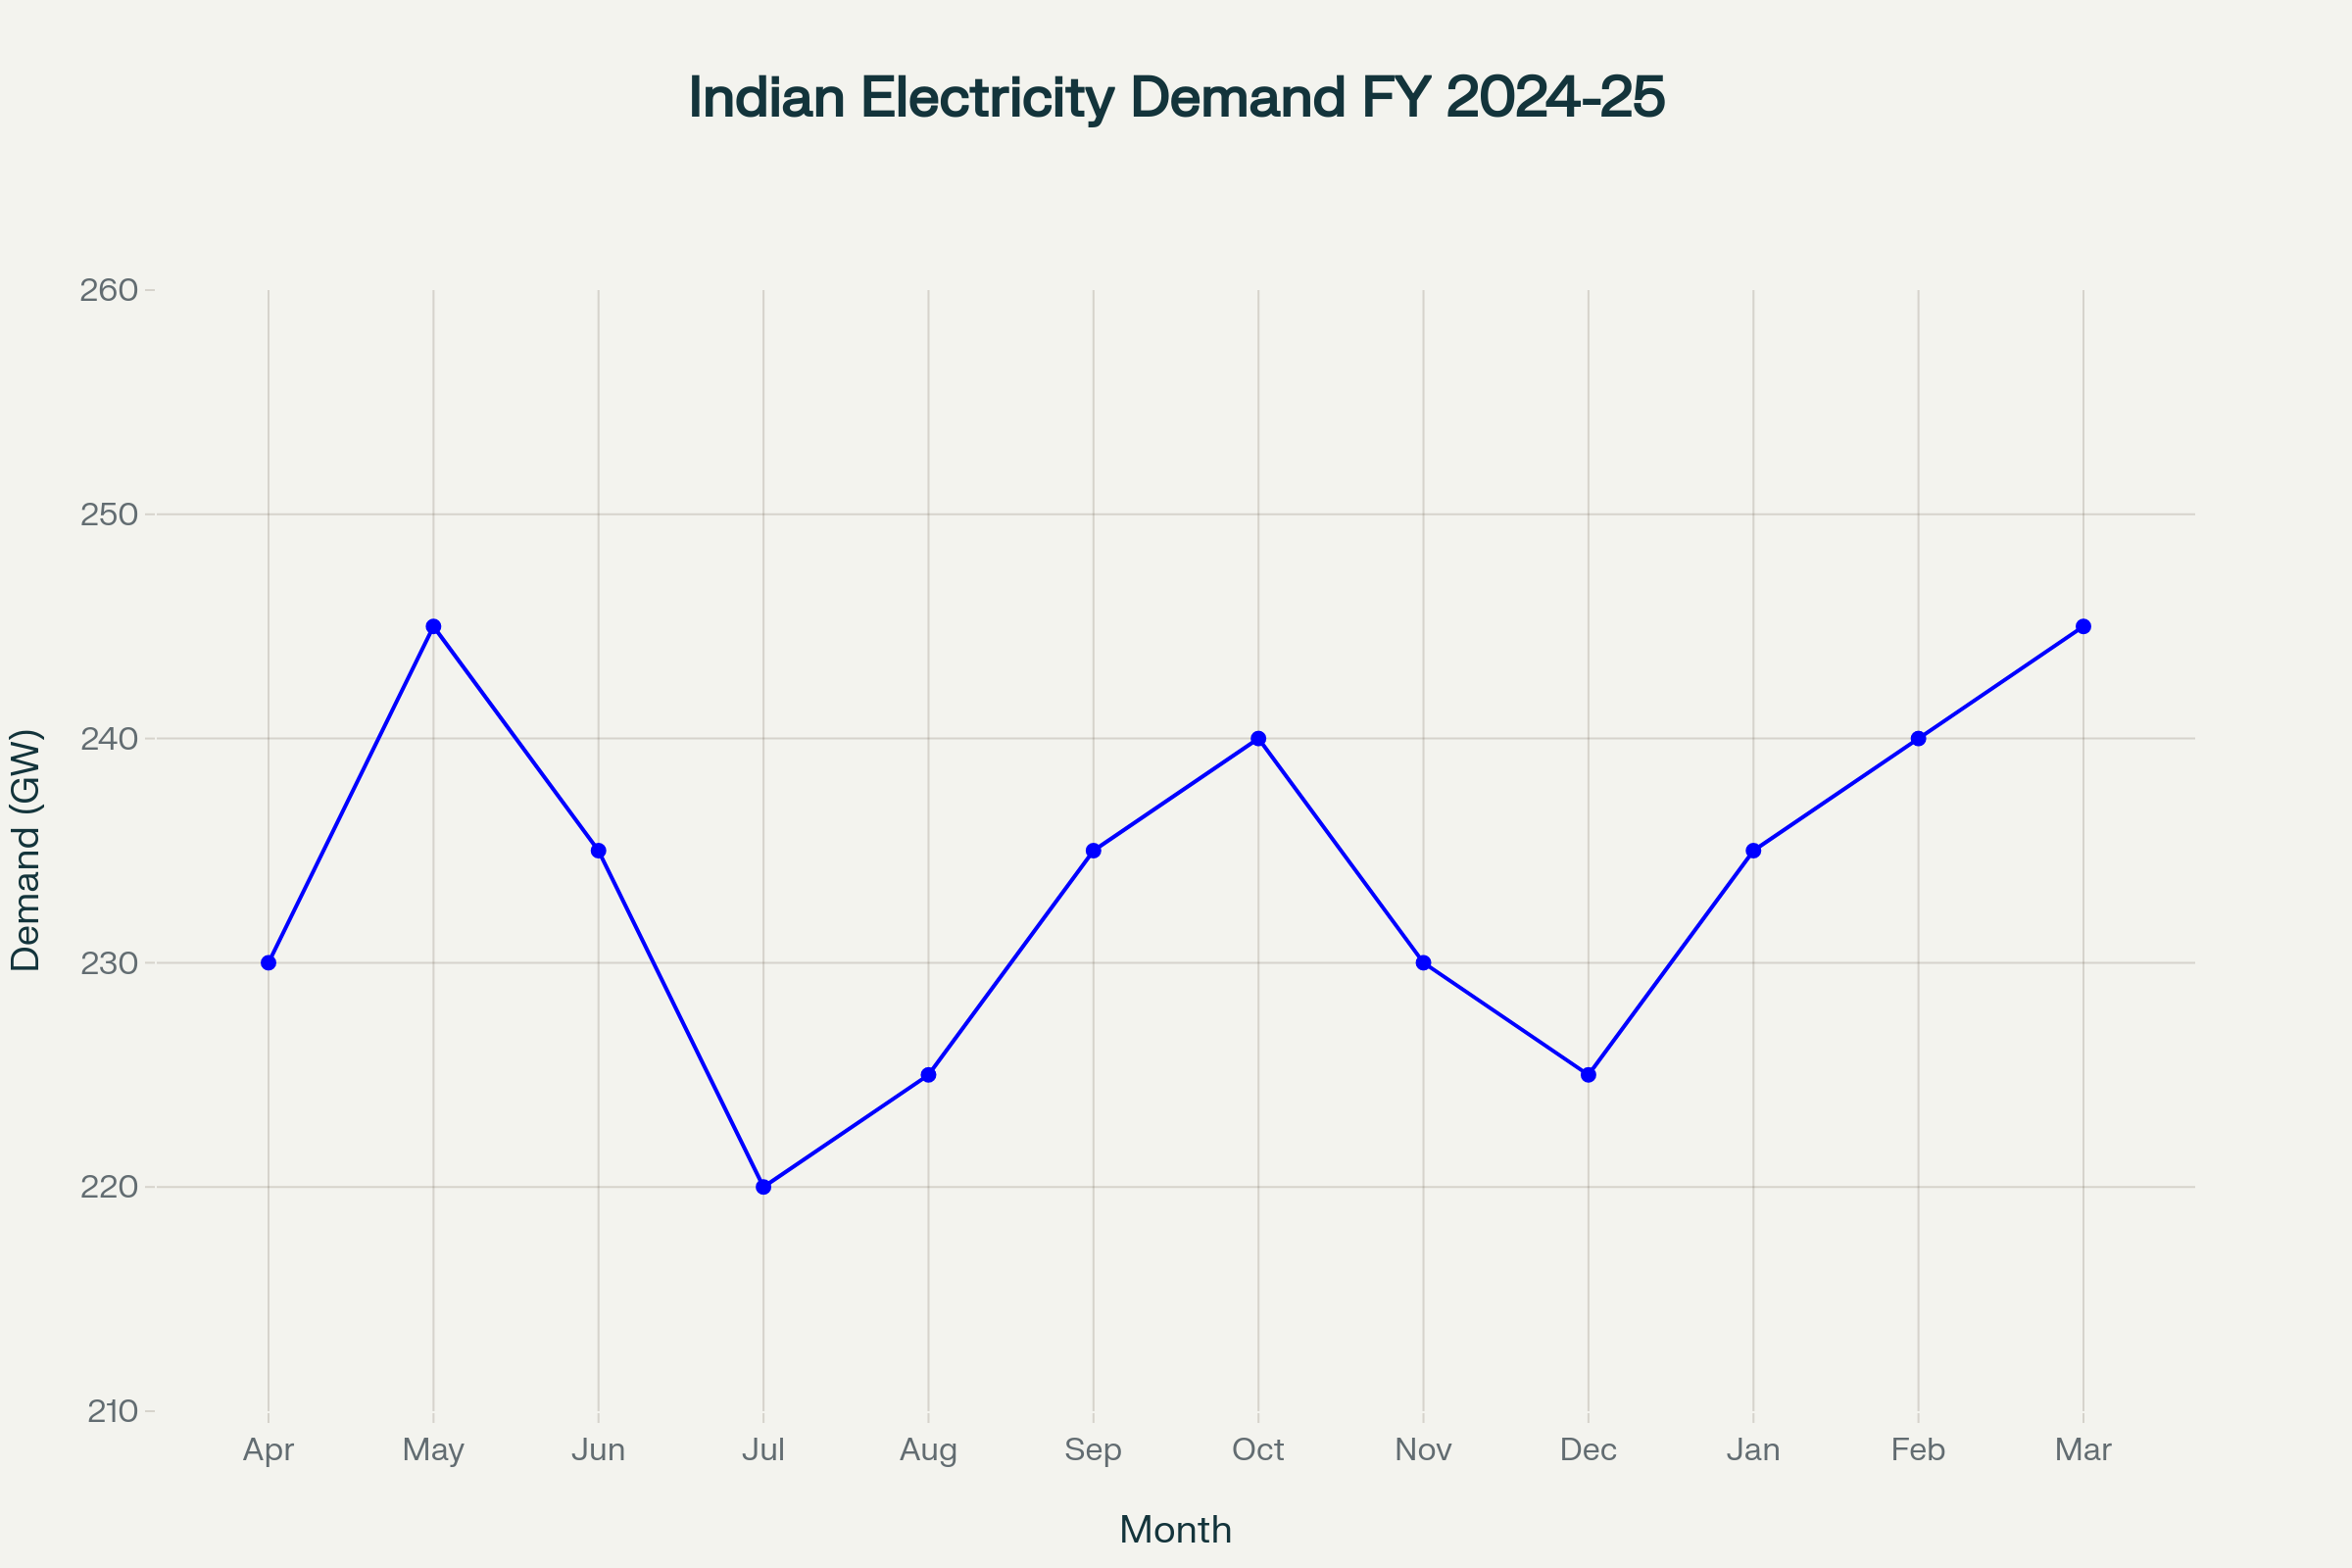
The peak demand happens always in summers (air conditioning) and winters (heating in north). Annual growth rates for avg. electricity demands are ~10%.
Now let’s visit each power source in detail with its future in the Indian Energy mix.
Solar
The fastest growing energy source around the world because of decreasing costs and increasing efficiency of PV cells. The cheapest source of energy today and costs are going to fall further in future. Current tariffs are ₹2-2.2 /unit and it has come down from ₹3 /unit few years ago. Solar cells are primarily of 3 types in the current market:
| Module Technology | Manufacturer Origin | Typical Efficiency | Estimated Price (INR/Wp) |
|---|---|---|---|
| Mono PERC | India | 20.5% – 21.5% | ₹19 – ₹21 |
| China imported (tariff inclusive) | 21.0% – 22.0% | ~₹10.16 | |
| TOPCon (n-type) | India | 22% – 23% | ₹24 – ₹26 |
| China imported | ~23% | ~₹11.00 | |
| HJT (n-type) | India | 24% | ₹27 – ₹30 (est.) |
| China imported | 24% | ~₹15.54 (est.) |
Chinese modules are almost 50% cheaper despite the high tariffs. Some companies are even dumping at cost price to maintain volume. The new solar parks are using Indian modules purely because of ALMM which restricts government entities to purchase power from solar parks which use indian manufactured cells.
Personal opinions(commentary)
-
Because the price differential is so high, I’m reluctant to invest in solar manufacturing companies (Waaree, Premier energies, etc.) as I’m not sure for how long the government will be able to protect them. Chinese benefit from tech advantage on backward integration - sand to polysilicon, wafers, etc. They own the full value chain unlike our companies.
-
The Indian manufacturers aren’t doing anything on futurisitc solar tech - TopCon+IBC, HJT variants, pervoksite, etc. They just bought manufacturing machines from China to manufacture mono PERC and TopCon. HJT is currently expensive but with scale the price will drop soon in China. More importantly pervoksite solar can scale up 5-6y from now, given that they are cheap enough to manufacture and 3-4% higher efficiency than TopCon. This whole space is changing fast and China is leading on all fronts - research, manufacturing, financing.
Value chain
- Small rocks of quartz (sand) are smelted to produce 99% pure silicon.
- This is purified to 99.999999999% (9 times 9) by mainly Chinese (and few German) companies to create polysilicon. Extremely expensive and protected tech, v. few companies in the world can do this step. Reliance announced to enter this, let’s see.
- Converted into ingots, then to thin wafers.
- Wafers => solar cells using some complex machines which a lot of companies in India have imported from China.
- Cells => modules => panels.
Step 5. is getting commoditized now because the machines for it are not that expensive. Lots of public and private companies in India are already doing it. Companies which do step 4. have some advantage and are using their cash flows to backward integrate into ingot manufacturing too.
A solar park with 1GW capacity will produce energy at 1GW rate only on a sunny day at 1PM and at 0 rate after sunset. Averaged over the year it will have produced at 200-240MW rate (20-24%).
The CUF of older parks was 17% v/s now at more than 21% due to:
- TopCon modules
- Deployment of industrial robots to clean the module surface
- Increasing focus on strategic locations like Gujarat and Rajasthan deserts where solar irradiance is v. high and no. of cloudy days are less. This advantage isn’t available to rooftop solar in cities.
Opinion
Point 3 is one of the reasons why rooftop solar will not scale beyond 40GW which is the govt. target for 2027. Presently they are aggressively promoting it via subsidies but it will stop very soon. Already subsidies are declining btw.
Now let’s come to the cost side for IPP producers. In a typical 1GW park:
Total cost is ~3600cr with indian modules (TopCon) v/s ~2900cr with imported modules. Again there’s some variation depending upon module quality. With older Mono PERC indian modules, it could be lower ~3200cr.
Capex Breadown
| Category | Cost contribution | Inflation Status (future cost) | |
|---|---|---|---|
| Modules | 45-50% | Deflationary | |
| Mounting Structure and Trackers | 10% | Inflationary | |
| Labor + EPC Margin | 10-12% | Inflationary | |
| Inverters | 7-10% | Remain same(marginal inflation) | |
| Cables + Transformers + Switchgear | 8% | Inflationary | |
| Others (park development cost to govt.) | 7-8% |
50% of the cost will decrease with time and the overall cost of building a solar park can decrease in future maybe 5-10%. Competition is also increasing as more supply is coming up rapidly. Hence solar tariffs can reach ₹1.5/unit in few years.
Note that there’s no need of an alternator in solar energy as the PV cell generates DC, which is converted into AC by the inverter. That’s why some companies are experiencing surge in inverter sales like Polycab. (The only problem with this segment in terms of investment is the inverter components are imported from China.)
The demand for cables in solar parks is increasing at a crazy pace due to 2 reasons:
- 1GW solar capacity on paper yields only 210-230MW of power, much lower than 1GW thermal that yields 750-800MW. So lot more paper capacity has to be setup to replace thermal energy (decarbonise).
- A hydro/thermal facility is limited to a smaller area v/s a solar park that is spread horizontally over large area so more cables are needed to connect the modules.
Now comes the real question, where does your electricity come from after sunset?
Energy storage and the real cost of RE
My starting point to even know about the problem was this video.
Very few people understand how the grid works and how the fluctuating demand even before RE posed a big challenge to balance the grid. You can watch this too. With increasing share of RE, these problems have multiplied.
In short, DISCOMs have to purchase long term PPAs from thermal/hydro providers as well solar PPAs. They may not pay the variable cost to a thermal provider during the day if their requirement is being met by solar, but have to pay the fixed cost so that the thermal plant can sustain. Thermal costs between ₹3-4.5 /unit and hence the blended cost to DISCOMS is ₹5.5-6 /unit, much higher without solar (avg. ₹4 /unit). Also, these PPAs are bought based on avg. monthly demand. In some weeks in winters and summer, peaks are very high which are met by buying in the short term markets on IEX. Night time prices of power are even higher ₹9-10.
So why are they doing it if it doesn’t make sense economically? Enter RPOs which forces them to buy a certain amount of energy from solar providers.
This is inline with what’s happening elsewhere in the world wherever significant RE is setup, the retail electricity prices have climbed up like California, South Australia(SA) and Germany. California has the highest retail prices in all US and same for SA.
Germany and California have 50% renewables contribution to overall energy but both of them also have 100% thermal plant backup to counter the intermittency. That’s why cheap energy storage is going to be the OIL of future.
Carefully understand these 3 graphs where all storage options are considered with their efficiency, LCOE and capex requirement.
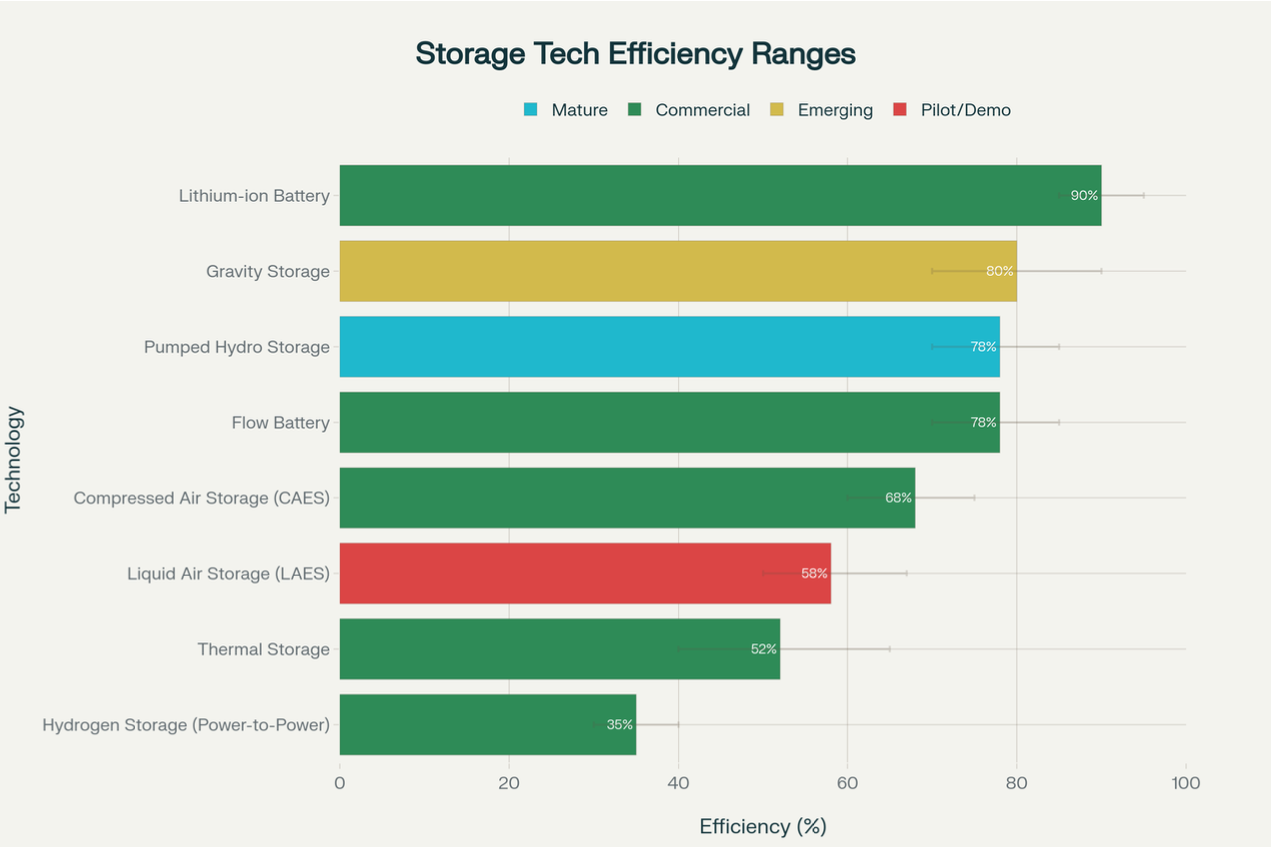

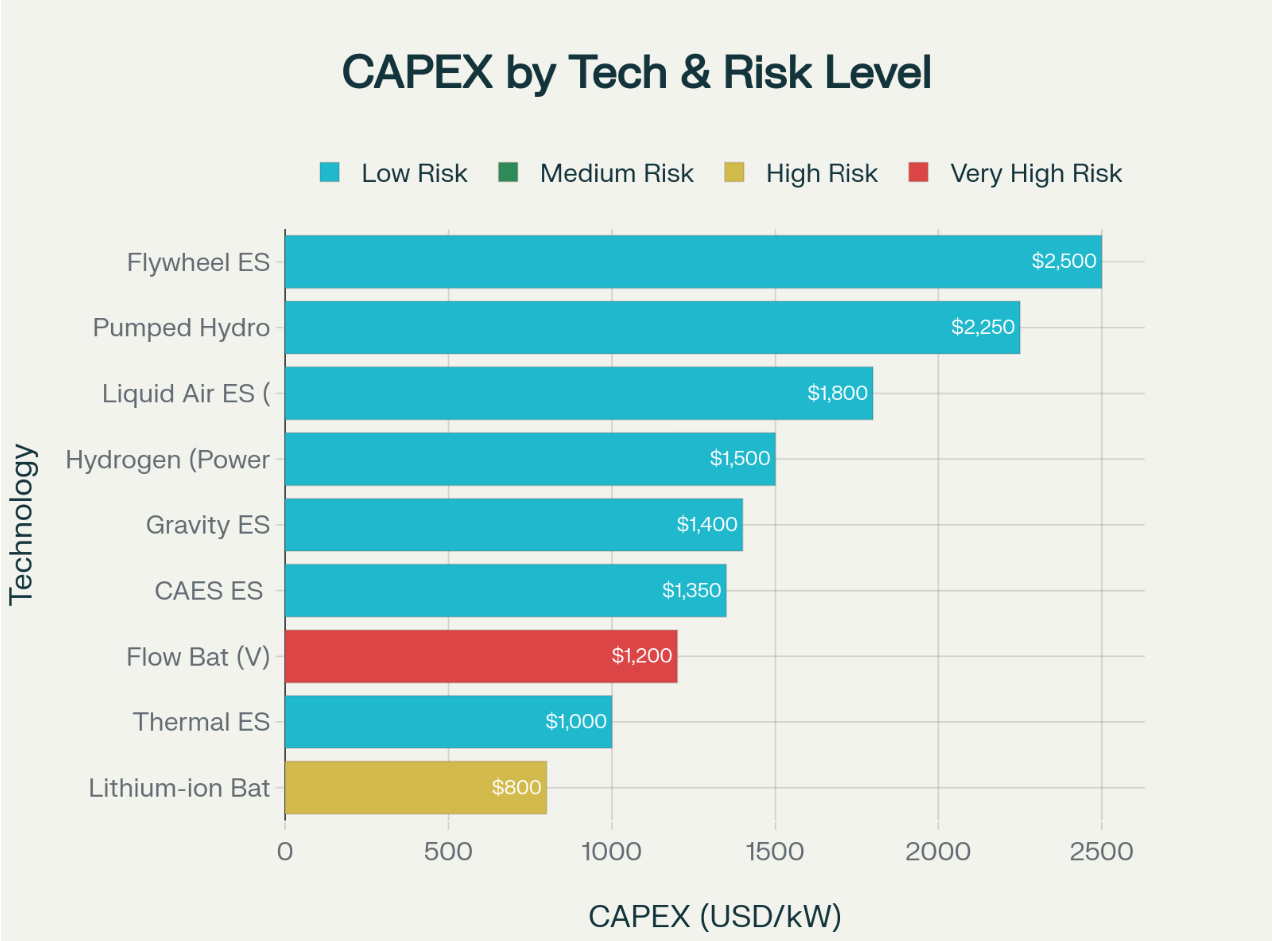
Clearly the winner if LFP battery (BESS) based on smaller capex and high efficiency. Despite that LCOE is higher than gravity and compressed air storage because the life of a battery (especially lithium based) is short, maybe a few years. Gravity storage can last for decades without much opex however the tech isn’t mature enough currently. Last time I read, there’s a company called Energy Vault that’s doing a PoC setup with NTPC in India.
Nevertheless, the talk of the town is BESS because LFP battery’s cost has fallen by 50% in last 3 years. Government decided to fund 40% of the capex cost (VGF) for anybody setting it up. The question is does it make sense economically?
Well yes, see this data from IEX:
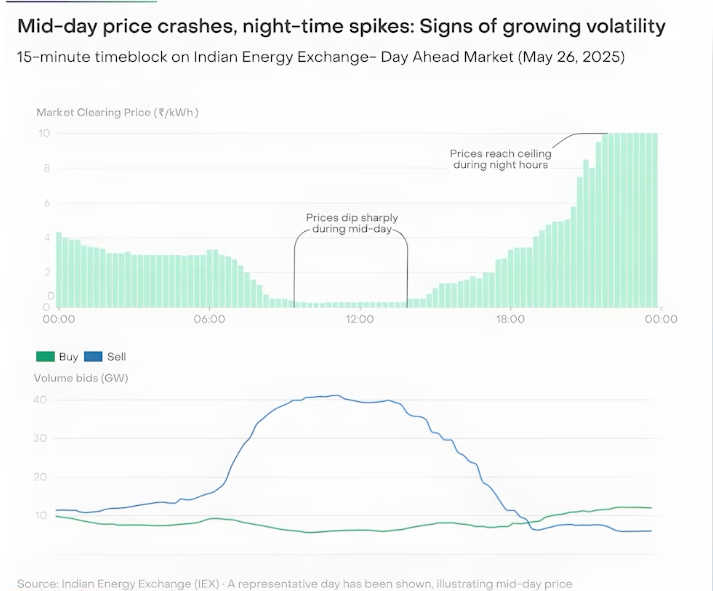
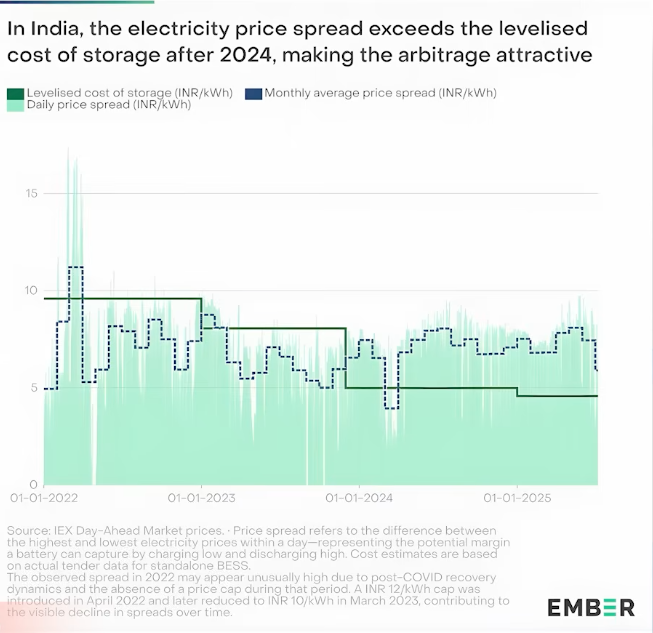
The cost during mid-day reach as low as ₹1/unit and peak out at night with ₹10/unit making the difference ₹9. So if you can charge the battery during the day(cost) and sell it during night at ₹7-8/unit, your spread is enough to cover the capex + maintenace cost of BESS to make it profitable. For the buyer, the LCOE would be ~₹5/unit or maybe less if battery costs fall further.
This wasn’t possible before 2022 because the battery tech wasn’t mature enough. In fact the main driver is LFP battery which has reached economies of scale now and it doesn’t need expensive metals like cobalt and nickel.
opinion
While the government is vouching for BESS, the scale up should be at moderate pace rather than fast because DISCOMs can’t suddenly discontinue their PPAs with thermal providers. BESS capacity will be for incremental electricity demand and also in the DAM markets (short term) on IEX to meet sudden spikes in demand as in summer and winter months. Beyond that, there’s a risk about availability of lithium. Most of it is processed by China and due to geopolitical reasons it could curtain exports in future. I personally wouldn’t invest in a company that’s purely earning from BESS.
Thermal
Thermal plants are a good source of reliable baseload power. Their CUF was decreasing throughout 2015-22 reaching below 60% due to increase in solar share, however in recent years due to electricity demand outpacing the solar power additions (actual, not installed) it has increased again to 70%. Central government will continue adding a little more thermal capacity by 2032 in order to provide a reliable supply of baseload power.
Coal power tariffs were around ₹3-4/unit historically and some PPAs continue with that, however new PPAs are ₹5-6/unit. Before renewables, coal was primary source of power and high CUF factors drove prices down (economies of scale). Besides some plants had access to cheaper domestic supply of coal vs higher international coal prices. New plants don’t have enough visibility on future offtake (10 years). So they have higher prices to offset the lower expected CUF in future.
Even though coal is a reliable source of baseload power, the ramp up and down is very slow (to heat coal). In fact it takes several hours. Hence from grid management perspective, it’s not the best option.
Gas plants have higher tariffs ₹5-8/unit because of import dependency on gas. Our domestic reserves are not enough. In US, gas power has a significant share of total production because of cheap supply unlike India. Gas plants actually do pretty well in fast ramping up/down the power and are also more efficient becuase energy density of gas is much higher than coal. That’s why there’s a demand surge for gas engines & turbines to be supplied in small plants being built for datacentres in US.
As far as India is concerned, share of electricity from gas will increase slowly as new plants come up which can secure cheap supply of domestic gas.
Hydro
In my view, this is the most crucial source of power due to its role in grid management. China is building the world’s largest hydro power plant in Tibet at estimated capacity of 137GW on completion.
India’s current share of hydro is v. small at 6% because we don’t have enough sites with continuous supply of water. Most of the sites operate at CUF of less than 35% taking their LCOE high at ₹6-8 in order to sustain the plant. This is in contrast to some other countries like Norway and Brazil where the share of hydro power is 90% and 60% respectively. Their CUFs are over 46%.
In India, we source cheaper supply of hydro power from Bhutan where the sites get enough supply of water leading to LCOE of less than ₹5 /unit. Though in terms of quantity, it is very less ~1GW. Unfortunately not much can be done in this regard since the cost is completely dependent on the site.
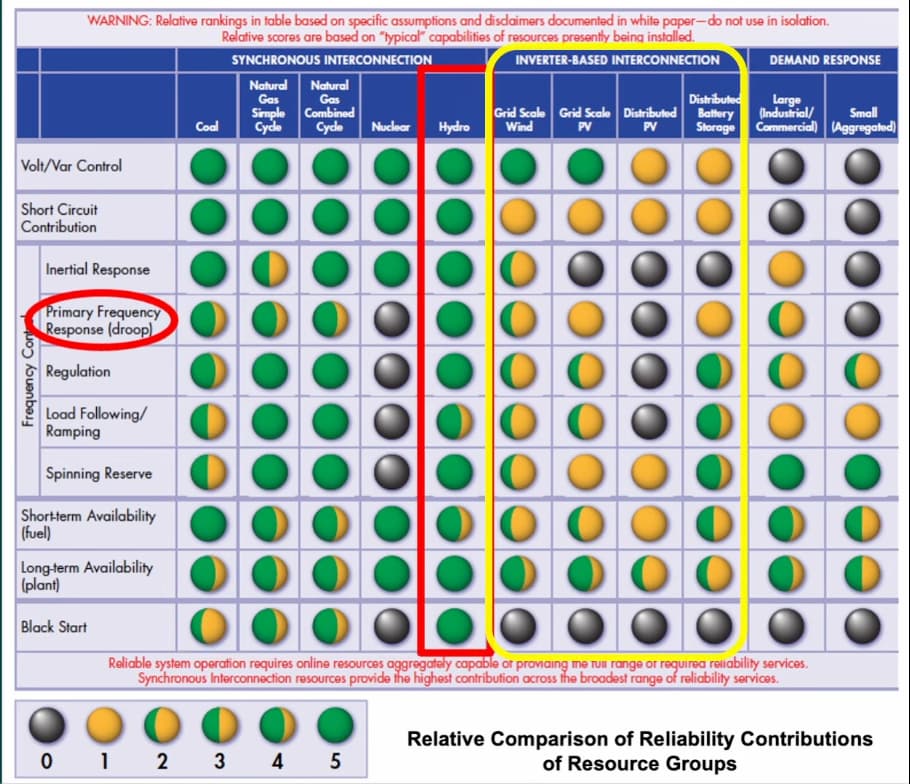
Grid Management services (ancillary services)
As discussed previously, hydro can be ramped up/down very quickly. In a matter of seconds a turbine starts spinning. When the demand (load) of power exceeds the supply, the frequency of AC in the transmission grid starts to drop. That’s when the grid operator will turn ON an idle unit in a hydro plant to increase the supply.
If the frequency drops from 50Hz to 49Hz, a big fault in the grid can happen causing complete blackout of large regions. When you are out of electricity in a region, most power plants in that region can’t be restarted without external power, except hydro (it is technical so skipping the details for now).
This picture summarises the grid management (reliability) strength of hydro power over other sources.
Pumped hydro is a hydro facility equipped with large pumps to channel the water back to upper reservoir during the day when cheap supply of excess energy is available. The capex cost associated with pumped hydro is so huge that LCOE (charging + discharging) is generally high ₹6-7 /unit. LCOE can go down slightly if the site has a natural supply of running water (like in monsoons) which may turn it into a regular hydro plant that doesn’t need pumping (charging).
1GW solar park’s capex is ₹3500cr v/s pumped hydro at ~6000cr.
Some companies (like Tata Power) are building pumped hydro facilities despite higher LCOE because of its grid management capability. That’s the cost people will have to bear, in order to get reliable and de-carbonised power.
There are a number of hydro sites in California that make their entire revenue from these services.
Nuclear
If a country can get its hands on secure supply of uranium, energy problem is almost solved for them. It is neither polluting nor expensive source of power. The tech is fairly mature now and unlike what most people think, it’s actually very safe. See this table on deaths per Twh energy generated where the data for nuclear includes deaths due to Fukushima and Chernobyl disaster.
| Power source | No. of deaths / Twh |
|---|---|
| Coal | 24.6 |
| Oil | 18.4 |
| Gas | 2.8 |
| Nuclear | 0.07 |
| Wind | 0.04 |
| Hydro | 0.02 |
| Solar | 0.02 |
Despite those two large incidents, the overall death rate is so low.
France is the leader, sources 70-80% of its energy from nuclear. India can’t do it simply because we don’t have enough uranium reserves. Importing from Kazhakastan or Russia is an option but that defies our long term goal of being energy independent. And obviously we can’t build a nuclear plant for short term goals like 5y or even 10y. In fact, building a nuclear plant is the most expensive among all sources. Only because the plant life is v. long 30-40y, the investment that France & Japan did in building those were justified.
Summary of power sources
I’ve assigned a score in 0-10 to each source based on 5 key attributes. The last column contains the net score out of 50.
| Power source | Cost (LCOE) | Fuel sourcing (energy independence) | Ramp up/down during peak | Sync/Async | Emissions | Net |
|---|---|---|---|---|---|---|
| Solar | 10 | 10 | 0 | 0 (async) | 10 | 30 |
| Coal | 8 | 6 | 5 | 10 (sync) | 0 | 29 |
| Gas | 5 | 5 | 10 | 10 | 0 | 30 |
| Hydro | 6 | 10 | 10 | 10 | 10 | 46 |
| Nuclear | 8 | 4 | 5 | 10 | 10 | 37 |
| Wind | 8 | 10 | 0 | 0 | 10 | 28 |
Transmission & Distribution (T&D)
Power generated from any source travels through a network of wires and substations called the national (central) grid to the feeder lines of DISCOMs, which have their own dense network of smaller voltage cables to distribute that power to households, offices and factories. The transmission cables of grid are of EHV (extra high voltage) - 132kv, 220kv, 400kv and 765kv, while distrubution cables are much less 5kv, 11kv, 66kv, etc.
Various components of this infra:
- transformers
- high voltage lines that carry AC/DC from site A to B over long distances. lines carrying HVAC carry AC and HVDC carry DC. loss of power in DC is less than AC however DC can’t be stepped up/down. so a typical setup that needs HVDC line is
AC input -> transformer step up -> inverter -> HVDC output - substations which are like junction points to distribute or join power
- conductors made of aluminium in these substations
- cable towers
- circuit breakers to arrest faults
- switchgear
- others like monitor relays, etc.
As discussed previously, the losses are inversely proportional to voltage so maximum power loss happens while transmitting in the lower voltage DISCOM network. Here is the breakup of retail electricity bill in USA:
| Item | Bill contribution | Notes |
|---|---|---|
| Power Generation | 40% | cost paid to power gen. company |
| Distribution | 40% | cost to DISCOM inclusive of grid reliability services (ancillary) they have to buy to meet fluctuations in demand |
| Transmission | 12% | Low losses due to EHV lines and high grade transformers |
| Public welfare schemes | 6-7% | State governments charge for public welfare policies and fund for disaster recovery |
Indian bills wold be roughly the same. A very significant amount (40%) is paid for distribution and reliability so that power is delivered uninterrupted even during peak hours. One big difference however between India and US is breakup of T&D losses.
In US total T&D losses are 6%. 2% from transmission and 4% from distribution. In China also it’s less than 10%. But, India is at 18% because AT&C losses are significant 16% (Fy24) primarily due to electricity theft. The losses from transmission are same everywhere 2% because India’s grid is also fairly advanced, at par with China and US.
Another imp point is that avg. AT&C of India at 16% is misleading because it’s highly variable depending upon state. DISCOMs are run by state governments and some of them are very efficient (infact profitable) with AT&C at 10% (Gujarat, Mumbai) and some above 25% (Bihar). There are primarily 2 reasons why DISCOMs face issues:
- electricity theft causes commercial losses highly prevalent in UP, Bihar and Jharkhand.
- ACS-ARR gap is -ve, ACS = avg. cost of supply per unit, ARR = avg. revenue; implying they buy electricity at a higher rate than what they charge. The low consumer tariffs are set by state regulators influenced by politics and poor financial health in agriculture (farmers).
In fact, India is the only country (not even vietnam, china) where the retail prices per unit are much lower than industrial and commercial prices (factories, offices). Industry subsidises retail energy consumption and this is one of the reasons our manufacturing is incompetitive with China :(
However now there’s another trend on these lines playing out - with solar plants and BESS getting cheaper to setup in the factory campus, companies are deriving more and more energy from these instead of the grid. DISCOMs are hence loosing their profitable customers while continuing to service the subsidised customers, causing increased distress.
One encouraging aspect though is AT&C have consistently decreased over the years from 26.6% in Fy12.
Central grid
Some regions in India with excess power (like East) can’t supply to the rest of the country due to missing grid infra. Without grid infra, the whole energy equation doesn’t work. It’s a non-negotiable piece needed to meet increasing power demands of India (and the world). Government is aggressively investing every year as they have been doing in last 2 decades, which will continue for another decade. There’s already ton of info on this, so I’ll just mention few lesser known points:
- Central government floats tenders for transmission projects. More often than not multiple comapnies bid through their JVs because huge invesments are needed to build the projects.
- After building the project, energy buyers who uses their transmission to recieve power will pay a fixed tariff per unit. The tariffs are set by CERC (govt. entity) based on a fixed RoE (15%) that the company will earn over the life of that infra.
- Biggest hurdle while building the infra is RoW (right of way). Companies need the approval of the land owners to use it for setting up towers and overhead lines. They may financially compensate them or use any other legal means. But this step extends commissioning time, delaying revenues.
- Currently an even bigger hurdle has emerged - shortage of equipments and cables. Due to high demand from datacenters, all equipments companies have finalized order books of next 5-6y. It’s extremely difficult to get these equipments. Besides the commodities like copper are in strong inflationary trend, the prices are increasing dramatically. It gets more difficult in such cases to get your project financed. Note that, without debt no player can survive in this industry.
Smart Metering, Grid Equipments
It differentially prices the electricity consumption during the day and night so that DISCOMs can fairly tariff the consumers for high purchase cost they bear during the night.
There are so many companies in India that build electrical equipments that have applications in the grid. I’m still analysing those, so won’t talk much about it in this post.
I must mention that companies in either of these business are trading at all time high valuation. So i’m anyways not motivated to analyse them immediately.
Takeways and companies I’m tracking/investing
- Just because solar is cheap doesn’t mean our energy sourcing is cheaper than before. In fact it’s the opposite and it will remain the same until humanity invents a synchronous, cheap and reliable storage tech.
- Thermal and hydro power is here to stay for at least a decade. Hydro is probably the best but in India we don’t have enough profitable sites and we can’t do much because it’s nature dependent.
- Some entities that operate only during the day are well positioned to take advantage of solar like educational institutions (schools), offices and some factories too. That’s why there is increase in solar captive production (CPP). I’m tracking KPI Green in this space.
- If a company’s value chain involves selling to DISCOMs at any point, the company may struggle with cash flows. In all the companies I analysed so far, profit growth on paper isn’t a problem. However operating cash flows are a big problem. The inefficient DISCOMs combined with poor agri sector (and late subsidies) is a disaster.
- Privatisation of DISCOMs may emerge as secular trend in future because already some privatization has yeilded positive returns like Tata Power turning around Odisha DISCOM. They have stakes in Mumbai and Delhi DISCOMs too and I’ve invested in this company. Still I’m very cautious in this sector and Tata Power is only 1% of portfolio.
- DISCOMs will have to figure out new ways of earning revenues profitably because their existing industrial customers (and large households in retail were also important) are setting up solar plants in their own premises.
- Smart metering may continue to be secular trend as it improves the efficiency of DISCOM. Tracking HPL Electric in this.
- Increasing energy demand is pushing the order books of transmission infra - cables, transformers, circuit breakers, etc. I invested small amounts in Polycab and KEI earlier but not averaging up right now due to high valuation. I might be wrong as the rev growth may continue for another 10y. Besides, this is an area where China doesn’t necessarily have a tech advantage over us. We have been manufacturing this for decades unlike solar. Look at Polycab’s balance sheet and cash flows, it’s amazing. Slowly companies like KEI are getting into EHV (>220kv) through JVs with some European companies. Though it’s a smaller market currently in India(4000cr or less annual).
- CPP demand also increases demand for alternators. I’m tracking TD Power in this space. They are slowing entering the synchronous storage tech (non BESS) which could be a big market in future. This optionality is the driver of high valuation of TD Power.
- Tracking Premier Energies in solar manufacturing.
- I’m invested in GMM Pfaudler with a different thesis unrelated to energy. However, they are going to have some revenues from battery manufacturing industry through supplying mixers that are needed to make lithium cells. The mixers create something called electrode slurry by mixing carbon, lithium and some other metals in a solution.
References:
- https://www.youtube.com/@understand-energy.stanford/videos
- https://www.youtube.com/@UndecidedMF/videos
- Annual reports of Tata Power, Adani Power, Powergrid, Ola Electric, etc.
- Book Material World by Ed Conway
- Perplexity AI