Elecon Engineering -
Q1 FY 26 results and concall highlights -
Company’s product profile -
Gears - Company is a supplier of widest range of Industrial gears
Serve mainly to Industries like - Power, Cement, Sugar, Steel, Plastic, Defence, Mining, Rubber
Company is already a mkt leader in domestic mkt and is strategically expanding in overseas mkts
Products in this segment include - Helical gearboxes, Series gearboxes, Worm gearboxes, Couplings, Planetary gearboxes, Marine gearboxes, Custom made gearboxes, Central drive mill gearboxes, Double helical gear wheel, Loose gears etc
MHE ( material handling equipment ) -
Products include - Feeders, Pulleys, Automatic Weighing, Stackers, Mobile stackers, Truck Loaders etc End user industries include - Steel, Cement, mining, Fertilisers, Power, Ports, Oil and Gas
Q1 outcomes -
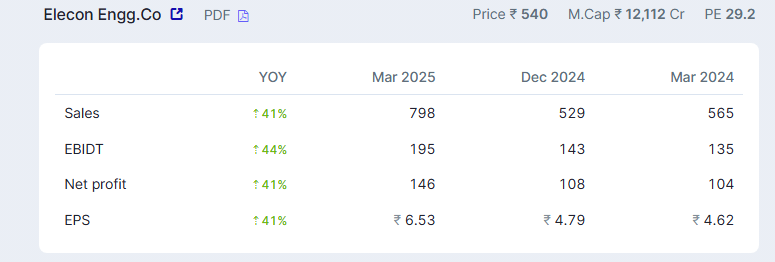
Revenues - 491 vs 392 cr, up 25 pc
EBITDA - 130 vs 92 cr, up 41 pc ( margins @ 27 vs 24 pc )
PAT - 175 vs 73 cr ( includes an exceptional pre tax item of 108 cr )
Exceptional items include - one time arbitration settlement claims of 25 cr in MHE division ( included in segmental revenues ) + another one time arbitration claim of 10 cr + MTM gain in their investments in one of their associate companies - Eimco Elecon to the tune of 80 cr
Order book intake in Q1 @ 614 cr, up 13 pc YoY
Total order book now stands @ 1110 vs 947 cr YoY
Segmental performance in Q1 -
Industrial gears -
Revenues - 357 vs 337 cr, up 6 pc
EBIT - 66 vs 80 cr, down 17 pc ( margins @ 18.4 vs 23.7 pc )
Margins were impacted due to accelerated depreciation because of new capacities that went live in Q1, increased employee costs, increased brand building activities related spends for International mkts. As the capacity utilisation of newly commissioned capacities improve, margins should start to see an uptick
Order intake @ 480 vs 396 cr, up 21 pc
Total order book @ 710 vs 598 cr, up 19 pc
Seeing steady demand coming from domestic power, steel and cement industries. Enquiry levels remain encouraging across domestic and international markets
MHE -
Revenues - 133 vs 56 cr, up 139 pc ( includes 25 cr of additional revenue recognition due favourable award of arbitration proceedings )
EBIT - 61 vs 14 pc, up 335 pc ( margins @ 46 vs 25 pc )
Order intake @ 134 vs 149 cr, down 10 pc
Open orders @ 400 vs 349 cr, up 15 pc
Even without considering the 25 cr of arbitration revenues in the MHE segment, the division’s revenues have almost doubled !!!
Geography wise revenue split for Q1 FY 26 -
Domestic - 357 vs 259 cr, up 41 pc ( domestic business did have a favourable base in Q1 )
International - 124 vs 133 cr, down 7 pc ( international business did have a high base in Q1 )
Segment wise revenue split for Q1 FY 26 -
Industrial gears - 357 vs 337 cr, up 6 pc
MHE - 133 vs 56 cr, up 139 pc
Adjusted for the 25 cr additional revenues recognised in the MHE division, consolidated revenue growth in Q1 would have been 18 pc instead of reported 25 pc growth. EBITDA growth would have been 14 pc instead of reported 41 pc with margins @ 22.6 instead of reported 27 pc margins. For full FY 26, company aspires to clock 24 pc EBITDA margins
Strong order book and continued enquiry levels make the company feel confident for better performance for the rest of the FY
MHE segment’s strong growth in Q1 led by Power, Steel and Cement sectors
Cash on books @ 550 cr. Capex planned for next 3 yrs @ 435 cr. 400 cr for the gears division and 35 cr for the MHA division
Company lost aprox 14 cr of sales in international sales due Iran - Israel tensions. Should be able to make up for these lost sales in Q2. This aside, company expects their exports business to pick up wef Q2 ( specially wrt supply to ME )
In the gears division, order inflows from International geographies in Q1 were @ 119 cr, up 10 pc YoY
Company expects to realise another 20 cr of gains from arbitration awards in next 12-15 months
They believe, they r on track to achieve 2650 cr of revenues for FY 26 ( assuming 24 pc margins, yearly EBITDA should be around 630 cr vs 543 cr that they clocked in FY 25 )
Over and above the Steel, Cement and Power sectors, company expects to start getting orders form defence sector wef FY 26 ( 200 cr this year and even bigger orders wef next FY - wrt Defence sector )
Expect to start clocking 24 pc EBITDA margins wef Q2
MHE division is expected to clock 650 cr in revenues with 23 pc EBITDA margins for FY 26
For FY 26, annual depreciation should be around 100 cr vs 61 cr in last FY
Seeing good order uptake in MHA business wef July ( in Q2 ). Order inflow for MHA division in Q1 was on the weaker side
No of OEM customers that company has now stands @ 18 ( for gears business ). Company expects to start accruing good revenues from this revenues wef Jan 26 ( to the tune of 70- 100 cr / yr )
32 pc of gear division revenues came from service + refurbishment + spares !!!
The bigger defence sector order that the company expects to win in next FY should be around 1000 cr - to be executed over 3 yrs
The service component in MHE division in Q1 stood @ 41 pc - very healthy levels
In gears division in Q1, company clocked 43 pc revenues from engineered products vs 57 pc revenues from standard products. Engineered products have a higher margin and generally the revenue contribution from these 2 segments is @ 50:50. Lower contribution from engineered products in Q1 led to margin pressures in Gears division in Q1 ( + the effect of added depreciation - as brought out earlier ). Expecting a pickup in sales of engineered products wef Q2
Disc: holding, biased, not SEBI registered, posted for educational purposes only, not a buy/sell recommendation