My bad, and thanks for the clarity.
Genuinely believed that even a demerger would go through a listing process for which he said IPO.
My bad, and thanks for the clarity.
Genuinely believed that even a demerger would go through a listing process for which he said IPO.
Intrinsic value is very subjective, even a small variation in discount rate (used by the person / system calculating it) can make big difference.
Also, there are still a lot of good listed companies available - where underlying value in marketable securities & liquid investments - is far greater than current market cap. For an Ex: Bajaj Holding, Maharashtra Scooters and lot other holding companies.
This is true, no doubt - and that’s one of the reason of being invested in this scrip despite some of serious negative signals on operational front of promoters.
Investing one’s hard earned money basis the opinion - some influencer invested in it - I will personally refrain from such investment practice.
For me personally what matters is - if the words of management are matching to their act.
In the next conference call can we ask to rashesh shah why he doesn’t want to go demerger route for EAAA which can help existing stakeholders as well and why he want to go for IPO route?
Penned my thoughts regarding holding companies and covered Edelweiss as part of the same.
There seems to be a misconception about valuing Edelweiss Alternative Asset Advisors (EAAA).
Value = (FRE × FRE multiple) + (PRE * PRE multiple) + Investments
So, in a 2/20 structure with a 6% hurdle, an advisor will earn 2% fixed fees & 20% of the upside above 6%.
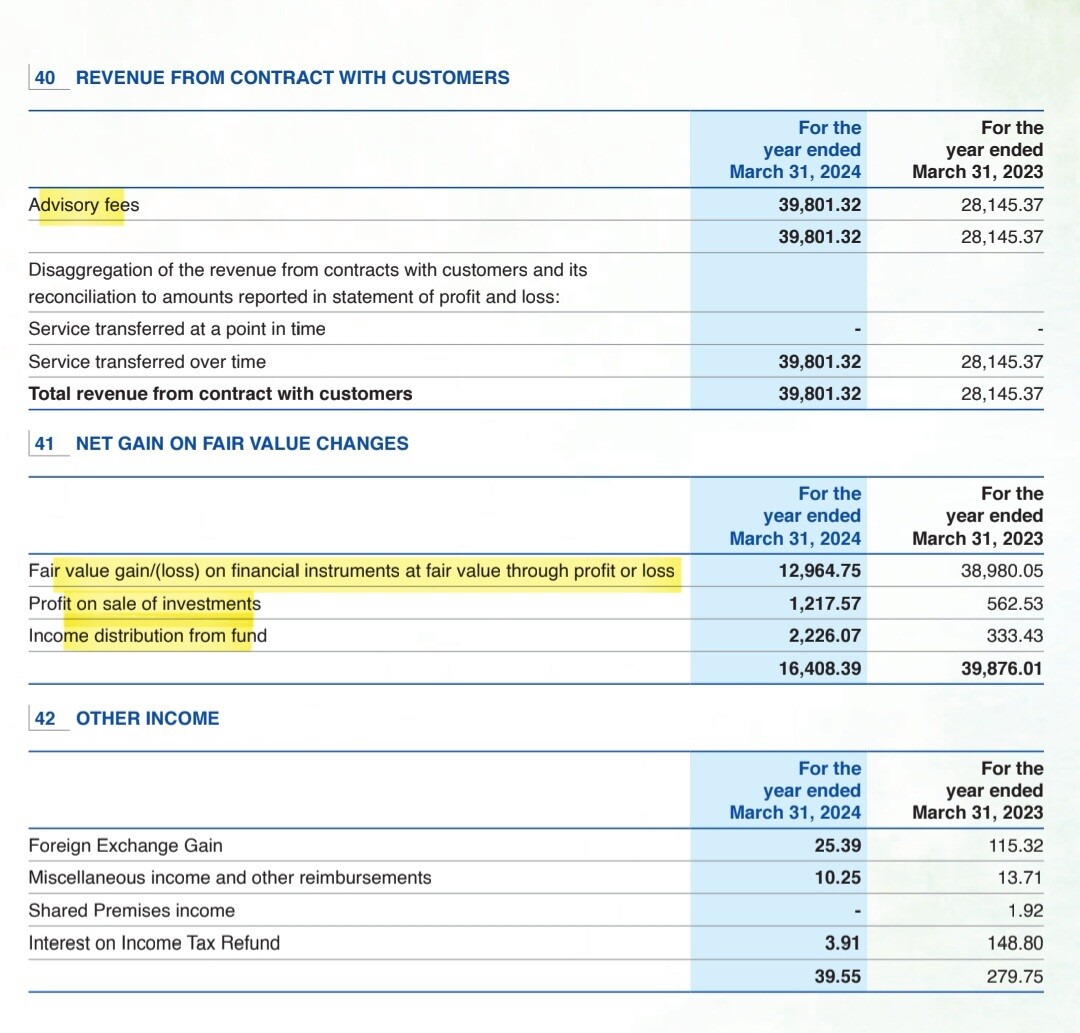
From the annual report of EAAA, you can see the following:
Hence, directly applying a multiple on earnings erroneously includes the change in value investments under earnings.
Misc things:
This analysis reflects my personal research and perspective, intended to encourage constructive discussion within the ValuePickr community. It should not be considered as investment advice.
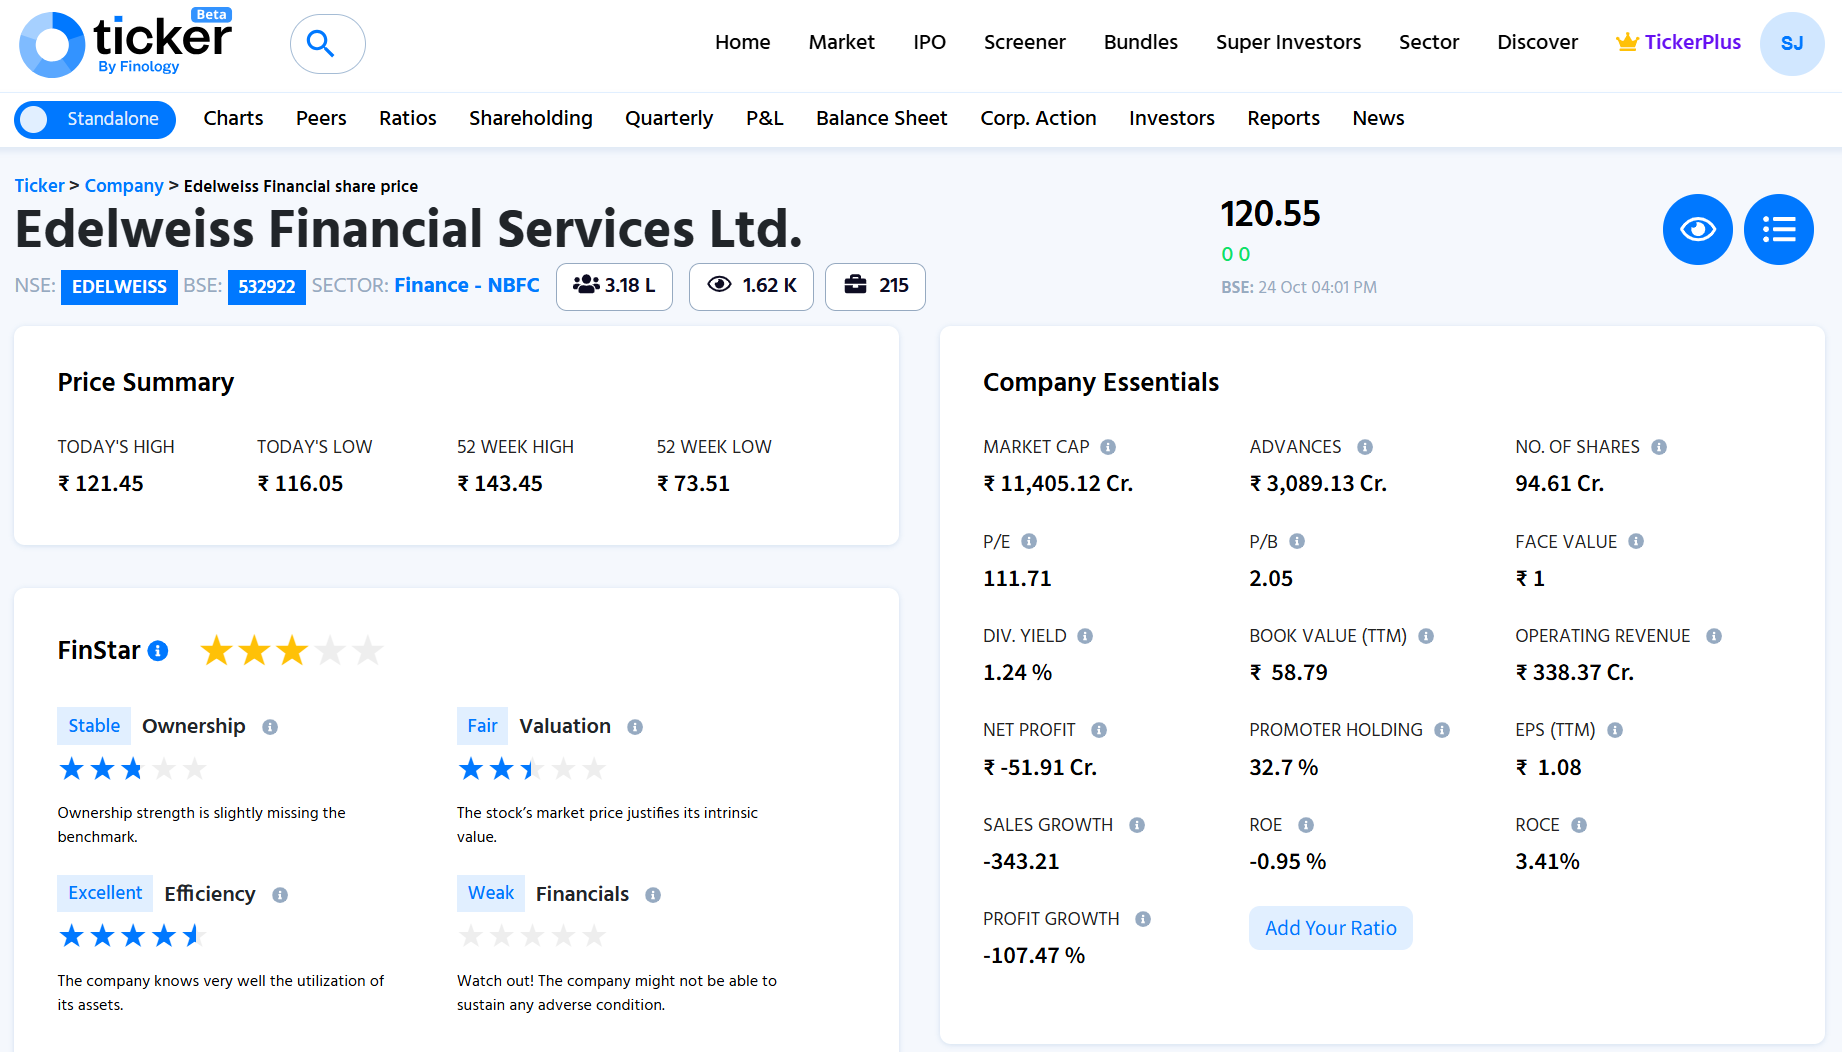
Edelweiss Financial Services operates across retail credit, asset management, insurance, and merchant banking, serving a wide range of clients from individuals to corporates.
The image below provides a quick overview of Edelweiss Financial Services Ltd.’s latest stock performance and key financial indicators. It shows essential data such as market cap, P/E ratio, revenue, profit, and return ratios.
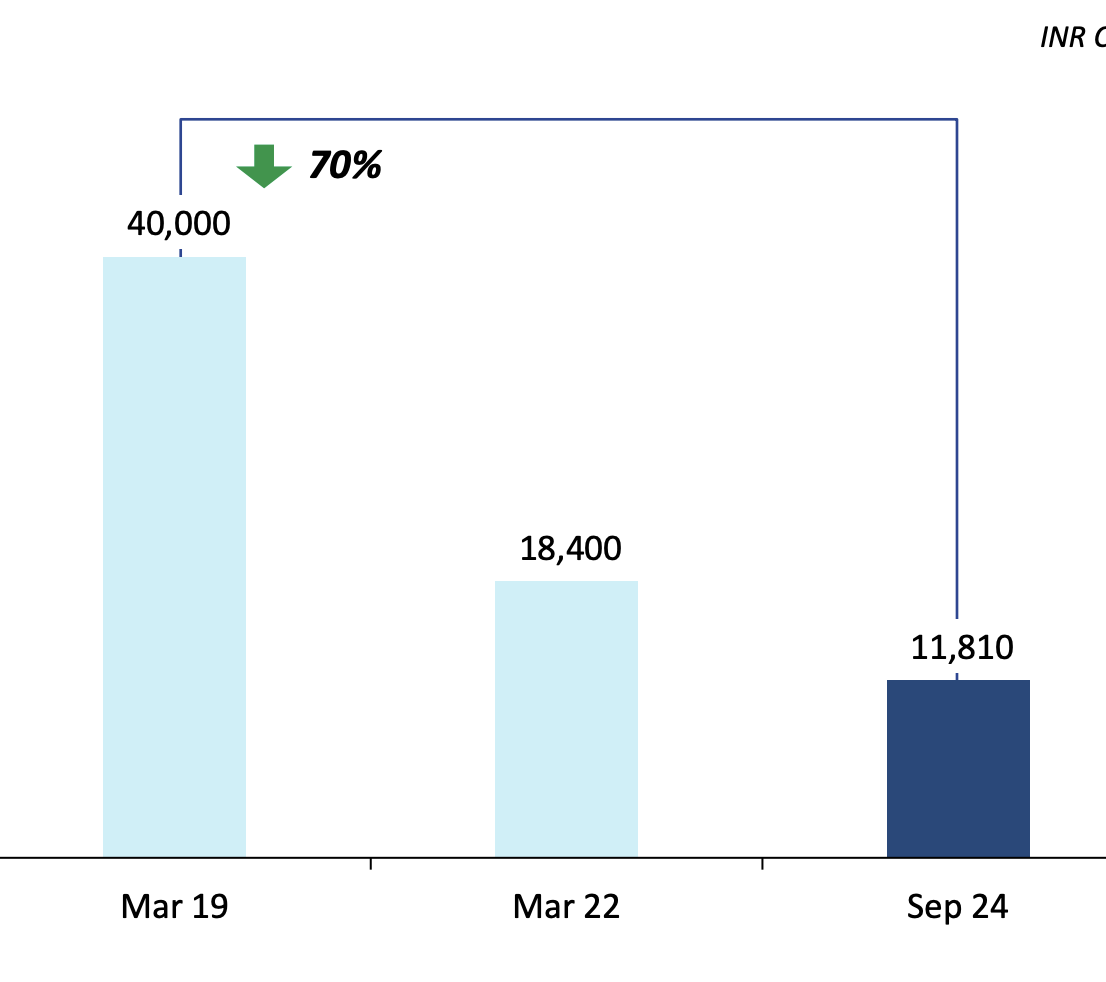
The company has lowered consolidated net debt by ~73% over the last six years, including a decline of 27% in FY25 to ₹11,170 Cr, and de-risked its wholesale NBFC portfolio by 86%. A one-off strategic price cut of ₹1,140 Cr in ECLF Security Receipts has been implemented that is likely to bring back equity within 3-4 years without impacting underlying cash flows. Principal businesses have healthy capitalisation with NBFC CAR at 32.9%, HFC CAR at 33.6%, and Life Insurance solvency at 181%.
Underlying PAT of core businesses rose 24% YoY to ₹566 Cr in FY25, driven by asset management where Alternative Asset PAT rose 31% and Mutual Fund PAT rose 40%, backed by AUM CAGRs of 21% and 45% respectively over six years. Losses in insurance are declining, general insurance falling 61% YoY and life insurance falling 19% YoY, aiming to achieve breakeven by FY27. Customer reach rose 36% YoY to 10 million.
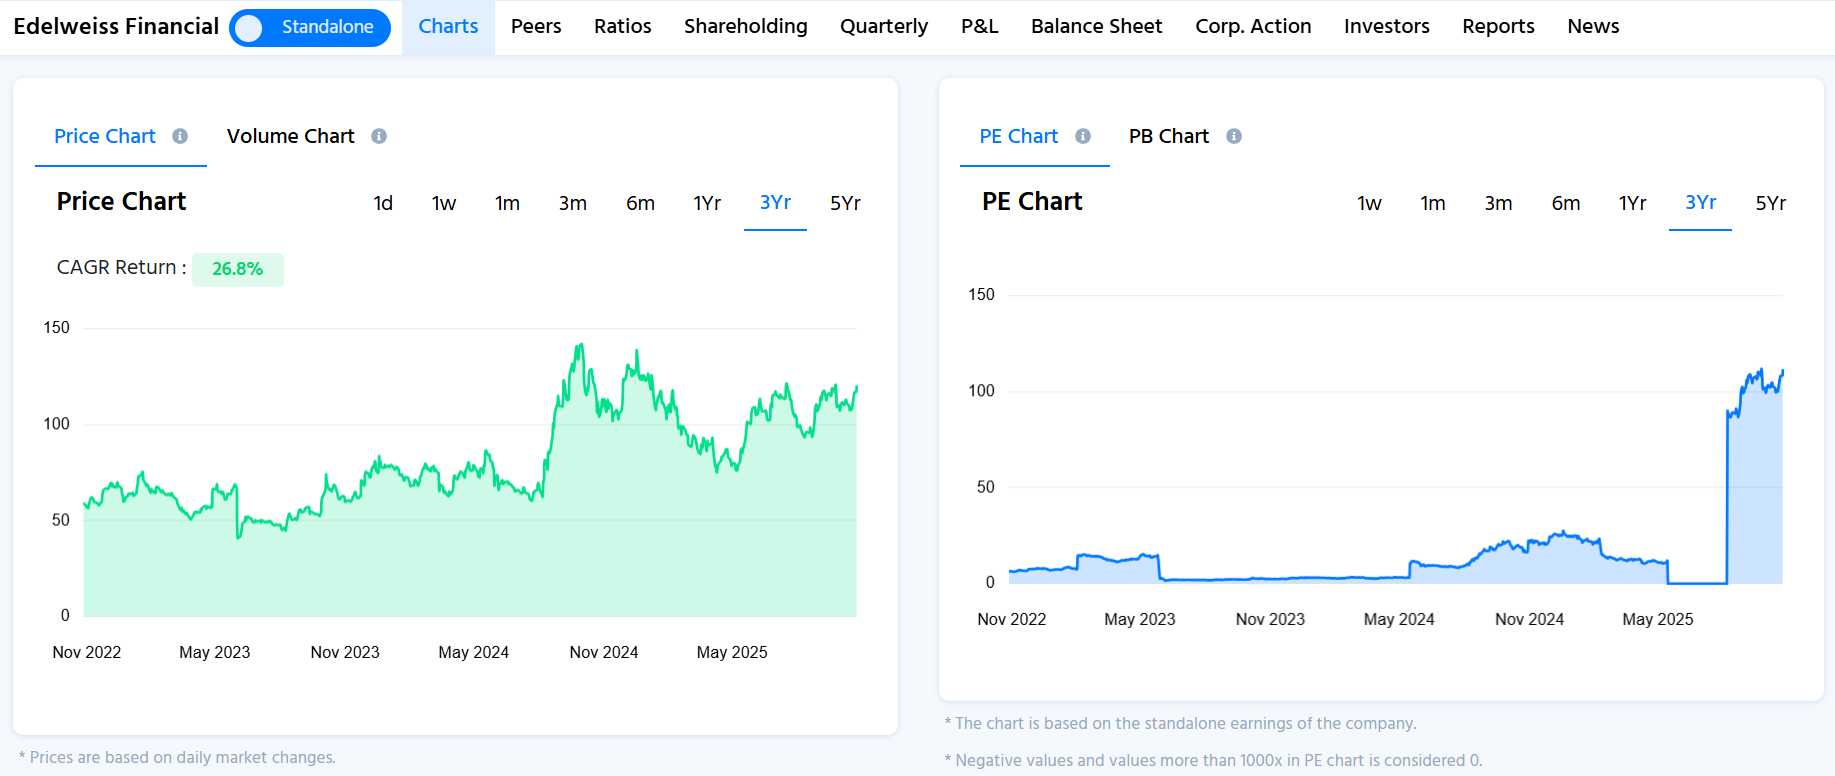
Throughout the timeframe, the company produced a compound annual growth rate (CAGR) return of 21.3%, which measures robust medium-term performance. The one-year CAGR is -13.1%, though, suggesting recent weakness, and the five-year CAGR is 13%, representing moderate long-term gain. The price chart reveals a consistent increase from mid-2023, reaching an apex in late 2024 before levelling off. The P/E graph, however, displays a steep and abrupt rise in 2025, suggesting that the stock price rose much more rapidly than earnings. The increase in valuation suggests that market sentiment became optimistic even as profitability was poor, perhaps driven by anticipation of eventual recovery or restructuring of the business.
Corporate net debt was ₹6,350 Cr as of June 25, and the company is targeting near-zero corporate debt within three years, supported by dividend payouts, sale of stakes, and current investments. This will help curb interest expenses and enhance corporate PAT. Value unlocking efforts comprise the Nuvama demerger that gave shareholders a ~30% holding (~₹6,500 Cr), the Edelweiss Mutual Fund’s sale of 15% to WestBridge at a 57x FY25 PAT valuation standard, and the upcoming Edelweiss Alternatives Ltd IPO in April 2026. Management projects 15-20% CAGR in intrinsic value over five years, with total intrinsic value expected at ~₹29,850 Cr.
Overall, Edelweiss Financial Services is focusing on reducing debt, improving profitability, and unlocking value through divestments and upcoming IPOs. Despite short-term weakness, strong capital ratios and growth in asset management suggest a gradual recovery. Management expects 15-20% CAGR in intrinsic value, indicating confidence in long-term growth.
We’d love to hear members’ opinions on this! Your insights could really add more perspective to the ongoing discussion.
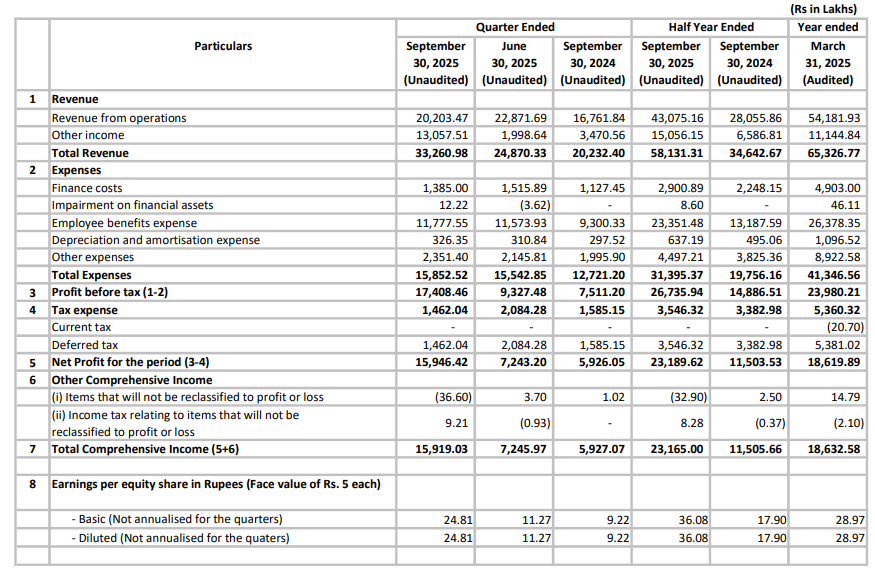
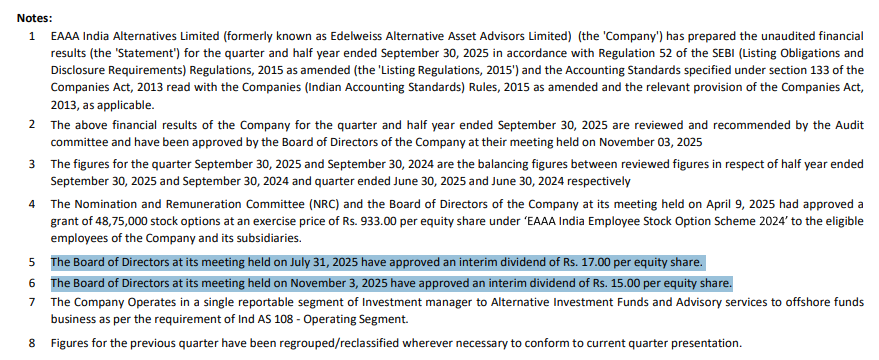
Recently, EAAA announced Q2FY2026 results. Based on published numbers it seems a significant increase in profitability QOQ as well as YOY basis.
https://www.eaaa.in/wp-content/uploads/2025/11/Outcome.pdf
Also, it seems holding companies, extracting maximum surplus cash in the form of dividends .. Almost Rs. 200 Cr in H1FY2026 paid as dividend.
Let’s see, how consolidated numbers are reported by Edelweiss for Q2 FY2026.
Great observation @Gaurav_Catalyst
This may be the real reason why they are delaying the IPO.
Also EAAA has lot of earlier investment so they may be earn gains on their income (carry income). But carry income is generally lumpy so let us see how sustainable it this.
But 200 cr dividend is good for current shareholder of Edelweiss as they may reduce their consolidated debt (hopefully).
As per my understanding, delay in IPO is done to extract Dividend seems very less in probability terms.
But because EAAA IPO is delayed (because of the reason best known to Mr. Shah & close associates), and they need hardly any growth capital in this business → hence, extracting excessive capital in the form of dividend to fund cash outflow liabilities of “Edel Securities & Investments; and Edel Finance” which holds 90% & 10% in EAAA → looks more real reason.
This is also very common practice nowadays. Before Listing via IPO, promoters extracts maximum possible cash via various means - some by commission payment others via Dividends.
This will be a key item to monitor in this quarter results, if consolidated debt is actually reduced (repayment) or again some financial engineering (via disclosing Net Debt numbers).
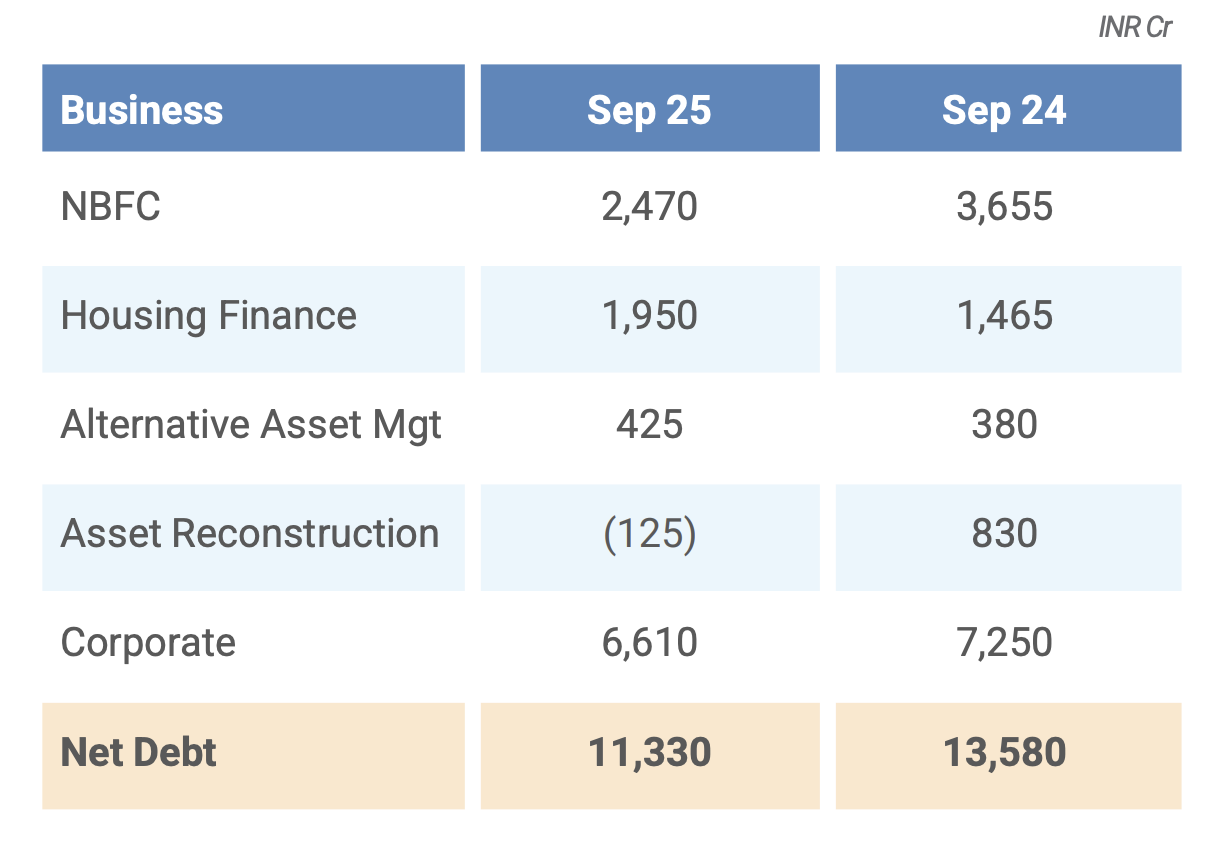
Can anyone please explain they keep changing Historical NetDebt numbers, as of the current quarter last year Sep’24 Net Debt was 13,580
But When I look at quarterly presentation as of Sep’24 the Net Debt was 11,810.
How do I reconclie between Net debt numbers shared in quarterly presentations as of Sep’24 vs Sep’25
The difference seems to be due to the treatment of the Nuvama stake.
In the Sep25 presentation, “The equity stake held in Nuvama Wealth Management Ltd is not netted off from the gross debt in Sep 23 and Sep 24” (slide 57)
In the Sep24 presentation, “Sep 23 net debt number is computed after netting off Nuvama stake” (slide 52)
The Dec24 tranche was sold for Rs 1,759 cr (Link)
The gap between the Sep24 and Sep25 numbers is approximately that.
13,580 - 11,810 = 1,770
I haven’t looked at the movement in Nuvama share price to check if the difference lines up.
Ideally the treatment of these numbers in the presentation should have been consistent.
in all of this financial engineering the true net debt including stake sale of Nuvama has not made any reduction in true Netdebt numbers
It was at 11810 in Sep 24 and now at 11330.
I am not sure what management did with 1759 cr of cash received after nuvama stake sale…
EAAA is a phenomenal company. We are consideirng a large bet on Edelweiss for the hive off of EAAA. We think EAAA is itself a $1B Mcap value. Open for debates and discussions. I know this company has not really executed in the past. Even rakesh had a bet on this. But i believe the time for EAAA is now here. Open to any debate on this
From the Q2 call:
“And we have said we will do stake sale in mutual fund and EAAA.
And now we may also be exploring a stake sale in our housing finance business. So
we think over the next 6 to 8 months, we will do a stake sale with a JV partner in our
housing finance business. So these 3 businesses are amenable to us doing a stake
sale and raising some capital to reduce our debt”
The HFC business is larger than that of JMFL (which recently sold a stake to Bajaj Life Ins)
The AMC business is larger than Canara Robeco AMC.
And the EAAA business - lets see what the value is.
Overall AUM of EAMC may be greater than CRAMC → but Equity AUM (which is more profitable and hence command higher multiple) of CRAMC is almost 1.5 times to that of EAMC.
Also monthly SIP of CRAMC is Rs. 770 Cr vs Rs. 490 Cr of EAMC (again approx. 1.5 times).
Disc: Not a buy /sell recommendation.
What do you guys think about EAAA? When its ipo is out in April, what’s the pe it would command? What’s the mcap? Isn’t that more valuable than Nuvama, and the rest of WM. And won’t this do 4-5x. It’s the largest alternates right. Should be more than edelweiss mcap right now! Open to debates!
Has anybody studied both Edelweiss and JM Financial? it would be interesting to compare and contrast these two as investment ideas. I see them both as transformation stories, hence the question.
Discl: Invested in JM Financial
Yes I have studied both Edelweiss is much more interesting than jm
Thanks, but details would help, as to how do they compare and contrast. Strengths & weaknesses, capabilities, execution, how & why you think Edelweiss is a better bet, etc.
why do you believe EAAA is a phenomenal company? can you explain in detail pls.