Ishmohit Arora tweeted something important this month: “Writing gives a lot of clarity of mind. Working on a detailed blog on one of the most interesting mental models to identify winning ideas.” Putting thoughts on paper forces sharper reasoning, which is exactly what I’m trying to do with these monthly memos.
Portfolio as of October 1st
| Stocks & Commodities |
Value |
| Gold |
9.7% |
| Narayana Hrudayala |
4.4% |
| Samhi Hotels |
13.5% |
| TD Power |
11.8% |
| JM Financial |
6.4% |
| Aditya Birla Capital |
4.8% |
| Time Technoplast |
2.5% |
| Silver |
13.2% |
| Goodluck India |
5.2% |
| Oswal Pumps |
4.2% |
| Fineotex Chemical |
4.1% |
| Max Estates |
3.9% |
| Parag Milk |
5.0% |
| Cash |
11.4% |
Changes made in September
- Sold off a significant portion of my position in Narayana Hrudayala for better opportunity
- Bought Kilburn Engineering
- Bought Oswal Pumps
- Completely exited Garware Hi-Tech and Pokarna
- Converted my cash from August into Silver
Purchase Theses
- Silver: Historically, silver’s value has averaged around 2% of gold’s. Today, that ratio is only about 1.2%. Applying the mean reversion mental model implies over 50% upside for silver from current levels. Local dealers in HK and China claim that they’ve never seen such a huge demand for physical silver before. This could indicate that people are catching on.
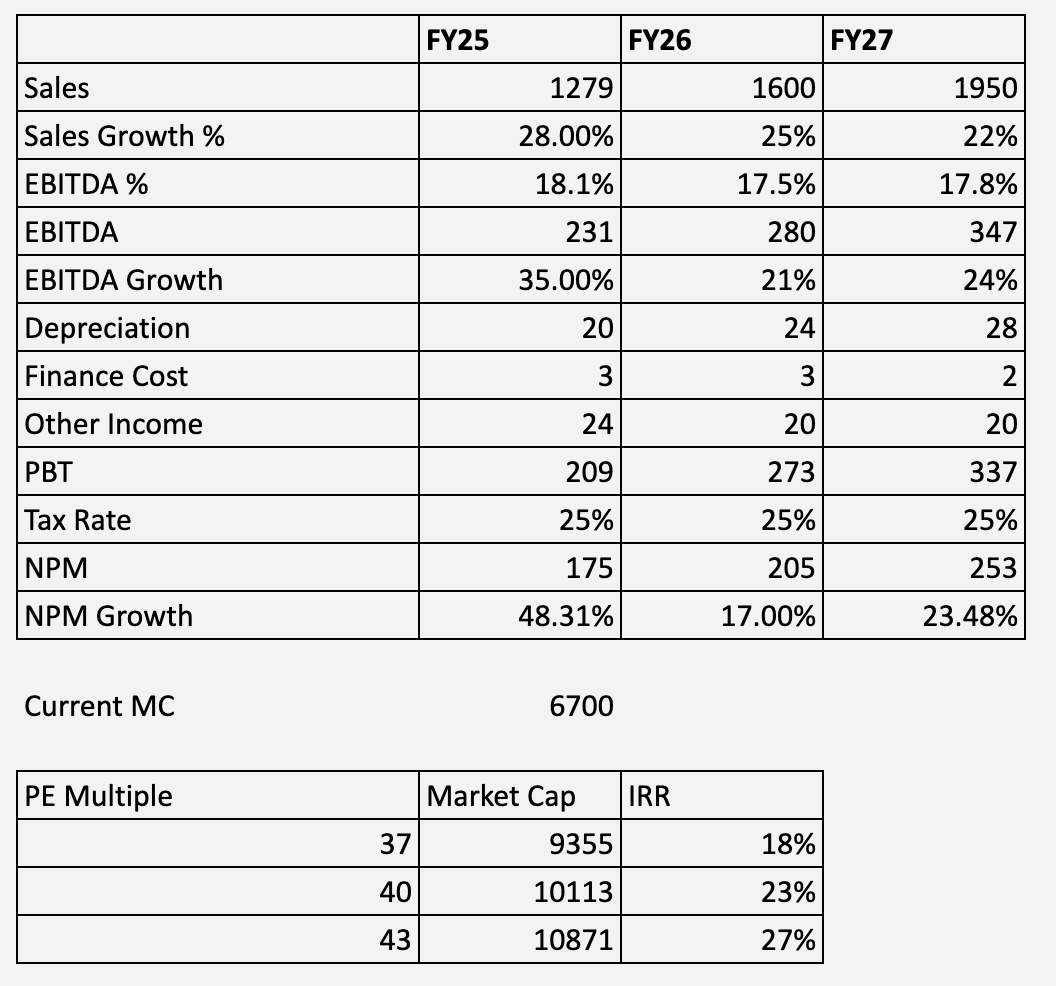
- Kilburn Engineering: I believe this is a niche play with strong order momentum. They’ve got a solid edge in India and are capitalizing from its lower costs relative to global peers. I’ve posted a thorough analysis with the valuation math here.
- Oswal Pumps: One of the only fully vertically integrates companies in the pumps space. They’ve got a huge tailwind from government support (Kusum 2), and are well positioned to capitalize on it. I’ve posted a thorough analysis with the valuation math here.
Key learnings
- In hindsight, it was pointless to sell half my position in Pokarna and Garware last month. The increased tariff was obvious to come, and I should’ve either sold it off completely or held on if I believed it still had value. That’s why I decided to sell it all this month.
- Anchoring bias is very real! I was initially thinking of selling Narayana at the end of August, but since I had seen the previous 2200 levels I was holding off. I always had a view that the market was going to slip downwards, so I should have taken action then!
I’ve learned in these past few months that I tend to jump on opportunities the moment I find them. Since I do a lot of valuation napkin math, I see figures like 20-25% IRR and convince myself that the valuation is right. However, starting valuations matter. It’s why I held off investing more at the start of this month.
James Montier covered this in his book The Little Book of Behavioral Investing: Soccer goalkeepers either dive left or right 94% of the time, hardly ever remaining in the middle of the goal. Yet, they would’ve been much more successful if they just stood in the center! When asked why, they responded that they feel as if they’re making an effort when they dive, and standing in the center made them feel too idle.
Market View
Luke Gromen recently drew a parallel with Tobias Straumann’s book “1931: Debt, Crisis, and the Rise of Hitler”. Just as Germany then faced unpayable debts, inflation-adjusted reparations, and a hollowed-out industrial base while leaders tried to appease both foreign creditors and domestic voters, America today faces a similar mix. Sovereign debt is unrepayable in real terms, entitlements act like inflation-adjusted reparations, and political messaging to foreigners (“strong dollar, fiscal discipline”) directly conflicts with promises made to the domestic population (“no cuts to entitlements”). The result then was rising instability, and today we are seeing echoes in America’s polarization and unrest.
This backdrop explains why gold is drawing renewed attention. Over the past 200 years, periods of gold hoarding have consistently preceded major economic downturns (reference). If history rhymes, we may be entering a danger zone heading into 2026. Every time investors run to gold, it signals a breakdown of trust in the system. Reinforcing this, Morgan Stanley recently recommended a 20% portfolio-level allocation to gold. Meanwhile, U.S. equity funds continue to see persistent outflows, with minimal insider buying.
This matters for India too. Even with sound fundamentals, valuations are vulnerable, and multiples can break.
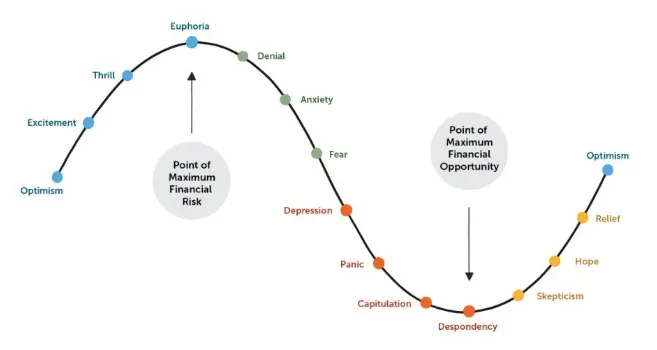
I came across the chart below, which illustrates the Market Psychology Cycle: the emotional journey investors go through across market cycles.
When looking at the Indian markets, I believe we are currently in the Panic or Capitulation stage:
- Macro spillover: Stress in global markets and capital outflows from U.S. equities can trickle down into India, especially as global investors reduce risk.
- Valuation signals: The median PE for the Nifty 500 over the past year has been 24.5. Recently, it has drifted down to 23.5, with the lower bound near 22. This suggests there’s still room before we hit true “Despondency”, which would represent maximum opportunity. But ultimately, what matters is a bottom-up lens because if earnings don’t pick up, the overall market can remain sideways or even biased downward despite cheaper valuations.
- Investor positioning: As I noted in August, several top investors and funds are holding large cash reserves. This indicates they still expect further correction before redeploying.
The challenge now is to prepare for when the cycle turns. As Charlie Munger put it, moments like these are a “trip to the pie counter.” You need to zig when everyone else is zagging!
P.S. I’d love to hear everyone’s thoughts — where do you think we are in the Market Psychology Cycle right now?