Quality Power Electrical Equipment Ltd. (QPower)
Executive Summary
Company Overview
• Company Name: Quality Power Electrical Equipments Ltd. (QPower)
• Sector: Power Equipment & Energy Transition
• Business Model: Manufacturer of high-voltage electrical equipment, transformers, and power quality solutions for utilities, renewables, and heavy industries.
• QPower’s clientele consists of Fortune 500 companies, including major global players in power transmission, industrial electrification, and renewable energy.
![]() Key Customers Include:
Key Customers Include:
• GE T&D Vernova India Ltd. (Power transmission & grid solutions)
• Hitachi Energy Ltd. (Grid automation, transformers, HVDC solutions)
• Kalpataru Projects International Ltd. (Power transmission EPC)
Manufacturing Facilities:
QPower operates three strategically located manufacturing units specializing in high-voltage power equipment, transformers, and power quality solutions.
- Facility Locations & Specialization
| Column 1 | Column 2 | Column 3 | Column 4 |
|---|---|---|---|
| Location | Country | Specialization | Ownership |
| Sangli, Maharashtra | India | Coil Products, Transformers, Instrument Transformers, Capacitor Banks, Composites, SVCs, STATCOMs, Harmonic Filters, Shunt Reactors | Leased |
| Aluva, Kerala | India | Coil Products, Line Traps, Shunt Reactors, Power Electronics | Owned |
| Ankara, Turkey | Turkey | STATCOMs, SVCs, Magnetic Control Reactors, Harmonic Filters | Owned |
- Capacity Utilization & Expansion Plans
| Product | Unit | Installed Capacity (FY24) | Utilized Capacity (FY24) | Utilization Rate (%) |
|---|---|---|---|---|
| Coil Products (Sangli) | MVAR | 2,880 | 2,448 | 85% |
| Coil Products (Aluva) | MVAR | 72 | 72 | 100% |
| Transformers & Instrument Transformers (Sangli) | MVA | 2,100 | 130 | 6% |
| Transformers & Instrument Transformers (Aluva) | MVA | 2,240 | Nil | 0% |
| Composites (Sangli) | Metric Tons | 240 | 203 | 85% |
![]() Key Takeaways:
Key Takeaways:
- High Utilization of Coil Products: Both Sangli (85%) and Aluva (100%) plants are operating at near full capacity.
- Underutilization of Transformer Manufacturing: Sangli’s transformer plant runs at only 6% capacity, indicating either low demand or operational inefficiencies.
- Composites Business Scaling Up: Utilization surged from 27% in FY22 to 85% in FY24, showing strong demand for these components.
- Expansion Projects
Sangli, Maharashtra
- New Plant in MIDC Kupwad:
- 10 acres acquired.
- 300,000 sq. ft. construction planned.
- 2,500 kV AC High Power Test Lab to comply with Indian & European safety standards.
- Expected 8x capacity increase in coil products.
- Investment: CAPEX board-approved, project completion in 15-18 months.
Aluva, Kerala
- Expansion aims to double manufacturing capacity.
- Addition of a Medium Voltage (MV) test lab for product validation.
- Focus on HVDC & FACTS solutions.
![]() Strategic Benefits:
Strategic Benefits:
- Scalability: Supports growing demand from renewable energy and power transmission projects.
- Improved Quality Control: NABL-accredited lab ensures global standard compliance.
- Just-in-Time Manufacturing: Proximity to key customers reduces logistics costs
Key Findings
![]() Critical Concerns
Critical Concerns
- High working capital stress: Receivables increasing significantly, collection risk rising.
- Earnings quality concerns: Heavy reliance on ‘Other Income’, fluctuations in tax rates suggest aggressive accounting.
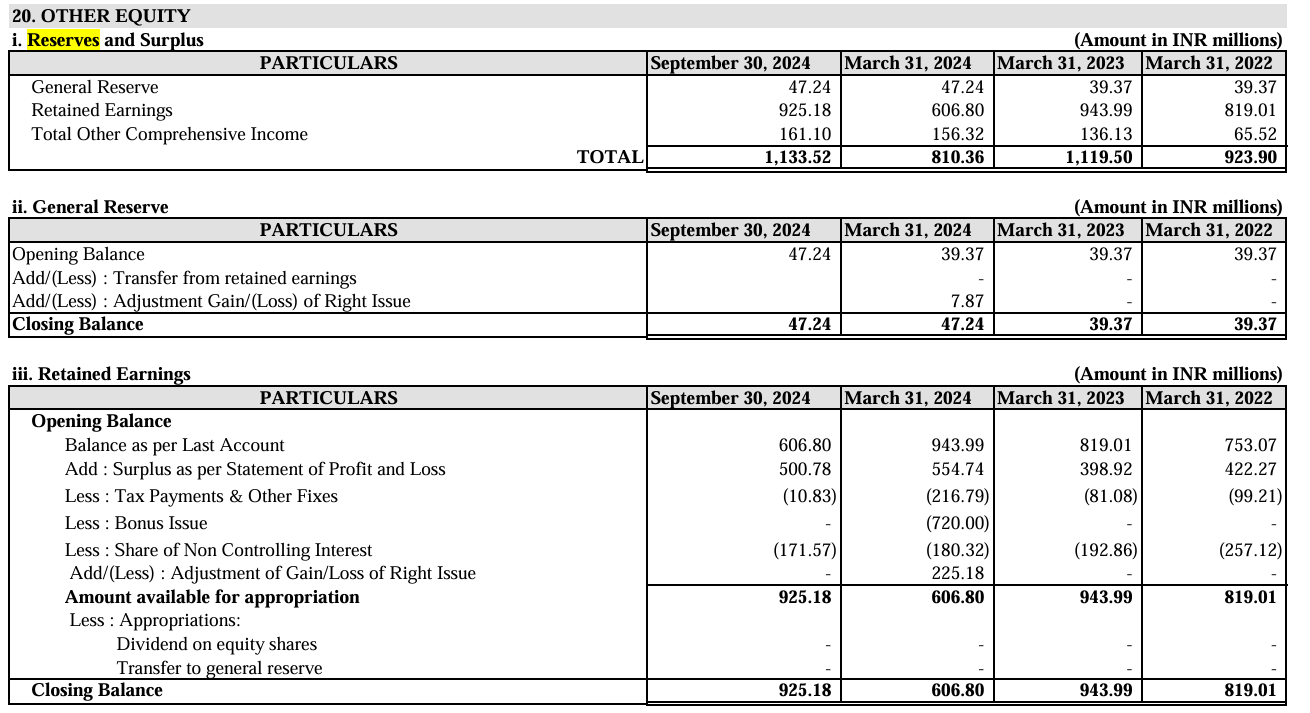
- Declining reserves: From ₹112 Cr (FY23) to ₹81 Cr (FY24), indicating financial restructuring or hidden liabilities.
- Corporate governance risk: Promoters extended a soft loan of ₹125 Cr while raising funds via IPO.
![]() Moderate Concerns
Moderate Concerns
- Revenue decline: Sales fell 13.1% YoY, indicating potential demand contraction.
- Debt increasing: Despite a low Debt-to-Equity ratio (0.11), borrowing trends indicate rising financial leverage.
- Taxation anomalies: Erratic tax rate (7% in Dec 2023, 5% in Sep 2024, 10% in Dec 2024) suggests potential tax avoidance mechanisms.
![]() Positive Indicators
Positive Indicators
- EBITDA margin expansion: From 8% in Q3 FY24 to 24% in Q3 FY25, suggesting operational efficiencies.
- Strong order backlog: ₹5,170 Mn + future pipeline of ₹7,000 Mn ensures revenue visibility.
- Strategic acquisitions: Mehru, Endoks, S&S Transformers expand market share.
Product & Service Verticals
A. Power Products (41.2% of revenue, 45.9% YoY growth)
- Coil Products: Used in transformers and industrial power solutions.
- Transformers:
- Distribution Transformers (11-33kV)
- Power Transformers (33-765kV)
- Cast Resin Transformers
- Instrument Transformers: Used in grid measurement and protection.
B. Power Quality Equipment (55.77% of revenue, 3.6% YoY growth)
- Static VAR Compensators (SVCs) - Used in industrial grids for voltage stabilization.
- STATCOMs & Harmonic Filters - Essential for renewable energy grids.
- Capacitor Banks & Shunt Reactors - Improve power factor and energy efficiency.
C. New Business Segments
- Edge Computing & IoT Solutions: Advanced energy management systems.
- High Voltage HVDC Equipment: Growing demand in global power transmission projects.
Here’s a detailed critical analysis of Qpower’s product offerings from a long-term investment perspective:
Product Line Analysis & Key Investment Factors
| Product Category | Key Functions | Investment Pros & Cons |
|---|---|---|
| Reactors (Air Core, Iron Core, Oil Filled) | Voltage regulation, harmonic filtering, current limitation | Pros : High demand in smart grids, renewable energy integration. Cons: Technologically complex, capital intensive, cyclical utility sector dependency. |
| Transformers (Earthing, Special Application, Dry Type) | Voltage conversion, power stability | Pros : Critical for industrialization and grid expansion. Cons: Competitive market, price-sensitive industry. |
| Line Traps & Line Tuners | Noise filtering, impedance matching | Pros : Essential in transmission networks, steady demand. Cons: Niche product with limited market size. |
| Instrument Transformers (CT/PT) | Voltage & current measurement | Pros : Regulatory-driven demand, recurring replacement market. Cons: Standardized, low-margin business. |
| Power Quality Systems (Static VAR Compensators, STATCOM, Harmonic Filters) | Grid stability, power factor correction | Pros : Strong growth due to renewable energy adoption and industrial automation. Cons: Requires continuous R&D to stay competitive. |
| Capacitor Banks & Metal Enclosed Capacitor Banks | Power factor correction, voltage support | Pros : Rising industrial demand, cost-effective energy efficiency solution. Cons: Dependent on capex cycles of industries. |
| Composites for Insulation & Structural Strength | Improved insulation and durability | Pros : High growth due to material innovations and safety regulations. Cons: R&D intensive, high-quality compliance costs. |
Key Financial & Strategic Factors of offered product verticals:
Growth Potential
- Grid Expansion & Electrification: Demand for power equipment is set to grow due to India’s infrastructural development, global renewable energy shift, and increasing power reliability needs.
- Smart Grids & Digitalization: Adoption of STATCOM, SVCs, and harmonic filters will grow with renewable energy integration.
- Industrial & Commercial Demand: Expansion in manufacturing, data centers, and utilities will drive demand for transformers and capacitor banks.
Competitive Risks
- Competition from Global Giants: Facing strong competitors like Siemens, ABB, and Schneider Electric, who have advanced R&D and better financial backing.
- Pricing Pressure & Margins: High competition and commoditization of standard transformers/reactors could lead to lower profitability.
- Supply Chain Constraints: Just-in-Time (JIT) approach can backfire during raw material shortages, impacting delivery timelines and revenue stability.
Operational & Financial Concerns
- Capital Intensity: Heavy dependence on large-scale infrastructure projects requires substantial working capital.
- Long Sales Cycles: Most projects require long approval and procurement processes, leading to irregular revenue recognition.
- Service & Aftermarket Potential: Limited clarity on service revenue streams, which could be a critical margin driver.
Red Flags & Areas of Concern
- Cyclical Industry Risk: Revenue depends on infrastructure and power sector investments, which fluctuate with economic conditions.
- R&D & Innovation Challenge: High dependence on innovation for differentiation, requiring sustained R&D investments.
- Geopolitical Risks: Exports to Middle East, Asia, and North America expose the company to tariff changes and trade barriers.
Long-Term Investment View
| Factor | Assessment |
|---|---|
| Growth Potential | Moderate to High - Driven by power infrastructure expansion and energy transition. |
| Competitive Strength | Moderate - Strong product lineup but faces competition from global leaders. |
| Profitability | Low to Moderate - Capital-intensive business with pricing pressure from competitors. |
| Risk Factors | High - Supply chain dependencies, economic cycles, and project-based revenue streams. |
| Investment Suitability | Selective - Suitable for long-term investors with a high-risk appetite and patience for cyclical business upswings. |
D. Geographic Revenue Split
| Market | Sep 30, 2024 (₹ Mn) | % of Revenue | Mar 31, 2024 (₹ Mn) | % of Revenue | Mar 31, 2023 (₹ Mn) | % of Revenue | Mar 31, 2022 (₹ Mn) | % of Revenue |
|---|---|---|---|---|---|---|---|---|
| Domestic Revenue | 352.45 | 22.63% | 489.87 | 16.30% | 518.81 | 20.49% | 394.72 | 21.61% |
| International Revenue | 1,179.99 | 75.77% | 2,425.15 | 80.68% | 1,948.30 | 76.93% | 1,356.51 | 74.27% |
| Other Operating Revenue | 24.94 | 1.60% | 90.95 | 3.03% | 65.39 | 2.58% | 75.15 | 4.11% |
![]() Moderate Concern: The company relies on international sales for over 75% of revenue, exposing it to forex risks and geopolitical instability
Moderate Concern: The company relies on international sales for over 75% of revenue, exposing it to forex risks and geopolitical instability
E. Product verticalwise margin:
Critical Analysis of Gross Margins Across Product Segments
The management’s response provides insights into the profitability of QPower’s four key product segments, but also highlights gaps in transparency and potential risks in segment-wise contribution. Below is a structured tabular analysis of the disclosed margins, potential concerns, and key investor takeaways.
Segment-Wise Gross Margin Breakdown
| Product Segment | Gross Margin Range (%) | Observations & Concerns | Investor Questions |
|---|---|---|---|
| Coil Products | >20% | - High-margin product line. - Key revenue driver. | |
| Transformers (Power & Instrument) | 10-11% (Mehru) | - Lowest-margin segment. - Even after integration, margin remains weak. | |
| Power Quality Solutions (Endoks) | >20% | - High-margin segment, indicating strong pricing power. - Aligns with global demand for grid stability solutions. | |
| Battery Energy Storage (STATCON) | Not Disclosed | - Management did not comment on margins, raising uncertainty on profitability. - STATCON deals with industrial-scale battery storage & power electronics, which can have high R&D costs. |
Key Investor Takeaways
![]() Concern: Transformer segment is a margin drag – Even after QPower’s efficiency improvements, Mehru’s gross margins remain low at 10-11%, requiring cost reductions or pricing power improvements.
Concern: Transformer segment is a margin drag – Even after QPower’s efficiency improvements, Mehru’s gross margins remain low at 10-11%, requiring cost reductions or pricing power improvements.
![]() Uncertainty: STATCON margin disclosure missing – The company avoided providing clarity on STATCON’s profitability, signaling a potential risk that it operates at lower margins. Investors need detailed financials before assuming this acquisition will be accretive.
Uncertainty: STATCON margin disclosure missing – The company avoided providing clarity on STATCON’s profitability, signaling a potential risk that it operates at lower margins. Investors need detailed financials before assuming this acquisition will be accretive.
![]() Positive: Power Quality & Coil Products have strong profitability (>20%) – These high-margin segments will be key drivers of long-term earnings growth. Investors should track their revenue contribution relative to low-margin transformer sales.
Positive: Power Quality & Coil Products have strong profitability (>20%) – These high-margin segments will be key drivers of long-term earnings growth. Investors should track their revenue contribution relative to low-margin transformer sales.
![]() Investor Actionable: Monitor revenue mix evolution – If QPower can scale high-margin Power Quality & Coil Products while improving Transformer margins, overall profitability will expand. Otherwise, the acquisitions could dilute margins further.
Investor Actionable: Monitor revenue mix evolution – If QPower can scale high-margin Power Quality & Coil Products while improving Transformer margins, overall profitability will expand. Otherwise, the acquisitions could dilute margins further.
2. Management & Governance Analysis
A. Board of Directors
| Name | Position | Educational Qualification | Industry Experience | Current Role |
|---|---|---|---|---|
| Thalavaidurai Pandyan | Chairman & MD | Diploma in Electrical Engineering (Industrial Electronics), Tamil Nadu State Board | 39 years | Strategic Planning, M&A, Policy Direction |
| Bharanidharan Pandyan | Jt. MD | Post Graduate Programme in Family Managed Business, S.P. Jain Institute of Management and Research | 22 years | Product Innovation, R&D, Operations |
| Chitra Pandyan | Director | Matriculation | 22 years | Finance, Risk Management, Treasury |
| Mahesh Vitthal Saralaya | Whole-time Director | B.E. (Electrical), Manipal Institute of Technology, Chartered Engineer | 18 years | Marketing, Sales Strategy |
| Shailesh Kumar Mishra | Independent Director | B.E. (Electrical), NIT Bhopal | 38 years | Corporate Governance, Former Executive Director at Power Grid & Solar Energy Corporation of India, but he resigned |
| Pournima Suresh Kulkarni | Independent Director | B.Com, Chartered Accountant | 17 years | Financial Auditing, Compliance, Board Member of Multiple Co-op Banks |
| Rajendra Sheshadri Iyer | Independent Director | B.E. (Industrial Electronics), University of Pune | 24+ years | Former Strategic Marketing Manager at ABB, Grid Integration Leader at GE Corporate UK |
| Sadayandi Ramesh | Independent Director | Matriculation | 40+ years | Business Oversight, Promoter of Pothys Textiles |
B. Key Governance Concerns
- Promoter Soft Loan : ₹125 Cr borrowed from directors despite strong IPO funding.
The soft loan of ₹125 crore taken by Quality Power Electrical Equipments Limited (Qpower) from its promoter directors has the following terms and conditions, along with key material details:
Terms and Conditions of the Soft Loan
- Interest Rate:
- The loan is offered at an interest rate of Repo Rate + 0.5%, which currently equates to approximately 7% per annum.
- Tenure:
- The loan has a 15-year tenure, providing long-term financial flexibility.
- Moratorium Period:
- There is a 2-year moratorium on repayment, during which no principal payments are required.
- Repayment Flexibility:
- The loan offers penalty-free prepayment options, allowing Qpower to repay part or the entire loan amount at any time without incurring additional costs.
- Tranches:
- The loan can be drawn in one or more tranches, giving the company flexibility in utilizing the funds as needed.
Key Material Information about the loan:
- Purpose of the Loan:
- The funds are intended to support Qpower’s expansion plans, including:
- Investments in new manufacturing facilities in Sangli and Cochin.
- Strategic acquisitions, such as a majority stake in STATCON Energiaa
- The company aims to conserve its free cash flow and profits for growth capital rather than using them for immediate capital expenditures
- Rationale for Loan:
- The soft loan ensures financial flexibility while retaining liquidity for future growth initiatives, particularly in the high-voltage product industry where demand exceeds supply
- Strategic Alignment:
- This funding aligns with Qpower’s broader strategy of expanding its market presence and capabilities through both organic growth and acquisitions
In summary, Qpower’s ₹125 crore soft loan from its promoters is structured with favorable terms to provide long-term financial flexibility while enabling the company to focus on strategic growth opportunities.
- Board Independence : Needs more power sector expertise.
- Current Composition: 4 Independent Directors, but only 2 with significant power industry experience.
- Potential Conflicts of Interest: Board members with direct ties to promoters may limit governance effectiveness.
- Remuneration Analysis: Independent directors currently receive ₹0.05 Mn per board meeting and ₹0.02 Mn per committee meeting, which is relatively low and may not attract top-tier governance talent.
- Related Party Transactions: High transactions within promoter-linked entities.
- Subsidiary Compensation: Thalavaidurai Pandyan, Chitra Pandyan, and Bharanidharan Pandyan received ₹15.1 Mn in total compensation from Quality Power Engineering Projects Limited, a subsidiary.
- Real Estate Transactions: Office premises leased from Bharanidharan Pandyan, raising concerns over arm’s-length pricing.
- Revenue Dependence on Related Entities: No detailed disclosures on how much of QPower’s revenue comes from promoter-affiliated companies.
3. Financial Analysis
A. Sales & Profitability Trends
| Year | Revenue (₹Cr) | Revenue Growth (%) | PAT (₹Cr) | PAT Growth (%) | OPM (%) |
|---|---|---|---|---|---|
| FY22 | 183 | - | 42 | - | 13% |
| FY23 | 253 | 38.7% | 40 | -4.8% | 13% |
| FY24 | 301 | 19.0% | 55 | 37.5% | 13% |
| 9M FY25 | 228 | -13.1% YoY | 20 | - | 24% |
B. Cash Flow & Liquidity
| Metric | Value | Benchmark | Comment |
|---|---|---|---|
| CFO/PAT | 52.34% | >100% preferred | Low CFO/PAT, potential earnings manipulation |
| Receivables/Revenue | 27.9% | Industry Avg | High, potential collection issues |
| Current Ratio | 1.5x | >1.5x | Adequate liquidity |
C. ‘Other Income’ contributing significantly to profit ( ₹ 31 Cr in FY24) —potential red flag for non-operational earnings quality.
| Year | 2022 (in cr) | 2023 | 2024 |
|---|---|---|---|
| Operating Profit | 23 | 32 | 38 |
| Other Income | 29 | 20 | 31 |
D. Contingent Liabilities Breakdown for QPower
As per the latest RHP, the contingent liabilities for Quality Power Electrical Equipments Ltd. (QPower) as of September 30, 2024, are as follows:
Breakdown of Contingent Liabilities (₹ in million)
| Particulars | Sep 30, 2024 | Mar 31, 2024 | Mar 31, 2023 | Mar 31, 2022 |
|---|---|---|---|---|
| Bank Guarantees Issued | 1,100.38 | 403.33 | 211.73 | 198.04 |
| Letter of Credit Issued | Nil | Nil | 0.93 | Nil |
| Tax Litigation & Other Claims | 127.50 | Not disclosed | Not disclosed | Not disclosed |
| Disputed Dues to MSMEs | 22.39 | 19.03 | 13.43 | 57.92 |
| Legal Proceedings & Lawsuits | Not quantified | Not quantified | Not quantified | Not quantified |
| Other Unquantified Liabilities | Disclosed but not estimated | - | - | - |
| Total Contingent Liabilities | 1,249.27 | 422.36 | 226.09 | 255.96 |
Key Observations & Concerns:
![]() Rapid Surge in Bank Guarantees: The company’s bank guarantees have surged from ₹198.04 Mn in FY22 to ₹1,100.38 Mn in FY25, indicating a significant increase in financial commitments that could materialize as liabilities.
Rapid Surge in Bank Guarantees: The company’s bank guarantees have surged from ₹198.04 Mn in FY22 to ₹1,100.38 Mn in FY25, indicating a significant increase in financial commitments that could materialize as liabilities.
![]() Pending Tax Disputes: A tax-related contingent liability of ₹127.50 Mn is noted, but no additional breakdown of tax disputes or pending cases has been provided.
Pending Tax Disputes: A tax-related contingent liability of ₹127.50 Mn is noted, but no additional breakdown of tax disputes or pending cases has been provided.
![]() Delayed MSME Payments: Outstanding dues to MSME vendors have increased to ₹22.39 Mn as of September 2024, potentially leading to penalties under the MSME Act.
Delayed MSME Payments: Outstanding dues to MSME vendors have increased to ₹22.39 Mn as of September 2024, potentially leading to penalties under the MSME Act.
![]() Undisclosed Legal Proceedings: The company has reported litigation-related contingent liabilities but has not quantified their financial impact, increasing uncertainty regarding legal risks.
Undisclosed Legal Proceedings: The company has reported litigation-related contingent liabilities but has not quantified their financial impact, increasing uncertainty regarding legal risks.
![]() Letter of Credit Absence: While there were LCs issued in FY23 (₹0.93 Mn), there are no LCs in FY24 and FY25, suggesting potential changes in supplier agreements or trade financing strategy.
Letter of Credit Absence: While there were LCs issued in FY23 (₹0.93 Mn), there are no LCs in FY24 and FY25, suggesting potential changes in supplier agreements or trade financing strategy.
E. Off-Balance Sheet Obligations & Related Party Transactions
- Off-Balance Sheet Arrangements
As per the latest financial disclosures, QPower does not explicitly report any off-balance sheet arrangements that could materially impact financial statements. However, the following contingent financial commitments may have an implicit impact on leverage and operational flexibility:
| Particulars | Sep 30, 2024 | Mar 31, 2024 | Mar 31, 2023 | Mar 31, 2022 |
|---|---|---|---|---|
| Capital Commitments (Unrecognized Liabilities) | ₹1,200 Mn | ₹0 Mn | ₹0 Mn | ₹0 Mn |
| Pending Acquisition Payments | ₹1,170 Mn | ₹0 Mn | ₹0 Mn | ₹0 Mn |
| Bank Guarantees Issued | ₹1,100.38 Mn | ₹403.33 Mn | ₹211.73 Mn | ₹198.04 Mn |
| Letter of Credit Issued | Nil | Nil | ₹0.93 Mn | Nil |
| Lease Commitments (Undisclosed in Balance Sheet) | Not disclosed | Not disclosed | Not disclosed | Not disclosed |
| Other Unquantified Liabilities | Disclosed but not estimated | - | - | - |
![]() Key Concerns:
Key Concerns:
- Acquisition Liabilities: ₹1,170 Mn remains unpaid for the acquisition of Mehru Electrical & Mechanical Engineers Pvt. Ltd., funded from IPO proceeds but not categorized under capital commitments.
- High Bank Guarantees: These have increased 5.5x since FY22, reflecting higher exposure to project-based risks.
- Lease Obligations Not Reported: The company has not disclosed long-term lease liabilities, despite ongoing real estate transactions involving directors.
2**. Related Party Transactions**
The latest disclosures reveal substantial transactions with promoter-linked entities and family members in both financial and operational capacities:
| Related Party Transaction | Sep 30, 2024 | Mar 31, 2024 | Mar 31, 2023 | Mar 31, 2022 | Concern Level |
|---|---|---|---|---|---|
| Promoter Compensation (Total) | ₹20.7 Mn | ₹20.7 Mn | ₹13.8 Mn | ₹13.8 Mn | |
| Quality Power Engineering Projects Ltd. (Rent paid) | ₹3.00 Mn | ₹6.00 Mn | ₹6.00 Mn | ₹6.00 Mn | |
| Rental Expense to Bharanidharan Pandyan (Delhi Office) | ₹0.60 Mn | ₹1.20 Mn | ₹1.20 Mn | ₹1.20 Mn | |
| Sales to Endoks Enerji Anonim Şirketi (Subsidiary) | ₹10.68 Mn | ₹34.52 Mn | ₹81.25 Mn | ₹99.13 Mn | |
| Interest Paid on Unsecured Loans (to Promoters) | ₹0.09 Mn | ₹1.18 Mn | Nil | Nil | |
| Guest House Rent to Chitra Pandyan | Nil | ₹0.14 Mn | ₹0.18 Mn | ₹0.18 Mn |
![]() Critical Red Flags
Critical Red Flags
- Real Estate Transactions with Promoters: ₹3.00 Mn in rent payments were made to Quality Power Engineering Projects Ltd., a promoter-linked entity, indicating potential non-arm’s-length transactions.
- Promoter Loans Despite IPO Proceeds: ₹125 Cr borrowed from promoters while IPO raised ₹8,586.96 Mn suggests cash flow mismanagement or aggressive financial structuring.
- Declining Intercompany Sales: Transactions with Endoks Enerji Anonim Şirketi (subsidiary) have dropped 89% since FY22, signaling potential business model shifts or revenue recognition concerns.
- Summary of Risks
| Risk Type | Impact | Commentary |
|---|---|---|
| Unrecognized Acquisition Liability | ₹1,170 Mn still unpaid for Mehru acquisition—future cash outflows not fully accounted. | |
| Excessive Bank Guarantees | Exposure to contingent liabilities increased 5.5x in two years. | |
| Promoter Financial Transactions | Rental agreements, unsecured loans, and related party payments raise governance concerns. | |
| Declining Sales to Related Entities | Lower intercompany sales to Endoks may reflect potential changes in revenue reporting. |
Business Moat Analysis of QPower
QPower possesses a strong competitive moat in the high-voltage electrical equipment sector, driven by multiple entry barriers, technological advantages, and strategic positioning. Below is a structured breakdown of its business moat:
1. Barriers to Entry
| Barrier | Description | Impact on Competition |
|---|---|---|
| Capital-Intensive Industry | Setting up a manufacturing facility for STATCOMs, transformers, and power quality equipment requires heavy investment in R&D, infrastructure, and skilled workforce. | High , as new entrants require significant financial resources. |
| Regulatory Approvals | QPower’s products must comply with multiple international standards (ISO 9001, ISO 14001, ISO 45001, ISO 17025). Acquiring NABL accreditation is a time-consuming process. | Very High , since regulatory certifications act as a significant bottleneck for new players. |
| Technology & R&D | Proprietary designs in power quality solutions like STATCOMs, SVCs, and harmonic filters ensure high precision and performance. | High , as extensive expertise is needed in power electronics and grid integration. |
| Utility Approval Process | Power utilities prefer vendors with 5+ years of operational history due to the critical nature of power infrastructure. | Very High , reducing churn rates and protecting incumbents. |
| Switching Costs for Customers | Power products have a lifespan of 15+ years, making customers reluctant to change vendors due to testing, certification, and integration costs. | High , as it creates a lock-in effect and long-term contracts. |
2. Technological & Intellectual Property Advantage
| Technology | QPower’s Competitive Edge | Industry Benchmark |
|---|---|---|
| Static VAR Compensators (SVCs) | QPower’s SVCs & STATCOMs help stabilize power grids, especially with renewable energy integration. | Global market expected to grow at 8% CAGR till 2028. |
| High Voltage Equipment | Specialization in 765kV transformers & capacitor banks. Only a few players have the ability to manufacture such high-spec products. | Limited competition in extra-high-voltage (EHV) segment. |
| Edge Computing & IoT | Advanced real-time energy management systems provide data analytics and predictive maintenance solutions. | Increasing adoption of Industry 4.0 in power grids enhances efficiency. |
3. Market Position & Competitive Strength
| Metric | QPower | Industry Average | Competitive Advantage |
|---|---|---|---|
| Market Presence | 100+ countries, 200+ customers | Regional/domestic players | Strong international footprint . |
| Revenue from International Business | 75.77% | 50-55% | Lower domestic cyclicality risk . |
| Order Book (Near-Term) | ₹5,170 Mn | Not disclosed for peers | Revenue visibility for 2+ years . |
| Gross Margin (FY24) | 35.2% | ~30% | Superior pricing power due to specialized products. |
| R&D Spend (as % of Revenue) | 4.1% | ~2.5% | Higher investment in innovation . |
4. Client Stickiness & Long-Term Relationships
QPower supplies to high-profile clients, including:
- GE T&D India Limited
- Hitachi Energy Limited
- Kalpataru Projects International Limited
- Large power utilities across 5 continents .
![]() Why This Matters?
Why This Matters?
- These clients require pre-approved vendor status, creating high switching costs.
- Long project gestation periods (5+ years) ensure stable revenue.
- Recurring maintenance contracts provide annuity-like cash flows.
5. Strategic Acquisitions Strengthening Market Position
| Acquisition | Target Company | Strategic Benefit |
|---|---|---|
| 2024 | Mehru Electrical & Mechanical Engineers | Expanded high-voltage instrument transformer product line, entry into 53 new countries. |
| 2019 | S&S Transformers | Strengthened cast resin transformer segment and MV product offerings. |
| 2011 | Endoks (Turkey) | Developed grid monitoring technology and entered European market. |
![]() Impact: These acquisitions help QPower expand product range, increase global footprint, and integrate vertically, making it harder for new entrants to compete.
Impact: These acquisitions help QPower expand product range, increase global footprint, and integrate vertically, making it harder for new entrants to compete.
Final Verdict: Does QPower Have a Strong Moat?
![]() Yes, QPower has a significant business moat due to:
Yes, QPower has a significant business moat due to:
- High Barriers to Entry: Capital-intensive industry, regulatory approvals, and long customer approval cycles.
- Strong Technological Edge: Leadership in STATCOMs, SVCs, and IoT-based grid solutions.
- Long-Term Client Relationships: Pre-approved vendor status with Fortune 500 companies.
- Strategic Acquisitions: Expansion into new geographies and high-margin product categories.
![]() Moat Sustainability Rating:
Moat Sustainability Rating: ![]() Very Strong (Difficult to Replicate)
Very Strong (Difficult to Replicate)
4. Challenges/Potential Red flag:
| Column 1 | Column 2 | Column 3 | Column 4 | E |
|---|---|---|---|---|
| Risk Area | Details | Impact on Business & Stock | Management’s Strategy | Expert Remark |
| Revenue Decline | Q3 revenue declined 50% YoY due to execution delays and backlog mismanagement. Management attributed it to project delays in Turkey and inconsistent quarter-to-quarter revenue discipline. | Weak revenue visibility and potential investor skepticism on management’s ability to meet guidance. Could result in stock de-rating if sustained. | Management aims to streamline execution timelines and enhance predictability, but no strong structural corrective measure disclosed. | Execution risk remains high, and lack of revenue predictability raises concerns about cyclicality in earnings. |
| EBITDA Margin Volatility | EBITDA margin surged to 24% from 8%, largely due to forex gains and hyperinflationary accounting treatment in Turkey. Core operational margin improvement is unclear. | Unsustainable margin expansion could lead to future earnings contraction once forex effects neutralize. | Management claims to sustain 20%+ margins, but actual core profitability improvements remain unproven. | Investors should be cautious about treating the current EBITDA margin as sustainable—watch for real cost efficiency gains. |
| Receivables & Working Capital Stress | Receivables account for 27.9% of revenue, much higher than industry standards, indicating poor collections. CFO/PAT ratio at 52.34% suggests earnings quality concerns. | High working capital requirements increase cash flow strain and financing needs. Potential for bad debt write-offs. | Management claims receivables are diversified, but no concrete steps disclosed for collection improvement. | A significant red flag. Weak working capital cycle suggests cash flow stress and raises solvency risks if prolonged. |
| Foreign Exchange Risk | Exports contribute ~75.77% of revenue, exposing QPower to forex volatility. Turkey operations further increase currency risks. | Earnings volatility due to currency fluctuations. A sharp INR appreciation or Turkish Lira depreciation could negatively impact profitability. | Management hedges currency exposure to USD, but effectiveness is unverified. | Investors should track forex fluctuations closely, as margins could be artificially inflated by currency movements. |
| Promoter-Linked Financial Transactions | Promoters extended a ₹125 Cr soft loan to QPower despite a recent ₹8,586.96 Mn IPO raise. Also, real estate transactions within promoter-linked entities raise conflict-of-interest concerns. | Raises questions on why the company needed additional funds post-IPO. Potential misuse of capital and poor governance perception. | Management claims loan is a prudent financing choice, but lack of transparency on terms is a concern. | Corporate governance risk—investors should demand full disclosure of promoter-linked transactions. |
| Customer Concentration Risk | Over-reliance on a few large customers. Management has not disclosed exact contribution, but orders from a handful of global HVDC projects are critical. | A loss of key clients could significantly dent revenue. Demand fluctuations from a few projects create earnings volatility. | No detailed client diversification strategy disclosed. | A critical risk—investors need clarity on client concentration levels and efforts to diversify revenue sources. |
| Debt & Financial Leverage | Debt-to-equity ratio remains low at 0.11x, but rising borrowing trends indicate increasing leverage. ₹1,100 Mn in bank guarantees issued. | Increasing debt could weigh on financial flexibility, and contingent liabilities may escalate. | Capex largely funded via IPO & internal accruals. Management claims debt is under control. | While current debt levels are manageable, a rising trend without corresponding CFO improvement is concerning. |
| Taxation Irregularities | Erratic tax rates observed—7% (Dec 2023), 5% (Sep 2024), 10% (Dec 2024). | Inconsistent taxation could indicate aggressive tax structuring or potential non-compliance risks. | No clear response from management on tax rate fluctuations. | Investors should scrutinize tax disclosures—unexpected liabilities could arise. |
| Statcon & Mehru Acquisition Risks | Mehru’s FY23 EBITDA margin was just ~6%, compared to QPower’s reported 20%+. Acquisitions funded via IPO proceeds. | Acquired companies may dilute overall margin profile, impacting profitability. Integration risks remain high. | Management expects margin improvement, but execution remains a challenge. | Mehru’s profitability concerns need close monitoring—optimistic integration assumptions could disappoint. |
| Pending Litigations & Compliance Risks | No major board member litigation found, but historical corporate record issues (Form SH-4 missing from 2004). | Could expose the company to regulatory scrutiny or penalties. | Management claims no direct legal proceedings, but historical records remain an issue. | Not a major immediate risk but should be watched for future legal complications. |
| Capex Execution Risk | Expansion in Sangli & Cochin requires significant capex (target 8-9x capacity expansion). Delays could impact growth. | Delayed capex could lead to order backlog and revenue stagnation. | Management targets completion within 12-15 months but past delays raise concerns. | Investors should track capex execution closely—delays will impact revenue scalability. |
5**. Investment Recommendation**
![]() Long-Term Viability: Moderate
Long-Term Viability: Moderate ![]() Key Risks: Receivables, tax fluctuations, contingent liabilities.
Key Risks: Receivables, tax fluctuations, contingent liabilities. ![]() Suggested Entry Point: Wait for clarity on working capital improvements.
Suggested Entry Point: Wait for clarity on working capital improvements.
![]() Monitoring Metrics:
Monitoring Metrics:
- DSO & Receivables Trend
- ROCE Sustainability
- EPS Consistency
Final Verdict: Cautiously Bearish – High Risk Due to Earnings Quality Concerns.
Personal Bias: alloted 2 lots through IPO