
Almost nobody was buying equities at the market lows of 2009 and 2020. Today, almost everybody knows that stocks will outperform over the long run. That shift in consensus is worth pausing on.
So what exactly are these investors buying? When you put money into a large-cap fund, a flexi-cap fund, or even many mid and small-cap schemes, you are, one way or another, overwhelmingly buying the Nifty 50. Over 50% of flexi-cap holdings are Nifty 50 stocks. Even mid and small-cap schemes park close to 30% of their money in Nifty 50 names. The Nifty 50 is, for better or worse, the engine of the Indian retail investor’s wealth.
And most investors have never stopped to ask: at what price, and on what assumptions?
That is the question this piece tries to answer, not through charts, not through economic forecasting, and certainly not through witchcraft. But through a simple, rigorous framework that breaks down exactly where returns come from, where they came from over the last decade, and what that tells us about the decade ahead.
Five factors combine to determine total investment returns in common stocks:
• Rupee sales growth
• Changes in profit margins
• Changes in the multiple paid to earnings
• Changes in shares outstanding
• Dividend yields
The total return from common stocks, whether the entire market, an index or an individual stock, derives from five factors but begins by breaking return down into three base components – growth in earnings per share, change in the P/E multiple, and return from dividends.
Total return is easily calculated by multiplying the change in EPS by multiple growth and adding the dividend yield:
Total Return = (EPS Growth x Change in P/E Multiple) + Dividend Yield
Growth in earnings per share can be further derived from change in the net margin and change in sales per share:
EPS Growth = Sales Per Share Growth * Margin Growth
Sales per share growth can be further broken down into Sales Growth in Rupees divided by Change in number of shares outstanding:
Sales Per Share Growth = Sales Growth in ₹ / Change in Shares Outstanding
Calculation of annual price return (PR below or Price Return) broken down by the full set of variables (again, other than dividend yield) is a multiplicative function of each component. Formulaically, the amount of “1” is added to the percent growth rate for each component, with the amount of “1” then subtracted after the multiplicative function to arrive at a percent return.
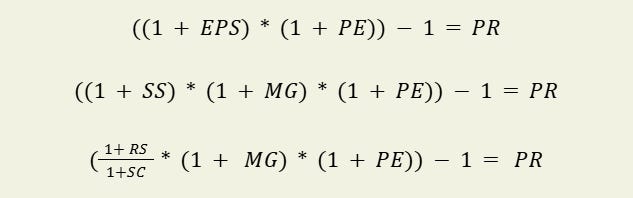
And for Total Return (TR), we add the Dividend Yield (DY) to Price Return (PR):

For the above formulas, the variables are:

Growth Rates Approximate the proportion of return attributed to each factor but are not precisely mathematically correct. For the ease of math and use for those interested in utilizing the five factors I am content with the math roughly being right.
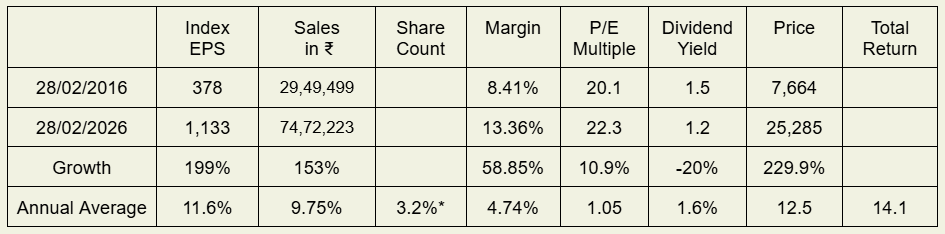
*Change in Share Count is an estimate based on the difference between Sales in ₹ CAGR and Index Level Revenue CAGR since NSE does not provide any data on the index divisor.
On the surface, the Nifty 50 looks reasonably priced. A P/E of 22.3 (March 2026) is neither cheap nor expensive, it sits almost exactly at its long-term median of 22.5. Glance at that number and it’s easy to conclude that the market is fairly valued, and that the next decade should look roughly like the last one.
Most retail investors are doing exactly that, extrapolating the last decade’s returns of close to 14-15% annually and expecting more of the same.
But the surface is precisely where you shouldn’t stop.
Look at the table again. Of the roughly 14% annual return the Nifty 50 delivered over the last decade, nearly 4.5% came from a single source, expanding profit margins. Strip that out and the index returned somewhere in the 7-8% range. That’s not a bad return, but it’s not the double-digit compounder your neighbour was bragging about at dinner. It’s closer to a government bond with more volatility.
The uncomfortable question is: can margins expand from here?
Almost certainly not at the same pace. Margins of 13.36% are close to a secular peak by any historical measure. Adam Smith’s invisible hand has a long memory, high returns in industries with low barriers to entry attract competition, and competition compresses margins.
The laws of economics can be ignored, but they cannot be repealed. What took a decade of favorable conditions to build can erode quietly and steadily.
So if margins can’t be counted on, perhaps growth picks up the slack?
That’s a harder case to make than it sounds. The Nifty 50’s strong revenue growth over the last decade was flattered by two things — a sharp post-Covid snapback and a prolonged period of elevated inflation, where rising input costs were simply passed through to the customer.
Both of those tailwinds are fading. It becomes genuinely difficult to build a credible case for sustained 10% revenue growth when nominal GDP is likely to expand closer to the mid-single digits.
The math is not complicated. It’s just uncomfortable.
The retail investor who came into the market watching their neighbour get rich, who was told by every ad and every influencer that equity is safe and SIPs are the answer, is working with an expectation shaped by an unusually favorable decade.
A decade where margins expanded, where post-Covid growth was extraordinary, where multiple factors aligned in the market’s favor simultaneously. Expecting that to simply repeat is not optimism. It’s extrapolation, and extrapolation is one of the most expensive habits in investing
The Multiplicative dance of these factors is useful for assessing past returns. Their interplay is equally useful in helping project future returns.
Discounted-cash-flow analysis gets the investor to the same place but spending time analyzing the impacts on and sources of sales growth, how and why profit margins changed or may change is far more meaningful than debating terminal growth rate beginning a decade or more from now or considering beta as a component of measuring the cost of equity capital
The future direction and rate of change of the five factors is essential in the analysis and valuation of business. Spend too little time or no time thinking through the futures and well, good luck.
Today Nifty 50 investors are certainly entitled to their belief of 12-15% returns annually. But plug in any combination of expectations for the factors and see what you come up with.
I further don’t endorse the short-term buying and selling of the broad stock market based on technical analysis, economic forecasting or witchcraft. That’s market timing and I don’t know anybody that got rich practicing what in modern times is called day-trading.
I know plenty of both rich people that trade and poor people that trade, but the rich ones didn’t get rich that way. Some of the poor ones did get so that way, having formerly been rich.
Bull Case
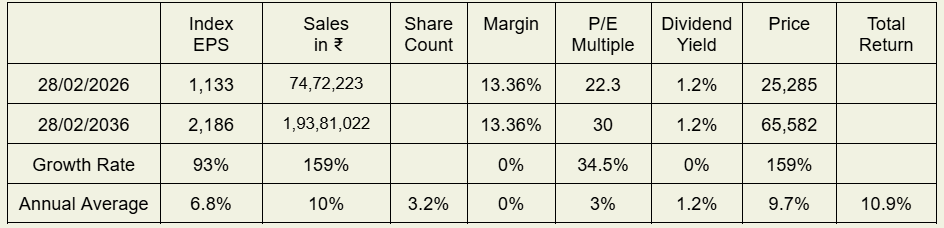
A Bullish scenario would likely be profit margins holding at an all time high of 13.36%.
Revenue keeps growing at a high rate of close to 10%. With business performing in such a way, a higher valuation multiple of close to 30 is much more likely.
Even in such a rosy and bullish scenario, returns seem to be lower than investors expectation of 12-15% annually.
Base Case
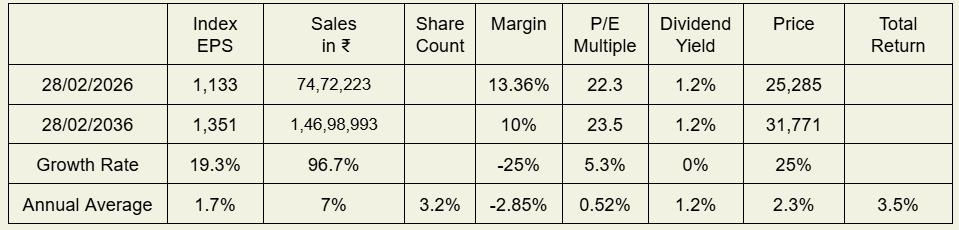
With inflation settling down, sales are likely to grow at a lower rate, closer to the rate of GDP growth rather than close to double digit numbers. Margins declining from what seems like a secular peak to close to 10%, which is still a figure considered very high by historical standards.
A valuation multiple close to the long-term median is a good marker to set the base case.
Even in such a scenario we can likely expect much more sober returns.
Bear Case
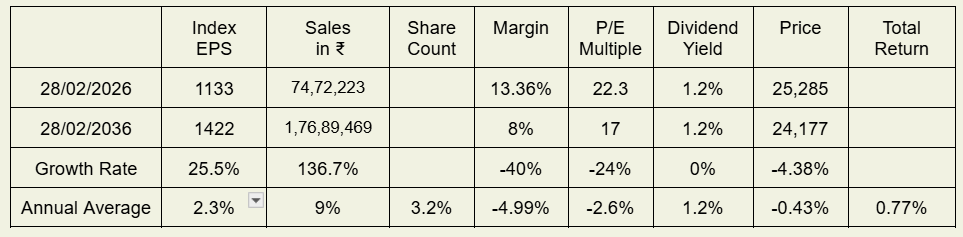
Contemplate a more bearish scenario, higher Inflation returns due to global conflict.
Higher Inflation will likely lead to higher sales but lower profit margins.
The years 2021 to 2025 did see more rapid sales growth, courtesy of snap back from a revenue hit in 2020 but also due to high inflation, where higher cost of goods sold and labor expense were passed through to the customer.
P/E Multiples are likely to contract to close to 17 due rising interest rates in a high inflation environment.

If one simply averages these three scenarios, the implied return comes out to roughly 5% annually for the next decade. And with 10 year Govt Bond hovering around 7%, one should really question investing in a broad market index/ mutual fund.
None of this means investors should abandon equities or attempt to time the market. But it may be worth reconsidering the assumptions behind the effortless 12–15% return expectations that have quietly become the default.
The five-factor return decomposition framework used in this analysis was first introduced by Chris Bloomstran in the Semper Augustus Investments Group annual letter. If this framework resonated with you, the letters are worth every hour you spend reading them.