There is no credible backtest of Joel Greenblatt’s Magic Formula on the Indian Market and I would be more than happy to perform this exercise and share the results on this forum unfortunately I do not have access to historic dataset containing of PE and RoCEs for the listed entities (Ace Equity access is limited to my college’s wifi network which cant be accessed {am a student of MDI Gurgaon and came to know of this forum when Abhishek Bassumalick sir came to give a guest lecture in Prof Bakshi’s class})
If anyone has that dataset and can share it, it would be really helpful in understanding how this strategy performs in the Indian markets.
Not really, S&P 500 is up approx 75% compared to his 109%. But what’s strange is his magic formula average 20% cagr for a 21 year period from 1988-2009 whereas the S&P 500 gave a cagr of 9.5%. Outperformance at this scale is definitely worth looking into in more detail
Thanks a lot, Ahmed. Coincidentally I just started with the same but screener magic formula screen is not properly implemented as it requires a combination of 2 screens and then rank and categorize into groups.
Do you’ve the latest data-set available with you?
Either the latest raw data-set with RoCE and EY or the ranked set itself. Either of that is fine. Please let me know if I can be of assistance.
In the past, results were not declared till May end. If I had considered May end in backtesting the data, it would have resulted in look-ahead bias. Also, this year the results deadline was till June end. Now, extended to July end. I guess from the next year, it will be appropriate to use May end as the baseline date.
Agreed, but try it for recent years where the magic formula did not perform in the recent past. (2016 to 2020). During these years, results were published by May. Also, use the data available ONLY from the results and not the financial statements. By May 31, very few companies publish their annual report (and hence financial statements).
Thanks for doing this. This is very interesting. I’ve been an avid reader of Joel Greenblatt and his work (including recent underperformance). If possible could you please answer these two questions I have:
Can you please share the source of the data as well as the precise stock picks for your implementation in each of the 18 years? This makes it easy for the rest of the community to verify the correctness of the implementation.
In the post you talk about top 750 companies being the universe. Do you reset this every year? So is it the top 750 companies in 2002 being the universe for the strategy in 2002? I hope that is the case and we do not consider the top 750 companies as of today as the universe in 2002 since that would result in survivorship bias.
Cheers Ahmed! Another interesting thing that can be studied is combining magic formula and coffee can.
Yes, Greenblatt didn’t find any difference caused by additional factors. But in Indian market, it might be interesting to study.
10% sales growth yoy every year + usual ranking per magic formula. IIRC, magic formula will lead to lots of cyclicals finding a mention which by its very nature is difficult to avoid. And in current scenario, we don’t know when things will turn for these cyclicals. You’ve covered it in “The Minimum RoCE benchmark portfolio”. But what is the methodology you adopted to take care of the same?
Also, did you implement Ashish’s suggestion of looking at year end financial results instead of AY? Does that change the portfolio?
To deal with cyclical companies, I have included the companies in the universe if their last 7 years median RoCE is more than 15%. Let’s say we are applying the methodology in FY08, we will include the companies in the universe if their median RoCE is more than 15% between 2002 to 2008.
I will update on Ashish’s suggestion hopefully by Monday.
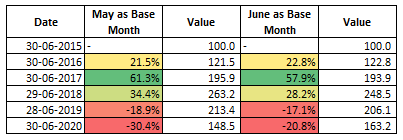
I tried calculating the performance with May-end as my baseline month for churning the portfolio.
There has been hardly any difference in the performance in the last 5 years. The performance in FY20 is worse if we keep May as base month because the markets rallied in June,
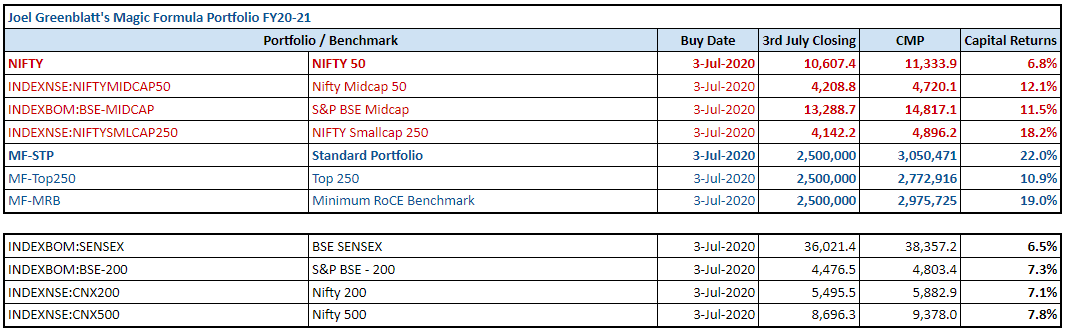
@Ahmed_Madha I read your blog about the magic formula backtest. It looks quite impressive. I am considering to allocate some capital to it just following magic formula. Will see how it goes for the next 5 years.
As for me, i am just using screener.in to filter the stocks.
i have one question. I saw in your blog you mentioned that only Financial stocks were excluded.
How about utilities stock? The book mentions to exclude them as well. Are you excluding utilities stock?
And i didnt understand why the book asks to exclude Utilities stock. any idea about the reason to do this?
Most of the utilities are debt-laden and low-growth PSEs and it could be the reason for excluding them.
But personally I didn’t find any merit in excluding them. So, in my backtest only Lenders and Insurance Cos. are excluded.
I have also allocated some capital to track it. In the last 2 months, the portfolio has done fair in-line with small-cap indices. As the confidence builds up, we can increase the allocation.