CSB BANK - will it become next HDFC Bank?

Is anyone know why they stopped paying Dividends even after having repeated profits from last couple of year?

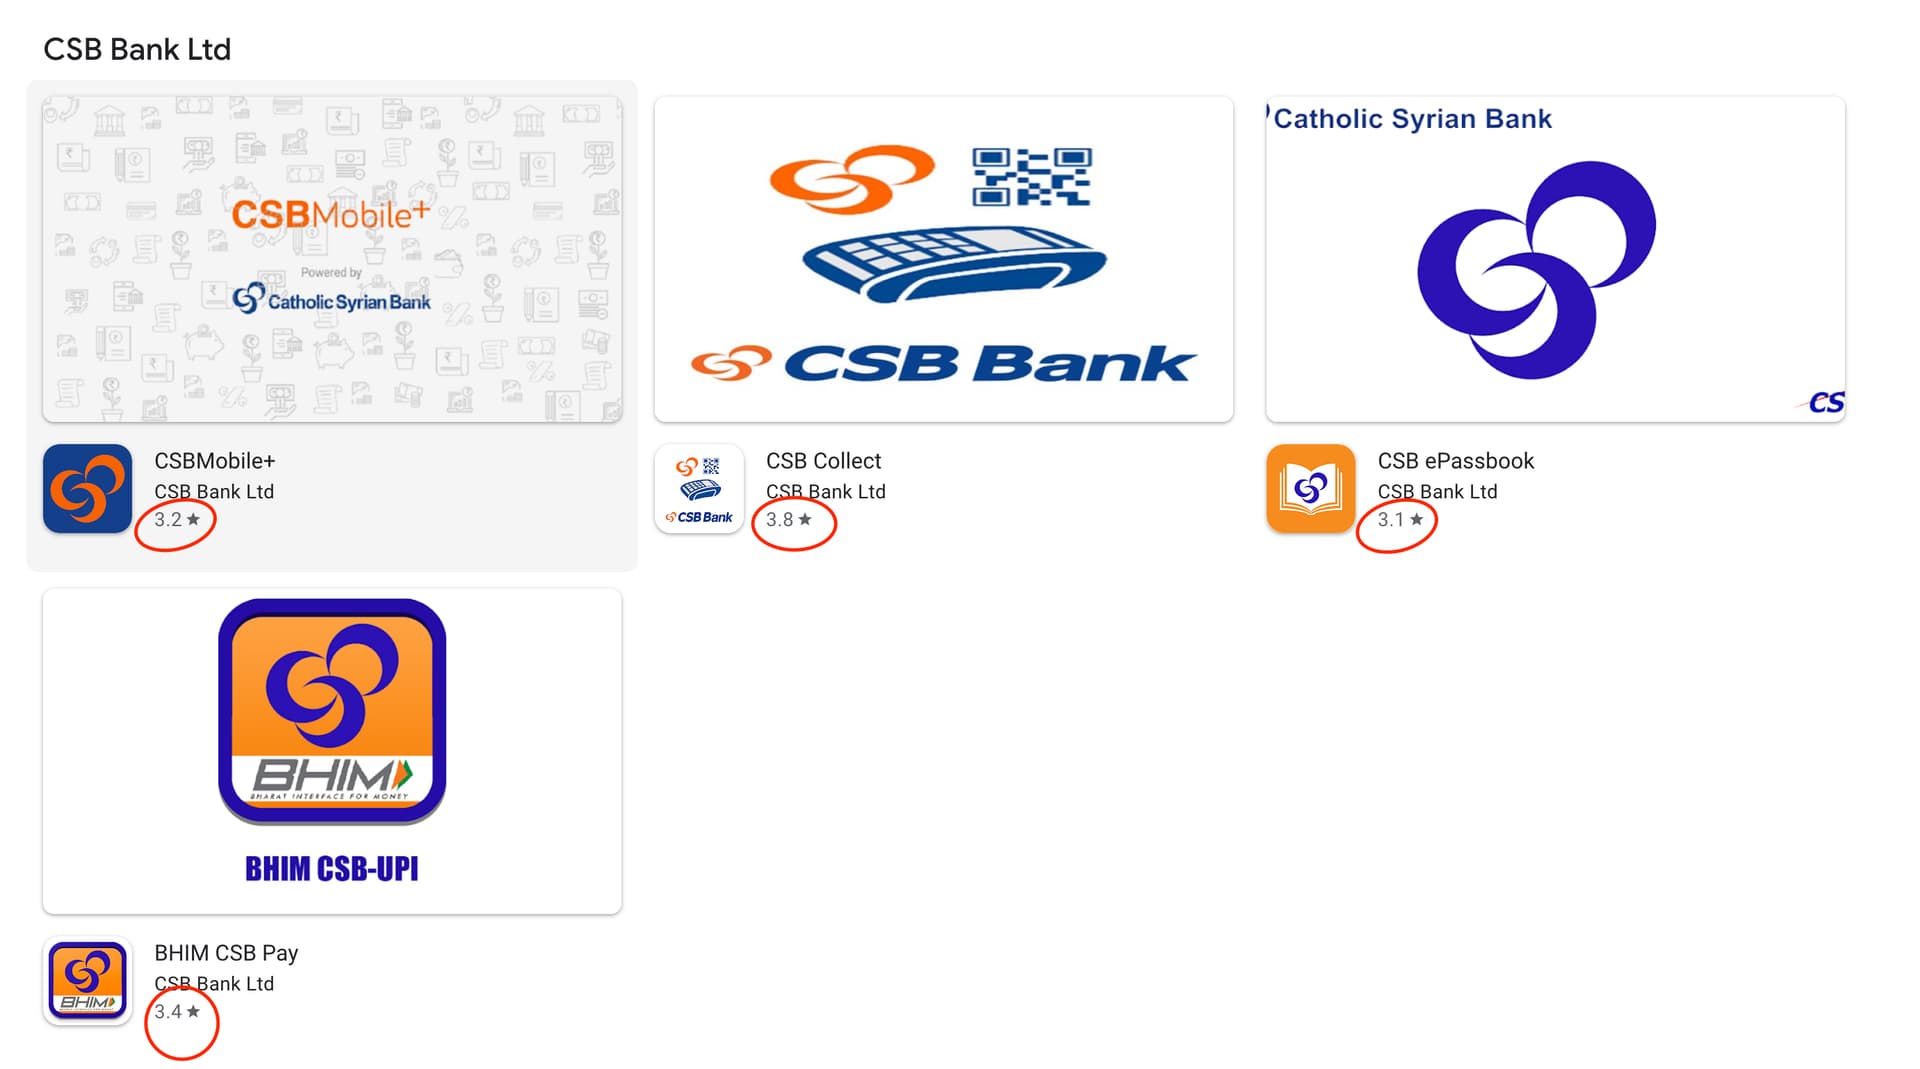
Seems this bank is technological very far behind from the competitors by going through many customers review feedback.

Some can be found below:

Happy Investing,
Karthik
Disclosure: Not having any exposure to this counter. Tacking this Bank with DCB Bank due to good valuations

Private sector lender CSB Bank on Friday reported a 10 per cent rise in net profit at Rs 133 crore in the second quarter ended September 2023 as bad loans declined. The Kerala-based bank had posted a net profit of Rs 121 crore in the year-ago period.

Total income rose to Rs 836 crore from Rs 600 crore in the same period a year ago, CSB Bank said in a regulatory filing. During the quarter, the bank earned interest income of Rs 687 crore as compared to Rs 555 crore in the same period a year ago.

On the asset quality side, the bank witnessed improvement with gross non-performing assets (NPAs) fell to 1.27 per cent of gross advances by the end of September 2023 from 1.65 per cent a year ago. Net NPAs too declined to 0.33 per cent from 0.57 per cent in the same quarter a year ago.

Source:CSB Bank Share Price, CSB Bank Stock Price, CSB Bank Ltd. Stock Price, Share Price, Live BSE/NSE, CSB Bank Ltd. Bids Offers. Buy/Sell CSB Bank Ltd. news & tips, & F&O Quotes, NSE/BSE Forecast News and Live Quotes

Earlier there was a regulatory restriction. However, this should not be an issue now. Had asked the management, waiting for their response

Fairfax is ready for an ā€œall-cashā€ deal to acquire IDBI Bank.

  • I don’t think there is any moat. Banking industry is quite vanilla in nature itself. The point in favor of CSB bank is small market cap and small geographical presence and thus a headroom for growth. Under the leadership of Pranoy Monday(2022-present, he has also roped in new senior management), bank has aspirations of going pan India which should inevitably bring growth at such low market cap.

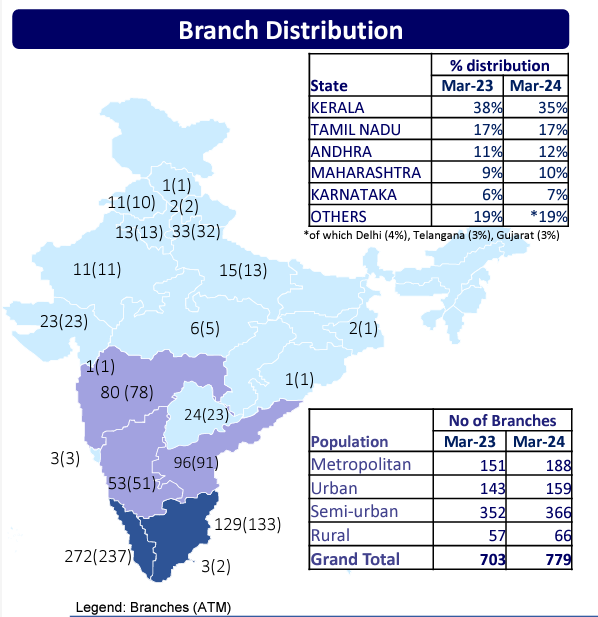
Kerala - 30%
Tamil Nadu - 29%
Maharashtra - 23%
Karnataka - 5%
Others - 14%

Recent partnership with Jupiter (5M playstore downloads) shows intent in the areas of modernization

On the other hand, CSB bank’s own apps look lackluster.

2 Likes

Thanks for the reply!

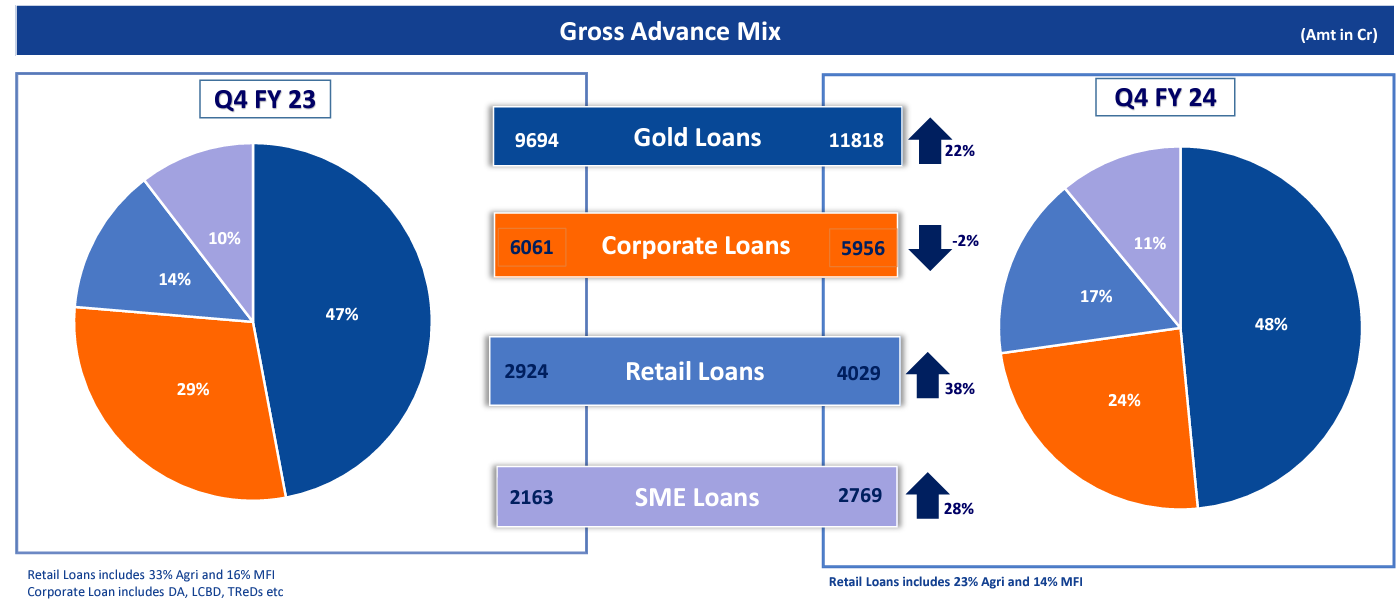
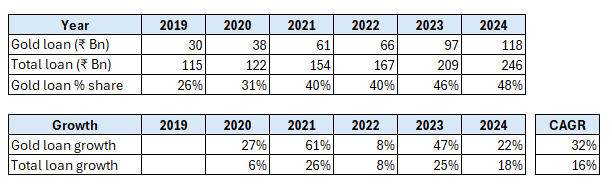
I did some more digging into CSB bank. I think I have identified one clear moat which has also been their growth engine for the last 6 years: gold loans. Since 2019, CSB’s gold loan book has grown 32% CAGR - going from 26% of their loan book to 48% at the end of Q4 2024. They have been able to do this, as they charge only around 9.5%~12% interest for these loans vs. Muthoot / Manappuram (the largest gold loan players) who charge 20%~25% interest. I think they charge less interest because they lend to more safe customers than Muthoot. This can be seen via their NPA ratios: CSB has 0.5% NNPA vs. Muthoot at 3% (meaning 6x more defaults at Muthoot). CSB’s gold loan book at ₹118Bn is 16% of Muthoot, who is at ₹729Bn. CSB’s moat here is low interest rates combined with being a trusted bank with a good branch network in Kerala and TN (seen below) - so people are not wary of trusting CSB to hold their gold safe.

Pralay Mondal (CSB’s MD & CEO) is cautious about gold loan growth. My guess is that the pool of safe customers for gold loans is limited. So, I don’t expect them to ever reach the scale of Muthoot / Manappuram. Mr Mondal also mentions that he expects ā€œwholesaleā€ and SME business to grow faster next year (which can be seen already from Q4 2023 to Q4 2024). Gold loans have a higher NIM and lower net NPA than Wholesale & SME Loans, so these will potentially both be impacted if gold loan share of total loan book reduces. Link to the interview.

However, if they manage to maintain their NIM at 4%~5%, I don’t see a reason for concern. For comparison: HDFC, ICICI and Kotak have NIMs of 3.6%, 4.4% and 5.3% respectively, while Muthoot and Mannapuram have NIMs of 11.6% and 15%. I double whether the latter is sustainable long-term, especially when loan customers get more internet savvy and are able to compare loan interest rates across banks/NBFCs.

In summary, CSB seems to be a promising bank , which will grow at 10%~15%+ in the next few years, as India is still very credit-starved and more people will move up the wealth pyramid from low-income to the aspirational / middle-class.


Gold loans vs. overall loan book:
image

Retail and SME is growing faster than gold loans:

Branches:

Disc: Have decided to start a small position and will monitor this stock in the coming quarters.


Thanks,
Sharad
OpenSourceInvestor @ Substack

6 Likes

Where everyone was panicking about the asset quality CSB Bank stood out for me, as being a small bank, it improved its asset quality this quarter and in my opinion is one of the best among small banks. Though there could be cockroaches that may unearth themselves going forward. Some highlights

Asset Quality:

GNPA & NNPA Ratios: Lower than the September quarter. GNPA was at 1.58%, and NNPA was at 0.64%, compared to 1.68% and 0.69% in Q2 FY25, respectively. This indicates an improvement in asset quality compared to the previous quarter, with a reduction in bad loans.

Provision Coverage Ratio (PCR): Increased to 60.12% without PWO. The bank aims to increase this to 70%. The bank also holds a provisioning buffer of approximately ₹181 crores, above regulatory requirements.

Asset Growth:

Net Advance Growth: Increased by 26% YoY, more than twice the industry growth of 12%. This demonstrates a significant increase in lending activity.
Gold Portfolio: Registered a growth of 36% YoY. This is a strong area of growth for the bank.
Other Retail: Grew by 32% YoY. This demonstrates strong growth in the retail sector.
SME Growth: Increased by 29% YoY. This indicates a stable growth in the SME sector.
Core Corporate Book: Recorded growth of over 30%. This shows the bank is growing its core corporate business.
Overall WSB Growth: Increased by 5% mainly due to the liquidation of the DA portfolio and few exits.

*The bank has added 34 new branches and merged 6 during the year, bringing the total to 807 branches and 777 ATMs

*The bank has been slowing growth in unsecured loans and MFI, which has led to lower NPA ratios

The result were good talk to their conservative lending and good strategy to build a lasting franchise. It is not going to be easy but if they walk the talk then we can have a winner. But as guided by management they will have compressions in margins and profits is not the focus for next 3 years. They are following customer life cycle

1 Like

CSB Bank’s Transformation Journey | Know Your Company

Not so convincing - guys your thoughts ?

CSB Bank posted a strong ~30% loan book growth this quarter, well ahead of peers like IDFC First or DCB which are running at ~20%. That’s a clear positive and shows the franchise is pushing growth aggressively.

That said, the quality of earnings looks a bit mixed. Provisions have shot up ~3x, which is concerning, and PAT growth was muted at just ~4%. Most of the bottom-line support this quarter has come from other income, while core profitability was weighed down by higher credit costs.

Earnings Print :-

The bank is in the middle of a big transformation phase – moving from a Kerala-centric gold-loan heavy book to a more diversified, pan-India franchise. This means higher opex and branch expansion in the near term, similar to where IDFC was about three years ago.

On the positives, the gold loan book has delivered very strong growth, which remains the key trigger here. Likely the reason why some AIFs have started building positions in the stock.

Overall, the quarter feels ā€œokay-ishā€ – good loan growth, strong gold traction, but profits dampened by higher provisions. It’s a transition story, and the real compounding will depend on how quickly CSB can stabilize asset quality and scale beyond its gold-loan comfort zone.

Tech Transformation: Migrated to new CBS (Flexcube) + 50+ systems live → foundation for scaling.

CSB : RoA guidance is 1.5% as Q1 is weak and till Q4 they are going to achieve this RoA

1 more Rate cut is important for them.

EBLR + T-Bill linked loans: ~17% of loan book.

MCLR-linked loans: ~20%.

Fixed-rate loans: ~60%.

In banking during rate cut times - u have to see the fixed rate pf.

Most of CSB’s book is fixed-rate (stable yields ). So if RBI cuts rates, only 17% + 20% (~37%) of book will reprice lower immediately, while fixed 60% protects earnings .

4 Likes

Why does one need to give gold loans to safe customers? A yield of 15 perc+ would indeed be better then 11 perc as gold loans are very safe in nature. Gold is very very rarely going to have a 25 perc drawdown.

1 Like

CSB is on right track. It cheap valuation may be due to overhang of merger with idbi bank.

2 Likes

Looks like in October we will have some updates.

Q2 business update
25% deposit growth
29% Advance growth (47% gold loan portfolio)

2 Likes

Q2FY26 coming on 5th Novemeber… Waiting to see…Does topline increase move to bottomline?

1 Like

Super result this time…income and profit on super rise with bad loans under control. NIM and ROA also started to improve. Hope CASA will also gradually increase over years.

1 Like

Worth watching this video.

2 Likes

Investment Note:

CSB Bank: Regional bank becoming Mid-sized bank at 1xFY28?

By Mann Ashar

Brief Business Overview

Turnaround Journey (2008–2025): CSB Bank’s evolution from a struggling regional lender to a growing mid-sized bank is marked by a turnaround over the past decade and a half. In the late 2000s and early 2010s, CSB (formerly Catholic Syrian Bank) operated as a conservative small bank with modest profitability. Returns on assets were minimal (average ROA around 0.17% during FY10–FY14) as high operating costs consumed most of its income. Profitability briefly turned positive in FY11–FY14 but at very low levels. However, from FY14 an asset quality crisis hit: loan delinquencies surged, especially in SME and corporate portfolios, driving gross NPA ratios to elevated levels and pushing CSB into losses by FY15–FY19. The turning point came in 2016–2018. A new leadership team under CEO Mr. C.V.R. Rajendran was appointed in December 2016 to overhaul strategy. Subsequent strategic investments by Fairfax (through FIH Mauritius) in 2018–2019 injected much-needed capital. This capital infusion enabled a thorough balance sheet cleanup – legacy bad loans were written off or provided for and shored up capital adequacy for growth. By FY19, NPAs had begun to decline from their FY18 peak (GNPA had been as high as ~7.9% in FY18), and losses were stemmed. In late 2019, CSB Bank completed its IPO and stock exchange listing, fulfilling RBI’s directive tied to Fairfax’s stake.

Strategic Investments & Leadership Changes: The Fairfax investment was pivotal. Fairfax India (FIH) received RBI approval in 2018 to acquire a controlling 51% stake, ultimately becoming promoter with a 40% holding post IPO. With Fairfax’s backing, CSB augmented its board and management, bringing in seasoned professionals to drive transformation. Mr. Rajendran’s tenure (2016–2022) focused on cleaning up the loan book and improving risk controls. Under his leadership, CSB deliberately curtailed large corporate lending and emphasized secured retail and gold loans to contain new slippages.

By FY20, the bank returned to profitability after years of losses. In 2020, CSB hired Mr. Pralay Mondal (ex-Axis/Yes Bank) as President of Retail, SME, Operations & IT, who later became Deputy MD in early 2022 and took over as MD & CEO in September 2022 (who launched SBS 2030). Mr. Mondal is credited with accelerating the next phase of transformation, launching the ā€œSustain, Build, and Scale 2030ā€ (SBS 2030) strategy and modernizing the bank’s tech platforms. With 30 years in larger private banks, he brought expertise in scaling retail and digital businesses. Under the new leadership, CSB embarked on a focused growth strategy balancing risk and return.

Shift Toward Profitability and ROA Improvement: The results of these efforts are evident in financial performance. After posting negative ROA through the mid-2010s (average ROA 0.6% in FY15–FY19 during the NPA crisis), CSB’s profitability sharply rebounded. By FY21, despite pandemic provisions, ROA crossed 1.0%. FY22 saw ROA soar to 1.9% as credit costs dropped and operating profits improved. Even as the bank invested in expansion, it sustained an ROA of 1.7% in FY24. Management explicitly targets a sustainable ROA in the 1.5–1.8% range over the SBS 2030 journey. Key to this improvement has been enhancing the risk-return mix. CSB shifted heavily into secured, high-yield assets (notably gold loans), which bolstered net interest margins while keeping credit costs low. Simultaneously, the bank avoided risky large exposures and built up provision buffers. By FY23–FY25, ROA stabilized around 1.4–2.0%, and management expects it to settle above 1.5% as transformation benefits fully kick in.

Key Profit Drivers and Business Mix: Historically, CSB’s profits were driven almost entirely by its niche in gold loans, whereas other segments lagged or made losses. Gold loans (secured by jewelry) offer high yields (11–12%) and very low loss rates, making them extremely profitable. Over 2008–2018, as SME and corporate loans faltered, CSB doubled down on gold lending, raising gold loans from 26% of the loan book in FY14 to nearly half (47%) by FY18. This ā€œgold-centricā€ strategy propped up interest income and buffered against credit losses, but left the bank undiversified.

Post-2019, the strategy shifted toward multi-product diversification. The goal of SBS 2030 is to transform CSB from a single-product (gold) bank to a diversified lender with multiple engines of growth. Key profit drivers now include:

  1. High-Yield Loan Portfolio: CSB maintains one of the highest loan yields in the industry (10.7–11.2% in recent quarters) thanks to its mix of gold loans and other retail/SME loans. This supports a strong NIM (net interest margin) of 3.5–4% even as funding costs have risen. The robust NII generation forms the core of profitability.

  2. Fee and Other Income Growth: The bank has significantly ramped up fee-based income, which constituted 19% of total income in Q3 FY25, up from low single-digits a few years ago. New fee streams such as bancassurance commissions, loan processing fees, cross-selling of insurance/wealth products, and trade finance fees are contributing to profits. The rising share of non-interest income directly boosts ROA.

  3. Benign Credit Costs: A predominantly secured loan book (93% of loans are secured or government-guaranteed) keeps credit losses minimal. CSB’s credit costs have been under 0.5% in recent years, much lower than industry average, which preserves a larger portion of operating profit as net profit.

  4. Capital Adequacy (Low Leverage): CSB’s capital ratios are among the best in class (Tier-1 19%, CAR 21%). The bank currently operates at lower leverage than peers, slightly diluting ROE but providing a cushion to grow assets faster without needing immediate capital. As it judiciously increases leverage, net interest income and ROE can further expand without a proportional rise in risk.

Importantly, these profit drivers are being achieved while outpacing system loan growth. The Indian banking sector’s credit growth has been in the 10–15% YoY range, but CSB has consistently grown its advances 1.5 – 2x the industry rate. For instance, in Q2 FY25 CSB’s advances grew 20% YoY vs 14% for the industry, and in Q1 FY26 its loan growth was 31% vs 10% for the industry.

Segment-Wise Transformation: CSB’s turnaround has also been characterized by a thorough transformation of each loan segment Gold, SME, Corporate (Wholesale), Retail – to build a balanced portfolio. The bank reorganized its business verticals under SBS 2030 to ensure each segment is a meaningful contributor to growth and profits by 2030:

  • Gold Loans From Core to Anchor Product: Gold loans have long been CSB’s bread and butter, traditionally contributing 40–50% of total advances. During the high NPA years, CSB leaned heavily on gold loans (given their reliability) by FY21 gold comprised 40% of the book, and rose to 47% by FY23. Under transformation, gold loans remain a key anchor segment, but the bank intends to moderate the relative share of gold as other segments scale up. Gold loan growth continues to be robust 35% YoY in FY25 aided by strong demand and elevated gold prices. However, as new retail and SME lending accelerates, management expects gold’s share to gradually decline to 25–30% of the loan mix by FY30 (from 47% now).
    Gold loans will keep growing (likely high teens growth) but other segments will grow even faster. Meanwhile, CSB has refined its gold loan strategy to retain competitive edge: expanding gold loan offerings beyond its Kerala base to other states, ensuring average Loan to Value (LTV) remains conservative (the bank’s gold LTV is at a very comfortable level, well below the regulatory cap of 75%), and leveraging technology for quicker gold loan processing. The gold book’s credit quality remains excellent NPAs in gold loans are negligible due to active portfolio monitoring and timely auctions of collateral when needed. This segment will continue to deliver high yield income with minimal credit cost, serving as the ā€œyield engineā€ for CSB while other verticals scale up around it.

  • SME (Small & Medium Enterprises): Cleanup and Relaunch: SME lending was once a major focus (around 35–40% of loans pre-2014) but turned sour during FY14–FY18 (Under old CEO’s phase), contributing heavily to NPAs. Recognizing this, CSB virtually halted fresh large ticket SME exposures around 2017 and undertook an SME portfolio cleanup during FY22–FY23. Stressed SME accounts were dealt with (through recoveries or write-offs), bringing down the SME share to just 10% of loans by FY23. With improved underwriting standards and new risk guardrails, CSB re-started growing the SME book in FY24. The turnaround is evident SME loan growth rebounded strongly to 33% YoY by 1H FY26. Management has created a dedicated Business Banking Group for established SMEs and an Emerging Enterprise Group for newer small businesses, tailoring credit products to each segment. They focus on secured working capital loans, trade finance, and loans backed by receivables or collateral for SMEs, in order to manage risks. Already, SME is contributing meaningfully again: in Q1 FY26, SME loans grew 31% YoY. The bank’s roadmap sees SME comprising about 20% of the loan portfolio by FY30 (up from 13% now). This will be achieved by targeting high quality, granular SME segments while avoiding concentrated exposures in fragile sectors. The SME revival is a most important part of CSB’s diversification; it converts the bank from being primarily a gold lender into a broader commercial bank serving MSMEs, which should drive fee income (from trade and FX services) and build client relationships for cross-selling.

  • Wholesale/Corporate Restructuring for Quality Growth: The wholesale banking segment (loans to larger corporates and institutions) also underwent significant restructuring. Prior to 2019, CSB had some large corporate loans which contributed to volatility and credit losses. Learning from this, the bank deliberately de-risked the corporate book around FY20, even avoiding some big corporate opportunities to focus on safer assets. Under SBS 2030, the corporate business was reorganized and strengthened in FY24–FY25. CSB brought in experienced corporate bankers and set strict concentration limits. The corporate loan book was pruned and rebalanced toward well-rated corporates, PSUs, and secured project lending. By FY25, the corporate/wholesale loan share had been reduced to 23% of total loans (down from 30% a few years prior).
    Now, with a cleaned-up base, growth has resumed: corporate loans grew 32% YoY in Q1 FY26, indicating healthy pickup post-restructuring. The focus is on mid corporates and select large corporates with whom CSB can also do transaction banking (cash management, trade finance, forex) to earn fee income. The bank emphasizes working capital financing, supply chain finance, and other short tenor facilities rather than long-term project loans, aligning with its risk appetite. This segment is expected to become a major growth engine going forward management guides for the wholesale/corporate segment to roughly double its share by FY30 (target ~30% of loan book). Crucially, these loans are being built with lower credit risk many are backed by collateral or guarantees. The transformation of wholesale banking is already paying off in asset quality: despite rapid growth recently, the corporate book’s incremental slippages have been minimal as underwriting standards have tightened (reflected in overall slippages moderating by 2Q FY26).

  • Retail (Non-Gold Personal/Consumer Loans) Building a New Pillar: The retail segment (excluding gold loans) historically was a very small portion of CSB’s business (single digit share pre 2018). Under the new strategy, retail loans including personal loans, two-wheeler loans, housing loans, education loans, etc. are being scaled up as a fresh pillar of growth. The bank hired leadership for retail products and invested in digital capabilities to launch competitive offerings. Over FY24–FY25, CSB began rolling out a full suite of retail products (many for the first time in its history). Notably, the bank launched vehicle loans, LAP (Loan Against Property), small business loans, and credit cards in select markets. During FY24–1H FY25, retail loan growth showed ā€œencouraging tractionā€ the book grew 19% YoY as of Q1 FY26. However, growth was intentionally moderate because CSB simultaneously tightened underwriting on some higher-risk retail sub-segments (microfinance, unsecured personal loans, etc.) due to macro caution.

Execution Roadmap and Scale-Up Mechanisms: To achieve this transformation, CSB laid out a clear execution roadmap under SBS 2030. The strategy is unfolding in phases:

  • Phase 1 (2016–2019): Stabilization and Cleanup. The new management first focused on fixing the basics, cleansing the balance sheet of legacy NPAs, improving risk controls, and raising capital. Cost rationalization was also undertaken (e.g. branch rationalization in some areas, improving cost discipline) to bring down the ultra-high cost-to-income ratio. By 2019, this phase was largely complete, evidenced by declining NPAs and a return to profitability.

  • Phase 2 (2020–2022): Foundation Building and Early Growth. Post listing, CSB started carefully growing again, primarily in its strength areas (gold and secured loans) to rebuild confidence. During these years, the bank avoided heavy-risk lending (e.g., it ā€œdeliberately avoided large corporate loansā€ in FY20 and focused instead on gold and retail). Nonetheless, growth picked up loans expanded 15% YoY in FY18–FY19 as asset quality improved and new capital was deployed.

The SBS 2030 initiative was formally launched in March 2022, marking the shift into full transformation mode. This included heavy investments in technology (initiating a core banking upgrade and digital projects) and the hiring of key personnel for new business verticals.

  • Phase 3 (2022–2025): Transformation Execution. This current phase involves rolling out new products, expanding geographically, and scaling up multiple engines. The bank undertook intensive restructuring of portfolios: SME and corporate segments were overhauled in FY22–FY25 as discussed, and a retail reorganization is underway. Digital transformation was a centerpiece in FY25, CSB successfully migrated to a modern Core Banking System (Oracle Flexcube) and implemented over 60 surrounding systems in one of the most comprehensive tech overhauls seen, ā€œa massive transformationā€ that partners remarked was unlike anything they had seen with so many systems going live together. This technology reboot (completed by mid-2025) has effectively created a scalable platform for the future. Alongside, branch expansion accelerated (opening 80+ branches in the last year alone) to extend reach beyond legacy markets.

By FY25, CSB had 834 branches (up from 400 branches a decade ago) and a presence spreading across India. The execution roadmap also focused on strengthening the liability side (initiating efforts to improve the deposit franchise – more on this later in Liability Franchise). Throughout this phase, profitability was maintained (ROA 1.5–2%) even as costs rose, indicating execution was on track without derailing the P&L.

  • Phase 4 (FY26–FY30): Scale-Up and Sustain. This forthcoming phase (imminent from FY27 onward) is where CSB expects to reap the benefits of the groundwork laid. Management projects that from FY27/FY28, the bank’s journey toward scale will accelerate, driving sustained improvements in cost metrics. Essentially, by FY27 the heavy investment phase will taper, and business volumes will start catching up with the expanded infrastructure. CSB will then focus on scaling each business line rapidly while holding costs relatively steady improving operating leverage. The SBS 2030 plan targets CSB to become a pan-India, full-service mid-sized bank by 2030. This means likely doubling or tripling its balance sheet from current levels, achieving a balanced loan mix, and firmly sustaining ROA >1.5%. The execution mechanisms for this scale-up include continued branch network growth (but at a calibrated 50–60 branches per year), digital customer acquisition (leveraging the new tech stack), cross-selling multiple products to existing customers, and entering new markets selectively (e.g., northern and western India for corporate and retail loans). Having completed top-level hiring and major systems investments, CSB can scale without proportionate increases in overhead. Indeed, management noted that all key leadership roles and teams are now in place, so the focus is shifting to productivity and business growth rather than organization building.

Why consider CSB Bank as an investment?

  • Favorable Macro Environment for Loan Growth: The Indian banking sector is in a period of healthy credit expansion, supported by economic growth of 6%+ and rising credit penetration. System-wide loan growth has averaged in the low to mid-teens in recent years (typically 10–15% YoY) and is expected to sustain in that range given India’s structural credit demand. This is after the fact that economies as a whole are going through the slowdown, In this context, CSB is poised to grow even faster than the industry, thereby capturing market share. The bank’s strategy explicitly targets loan growth at ā€œover double the system growthā€, leveraging its SBS plan. Indeed, CSB has been delivering 20–30% YoY credit growth, far outpacing the 10–12% growth of the banking system.

  • Segment-Level Transformation and Growth Trajectory: Drilling down, each segment’s transformation adds to the investment thesis:

    • SME: Following the clean-up, CSB’s SME segment is now on a strong growth footing (31% YoY in Q1 FY26) with improved portfolio quality. SME lending in India is a high-margin business (yields often 10–12%) with huge unmet demand, given millions of MSMEs need formal credit. A successful scale-up in SME could re-rate the franchise, as investors value strong SME-focused banks (e.g., City Union Bank trades at premium valuations due to its SME niche). CSB’s SME book, now restructured and sub -1 % NPA, is an engine to watch.
    • Wholesale/Corporate: CSB’s foray back into corporate lending is carefully calibrated targeting safer credits and transaction banking opportunities. This segment’s growth (32% YoY) post-restructuring. As CSB wins corporate clients, it often gains their operating accounts and fee business, boosting low-cost deposits and non-interest income.
    • Retail: The expansion of the retail loan book is a long term value creator. Retail loans typically have the highest risk adjusted spreads and are granular, reducing concentration risk. CSB’s push into areas like vehicle loans, personal loans (selectively), and mortgages will gradually increase its market presence among individual consumers. This also feeds the liability side (many retail borrowers become deposit customers). Over time, a growing retail franchise could substantially lift CSB’s valuation, as banks with strong retail assets (like HDFC Bank, Kotak) command premium multiples due to stable revenues and sticky customer relationships. While CSB’s retail is currently a smaller piece, it is growing and expected to be 20% of loans by FY30. The bank’s strategic hiring (Mr. Mondal’s expertise in retail from HDFC/Axis, plus other retail heads) and technology investments are tailored to capturing this segment. This lends confidence that CSB can execute in retail, not just in its traditional gold product but more broadly.
    • Gold: Far from being a sunset segment, gold loans continue to be a reliable growth and profit driver for CSB. The Indian gold loan market itself is growing steadily (gold prices in INR have trended up and people increasingly monetize gold for short-term credit needs). CSB’s heritage and competitive rates allow it to maintain leadership in this segment even as it diversifies. Gold loans deliver a ROA often above the bank’s average (high yield, negligible loss), effectively subsidizing expansion into other products. As an investor, one can view CSB’s gold franchise as providing a floor to earnings even in tougher times, the gold book churns out solid interest income and fees (gold loan processing fees, etc.). The bank’s strategy to moderately reduce gold’s share is not because gold is unattractive, but to ensure it doesn’t overly dominate so that the bank is not one-dimensional. But in absolute terms, gold loans are expected to keep growing in tandem with branch expansion (CSB often opens new branches in markets known for high gold loan demand).
  • Liability Franchise Improvement and Bulk Deposit Reduction: A critical part of CSB’s investment thesis is the ongoing transformation of its liability franchise, which historically was a weak spot. The bank had a low CASA ratio (just 21% in FY25) and a high reliance on term deposits and bulk deposits. This meant higher cost of funds and vulnerability to liquidity conditions. However, management is acutely aware of this and has initiatives to address it:

    • The CASA strategy involves leveraging new branch openings in metro/urban areas to garner more retail savings accounts, launching attractive digital savings products, and targeting government/business accounts for current accounts. For example, CSB has been focusing on payroll accounts for employees of its corporate/SME clients and deepening relationships with the Catholic community institutions (which historically banked with CSB) for CASA. In the past year, CASA grew 13% YoY, and the CASA ratio inched up to 23.5% by Q1 FY26. While still below industry average (40%), it’s moving in the right direction. Management expects CASA to improve gradually as the network expands and as new products (like a revamped mobile app, UPI, etc.) attract younger customers.

    • Reducing Bulk Deposits: CSB has been weaning off very large one off deposits. In FY23 when system liquidity was tight, CSB had raised substantial bulk deposits and borrowings to fund loan growth and maintain high liquidity buffers, which impacted its margins. These ā€œOther liabilitiesā€ (including borrowings like refinance from RBI or inter-bank CDs) went up to 10% of funding by early FY26, from just 3% in FY23. The bank is now paring this down as system liquidity improves. During Q1 FY26, for instance, borrowings reduced slightly as a percent of funding. The CFO explained that while they had carried excess liquidity as a precaution, they can now deploy that liquidity into loans and normalize funding mix.

Over the next few quarters, one can expect CSB to replace some high-cost bulk deposits with stickier retail deposits. Already, deposit growth (20% YoY) is outpacing loan growth slightly, which helps build a buffer. Additionally, the new branches are helping mobilize fresh deposits (80 new branches can conservatively bring ₹800–1000 crore in deposits in a year, which is meaningful).

  • Branch and Geographic Expansion for Deposits: CSB’s expansion beyond Kerala is not only for loans but also to tap into richer deposit markets. For example, Maharashtra and Delhi have high deposit potential the bank’s presence in these regions (11% of branches in Maharashtra, some in NCR) enables access to a broader depositor base than the relatively saturated Kerala market. The diversification means CSB can target a mix of deposits across regions – building a granular retail deposit base. Already, the share of deposits from outside Kerala has risen substantially (Kerala now only 40% of deposits vs 65% five years ago). This is a positive trend, as it reduces over-reliance on a single region’s surplus.

  • All these efforts contribute to strengthening the liability side. While admittedly, CSB’s CASA and cost of funds are currently weaker than some peers, the trajectory is upward. The bank acknowledges it had ā€œone of the weakest CASA franchises among peersā€ and is acting on it. For investors, the key point is that improvement here directly boosts NIM and profitability (even a 5 percentage-point increase in CASA ratio can save tens of crores in interest expense).

There is substantial upside potential if CSB can lift CASA from 23% towards 30% over the next couple of years which is plausible with aggressive branch banking and marketing. Furthermore, reducing bulk deposits will also cut volatility in cost of funds and reduce ALM mismatches (bulk deposits are often short-term). CSB’s management has shown prudence by not chasing ā€œhot moneyā€ beyond a point they maintained high liquidity when needed (CRR, LCR all comfortable), but they also recognize the need to trim that excess as conditions normalize. This balanced approach ensures the bank isn’t caught in a liquidity crunch, yet also optimizes funding costs gradually.

The investment rationale for CSB Bank can be summed up as follows:

CSB is a transformed growth story at an early stage of recognition, offering a unique combination of industry leading growth (Almost 2-2.5x of industry growth), improving asset quality, high return ratios, and a clear long-term vision (SBS 2030), all underpinned by conservative risk management and strong capitalization. The macro environment supports its growth, and its strategic initiatives (diversification, technology, expansion) are positioning it for sustained success. CSB stands out as one of the best-positioned banks in terms of risk-reward, with a transformation plan that if executed as planned, should ā€œcement CSB’s evolution into a high-return, pan India mid-sized institutionā€.

NIM Expansion Outlook

One of the critical components of CSB Bank’s financial performance is its Net Interest Margin (NIM). CSB has historically enjoyed healthy NIMs (thanks to high-yield loans like gold), and the outlook ahead is for a gradual expansion in NIM from current levels, driven by an improving liability mix, the turn in interest rate cycle, and operating leverage benefits. We analyze the factors affecting NIM:

Liability Mix and Impact on NIM: CSB’s funding mix the proportion of low cost CASA vs higher cost term deposits and borrowings directly influences its NIM. As discussed, CSB’s CASA ratio (23–24% presently) is lower than ideal, meaning a greater share of its funding comes from interest-bearing term deposits. This structure caused CSB’s cost of funds to rise sharply during the recent rate tightening cycle (2022–2023). As deposit rates in the market climbed, CSB had to offer higher rates on new fixed deposits to remain competitive, which drove up its cost of funds. Indeed, through FY24, the bank’s cost of deposits increased, putting pressure on margins reported NIM fell from 5.1% in FY22 to 4.1% by Q3 FY25. However, going forward, the liability mix is set to improve in favor of cheaper funds:

  • CASA Growth: CSB is actively trying to lift CASA percentage (through new branches and digital acquisition). Even modest gains here have a magnified effect on NIM. For instance, raising CASA from 24% to 30% over a couple of years would replace a chunk of 7–8% term deposits with 0% savings (or 3–4% interest savings accounts) significantly lowering average cost of funds. Management expects the low cost deposit ratio to rise as the franchise strengthens.
  • Reducing High-Cost Borrowings: As noted, CSB had raised some high-cost borrowings (like Certificates of Deposit or other bank borrowings) when liquidity was tight. These carry higher rates than even term deposits. Now that liquidity is easier, CSB can pare these down (already other liabilities share fell from 13% in Q1 to 10% in Q2 of FY26 as per funding mix). Replacing these with core deposits will cut interest expenses. The CFO’s commentary indicates they are normalizing excess liquidity buffers, meaning less reliance on costly borrowings going forward. This will support NIM.
  • Granular Retail Deposits vs Bulk: The bank is shifting towards more granular retail term deposits (which, while interest-bearing, tend to be somewhat stickier and often slightly lower rate than wholesale bulk deposits). Bulk deposits usually demand the highest rates. By reducing its bulk deposit proportion, CSB can marginally reduce the average cost on term deposits. For example, a ₹5 crore corporate deposit might negotiate 7.5%, whereas many small ₹5 lakh deposits might average 7.0%. Over many deposits, that difference boosts margin. The trend in deposit concentration (top 20 depositors 10%)
  • Maintaining Liquidity vs Deployment: Last year, CSB maintained a lot of surplus liquidity (excess SLR, etc.) which, while safe, earned lower yield than its cost (dragging NIM). As the environment normalizes, the bank can deploy more of that liquidity into loans. The Q&A from investors pointed out that CSB was carrying excess liquidity that could be paid down without hurting its 5% liquidity buffer. Management agreed and is likely to trim excess funds and use them to fund loan growth (which yields >10%) instead of keeping them in cash or low-yield investments. This redeployment will naturally increase asset yield and NIM.

Operating Leverage and Margin: Although operating expenses don’t directly factor into NIM (which is purely interest income minus interest expense, over earning assets), there is an indirect effect on how the bank can manage its asset-liability pricing. As CSB achieves greater operating efficiency (post-FY27, costs growing slower than income), it will have room to be competitive in pricing deposits and loans. For example, if a bank has high costs, it needs higher asset spreads to cover them, which could lead to riskier loans or pushing yields at the cost of growth. CSB’s push toward a lower Cost-to-Income ratio (targeting ~50-55% by FY28 from ~63% now) will give it flexibility to maintain healthy NIM without compromising growth. Additionally, as volumes increase, fixed costs are spread – so the bank doesn’t need to maximize margin per unit to cover overhead; it can focus on profitable growth even at stable NIM.

More concretely, operating leverage will contribute to net profitability (ROA) even if NIM improves only gradually. A key point from management is that once scale kicks in, cost ratios will drop, thereby improving net interest margin in terms of net profit margin (though not the accounting NIM). But even in accounting terms, some operating efficiency initiatives can feed back into NIM: for example, using technology to automate processes can allow the bank to close high-cost branches or avoid opening too many costly branches, which might allow them to offer slightly better deposit rates or lower loan rates and still maintain margin net of costs.

Management’s Outlook on NIM: The commentary from management across quarters reinforces that NIM has likely bottomed:

  • In Q3 FY25 call, they proudly noted NIM was sustained above 4% despite tight conditions.
  • In Q1 FY26, NIM was 3.54%, but the CEO said ā€œwe do not expect NIM to go down further from this levelā€.
  • By Q2 FY26, NIM indeed improved approx. 3.8%. Management indicated yields might see some pressure in wholesale and MCLR resets, but overall yield compression will be limited, and cost of funds reduction will help offset it.
  • The bank gave a full-year guidance of 3.7–3.9% NIM for FY26.

Journey to Scale

A crucial aspect of CSB Bank’s strategic plan is the journey towards scale essentially, reaching a size where economies of scale materially improve cost efficiency and profitability. The bank is currently investing heavily (in technology, branches, people) under the SBS 2030 strategy, which has temporarily elevated its cost structure. However, these investments are largely ā€œbaked-inā€ costs that lay the groundwork for future growth. Starting around FY27, CSB expects to hit an inflection point where the incremental revenue from its expanded franchise outpaces incremental costs, leading to a sustained downtrend in the cost-to-income ratio and an uptrend in profit margins. Let’s break down this journey to scale:

SBS 2030 Investments (FY22–FY27): In the period from launch of SBS 2030 (Mar 2022) up to FY27, CSB is making significant upfront investments:

  • Technology: The bank has spent substantially on its IT transformation purchasing a new core banking system, implementing various digital platforms (mobile banking, CRM, analytics, etc.), and strengthening cybersecurity and IT infrastructure. These are largely one-time or upfront costs (capital expenditures and some operating expenses for implementation). As an example, FY25 saw a spike in tech-related opex due to parallel runs of old and new systems, training, consulting fees, etc. Now that major tech upgrades are completed in FY26, the ongoing tech cost will mostly be maintenance (which is relatively lower) while the heavy capex won’t recur frequently. This means beyond FY26, tech investment costs will taper off, yet the benefits (in terms of capacity and efficiency) will kick in.

  • Branch Expansion: CSB has been aggressively opening new branches adding 80+ branches in FY24 and planning similar additions in FY25 and FY26. Each new branch entails upfront costs: rental, fit-out, staffing, etc., and typically takes 12-18 months to breakeven. The bank has front loaded branch openings as part of SBS 2030, aiming to build presence now. By FY27, the network size would be much larger (they crossed 800 branches in 2024 and could be near 1,000 by 2027 at the current pace). Importantly, management has indicated branch expansion will moderate thereafter – they plan to grow branches at a steady 50–60 per year going forward, rather than a steep ramp. This suggests that the bulge of new branch cost will ebb; branches opened up to FY26 will start maturing (contributing revenue) by FY27–FY28, while incremental new branches will be fewer relative to base. Thus, branch investment cost is peaking around FY25–FY26.

All these expenditures mean that currently CSB’s Cost to Income (CTI) ratio is elevated around 62-63% in FY25. This is higher than many peers (some older private banks operate at 50-55% CTI). However, this is understood as an investment phase phenomenon.

Scale-Up Kicks In (FY27 onwards): The expectation is that from FY27, but especially FY28 onwards, CSB will begin reaping scale benefits. Several dynamics will drive this:

  • Revenue Growth Outpacing Cost Growth: Once the heavy investment period is over, costs will increase more in line with inflation or branch additions, whereas revenues (from the built out franchise) can grow faster (via loan growth, fee growth). Already, we see revenue growing at 20%+ p.a. (interest income + fees) while opex growth was higher during the investment phase. Post FY27, opex growth should moderate (for instance, fewer new branch openings means lower incremental cost addition, and tech expenses might even streamline processes). If revenue continues ~20% and costs perhaps 10-12%, the CTI will drop significantly year by year.
  • Branch Productivity Gains: Branches opened in 2022-2025 will reach maturity by 2027-2028. A new branch often starts with ₹0 business and by year 3 might have a few hundred crores in deposits/loans. As those branches mature, their income (through interest and fees) ramps up, but their fixed costs remain roughly the same (rent, a fixed staff). This directly improves cost-to-income for each branch and for the bank as a whole. By FY28, CSB will have a large cohort of relatively mature branches contributing strongly. Meanwhile, any new branches added will be a smaller proportion of the total network, so their drag on average productivity is less.
  • Operating Leverage through Tech: With the tech transformation done, the bank can scale customers without linearly adding cost. For example, the new core banking can handle many more transactions at marginal incremental cost; digital onboarding means the bank can acquire customers without opening proportionate new branches. CSB’s COO likely expects productivity per employee to rise. In Q1 FY26 they reported improvement, From FY28, this should accelerate. Technology adoption will have a multiplier effect on productivity – meaning each employee or unit can do more business, lowering the cost per unit of business.
  • Scaling of Lower-CTI Segments: Another factor highlighted is that as the wholesale and SME businesses scale, overall cost metrics improve. Why? Because gold loans (currently 47% of book) require high-touch operations: many small transactions, in-person gold handling, etc., which drives up Opex. In contrast, SME and corporate lending often have lower operating costs relative to size (one relationship manager can handle a large portfolio). Currently, gold dominates which inflates cost ratios. By FY28, gold’s share will decline and SME/wholesale’s share increase – these segments inherently have better cost-to-income (e.g., one corporate loan can bring in interest with minimal incremental branch cost). Thus, the business mix shift will naturally lower the blended CTI. In essence, diversification will improve cost efficiency.
  • Completion of Transformation Projects: Many projects (like the CBS overhaul) incurred duplicate or implementation costs that will vanish by FY27. For instance, running old and new systems in parallel, or paying consultants, etc. Once done, those line items drop out of the expense base.

CSB’s CTI (cost-to-income) ratio will start improving from FY27 and meaningfully by FY28. Up to FY26 it might still be somewhat high due to finishing investments. By FY28, they expect cost ratios to approach peers’ range. In data terms: Opex was 62% of deposits in FY24, expected 58-59% by FY27 and 54-55%% by FY28.

Valuations

7 Likes

Rising CD ratio with increasing GNPA is cause of concern for me. CSB is earning more but also losing more and spending more, so nothing reaches the bottom line. Management is confident of sharp positive surprise in GNPA in next quarter. But how much can be believed in management is yet to see?

Disclaimer: Bought at 350 and observing keenly.

Bought again today at 380 rupees in today turmoil of us Iran war. Heard the management and of view that management is honest. Sharp decrease in Gnpa is expected in future. Sometimes people say , you have stories to tell but not the numbers. I always keep saying myself, I will do at what I am best. I don’t need to be overnight rich. I want slow and calmness in my life and want to grow older watching my children growing. May be this is the essence of investing and life.

Can someone help me understand the reason behind correction since the Q4 results. I didn’t see any concern on growth, asset quality or even the valuations. Is it because people are not bullish on gold loan portfolio or unhappy with the opex or did not like the ROA/ROE guidance?