
@gopusuchi Indian steel prices are still 10% below global prices so major impact but export realisation for companies go down.
3 Likes
@Rakesh_Arora Sir what is your view on the current actions by China to curb speculation in steel and iron ore prices. Prices in Europe and US are not correcting while steel prices have corrected 15-20% in China. Can export prices and domestic prices in India remain high even though Chinese prices fall?
3 Likes
@Vaib9619 I think I mentioned above also, since Indian steel prices were already at discount to global prices by 20% or so, hence the current fall hasn’t really impacted Indian steel prices. Same for iron ore. However since lots of export was happening out of India both for steel and iron ore pellets, so to that extent, realisation for companies would be lower. But current prices are still way better than Q4 prices. Steel margins will be up Rs4000/t in Q1FY22 as compared to Q4FY21. Iron ore pellets prices are around Rs15000-16000/t as against Rs11500-12000/t in Q4FY21. Results for Q1FY22 will be best ever we have seen till date
15 Likes
One cannot read China strategy…anything can happen, just see how Chemical prices slumped after 2016-17 euphoria on Env concerns in China…
Thank you @Rakesh_Arora that makes sense. So we’re looking at potentially a 80% upside in SAIL.
But Tata Steel in comparison looks like a better risk-reward as per my calculations. But that’s not in line with the last line of the article that says the weakest player may be the better investment in an upcycle. Calculating below, pls let me know if it’s making sense?
Tata Steel: Rs.19,064 x 33mnt x 6 = about 4 lakh crore EV. Present market cap is 1.3 lakh crore and debt about 82000 crores. So we’re looking at a market cap of 3.2 lakhs crore to 4 lakh crore, depending on debt reduction. That’s an upside of 150% to 200%.
1 Like
Hi, excellent article, thanks for sharing.
As I understand from the analysis, the current earnings > future sustainable earnings > historical average earnings. This would allow balance sheets to get better and hence lower EV even if market cap is stretched now.
One basic question on the valuations: With expected tightening of monetary policy globally, won’t the market settle on a lower EV/EBITDA multiple? Idea being that with lower liquidity and costlier capital, investors will not want to pay as much…
Fundamentally, I could not appreciate the idea of taking a constant 6 EV/EBITDA and basing calculations around it. Please provide your views. Thanks
2 Likes
Vineet bhai, you seem to be using Tata Steel global capacity in your calculations. The EBITDA/ton that Rakesh ji has shown in his chart is for the standalone (India) operations. European operations have long been a drag for the company.
To give you a feel of how much the India ops drives profits, just look at the last Q results. India represented 61% of volumes, but 86% of EBITDA for Tata Steel.
Here’s a quick look at what this means.
Consolidated EBITDA for Tata Steel (incl Europe) was INR 14,290 cr in Q4FY21. Rakesh ji has assumed sustainable EBITDA for Tata Steel India at ~68.5% of the Q4FY21 number. Taking a similar discount for the global ops, we get sustainable quarterly EBITDA of INR 9,800 cr = INR 39,200 cr annual. Take the EV/EBITDA multiple of 6 and you have EV = INR 2.35 lac cr. Not the 3.2 to 4 lac cr you had estimated.
Plus the above calculation gives a 6x EBITDA multiple to Europe ops, which is rich. I would personally use a lower multiple. This would bring down the EV further.
6 Likes
@Vaibhav_Temani we are talking sustainable EBITDA which is what company will make on average. Hence the average multiple seen historically. On current peak cycle EBITDA it will trade at lower multiple.
2 Likes
Sir is this China policy of cutting production or pollution curb will not constraint world capacity of aluminium and copper in big way as it will affect steel ??
@DEEPAK_AGARWAL Scale of production is very different, Steel 1bnt, Aluminium 45mnt, and Copper even less. Aluminium their strategy is to move towards hydel power to reduce carbon emissions. Having said this, am bullish on aluminium because there are shortages projected for next 2years and it is the cheapest metal as compared to steel and copper currently and there will be increased substitution demand
4 Likes
But for aluminium and copper also they are only the largest producers or anyone else , and also for copper they have find other non polluting ways to produce and is also copper would be structurally up ??
Thanks for reply
1 Like
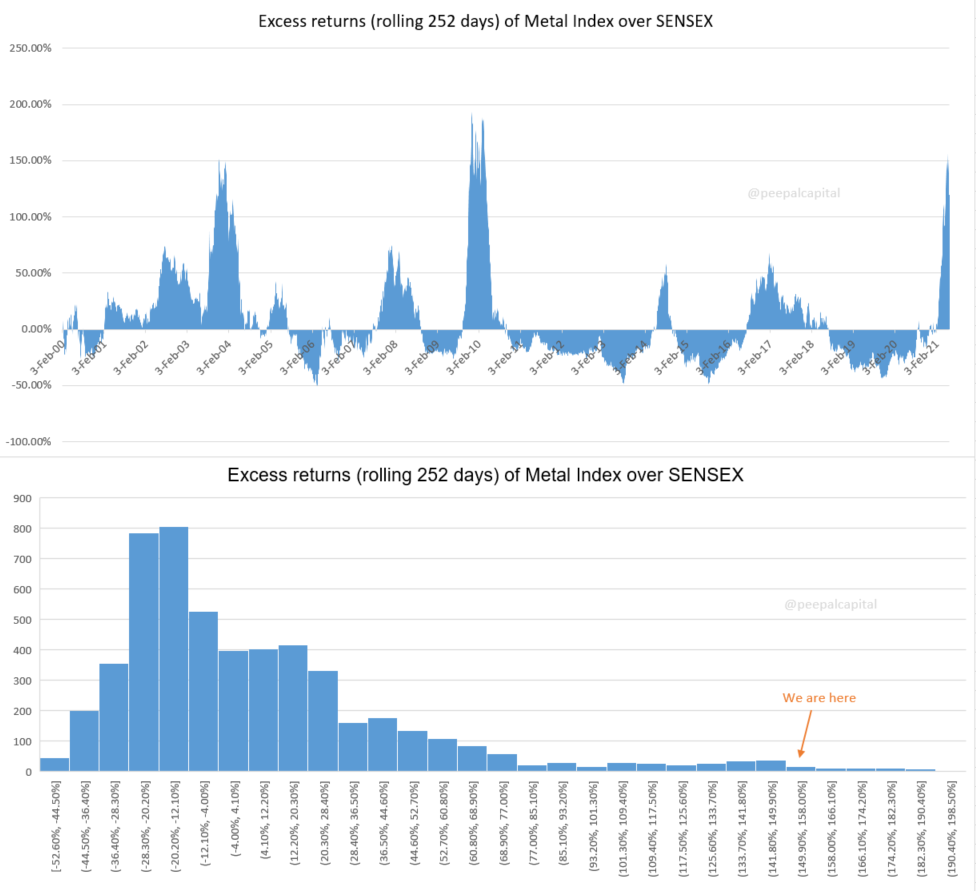
Hi @deevee can you please explain the bottom graph?
@parkhi_nazar thanks for pointing out the flaw in my assumption. Tata Steel then seems fairly valued and a lower risk reward in comparison to SAIL. In fact even before reaching sustainable margins, it is likely that SAIL will have a few more windfall quarters as tey have the highest operating leverage - peak margins are double of sustainable margins.
I guess the story essentially boils down to two points:
- China not retracing/delaying their attempts curb addition of steel capacity, and maybe even reducing it in the future
- Global liquidity surpluses sustaining with continued low interest environments and no major inflation spikes, ensuring generous multiples for steel companies
2 Likes
Commercial Vehicles – From down cycle to upcycle?
Analysis of India’s CV production data for 20-year data indicate existence of steep cyclical trends in the Commercial Vehicle industry.
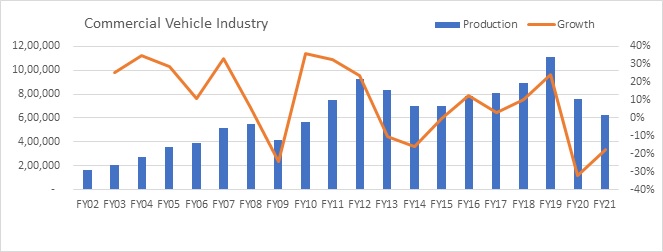
Cyclicity in the industry is driven by fluctuations in economic activities, utilization level of trucks and replacement requirements, which in turn impact freight rates and purchase of new CVs. Current down cycle in the industry has been steepest ever in the last 20 years, which was aggravated by increase in rated payload (resulted in higher effective tonnage), BS VI transmission and finally COVID epidemic. Volume decline in FY20 was 32% which was followed by another decline of 17% during FY21.
Nevertheless, every down cycle (ranging between 1-3 years) has been followed by even stronger upcycle as requirement of new CVs emerges due to growing trade as well as replacement demand. Going by the historical trend, there is possibility of revival in the CV industry going forward. Possible triggers for the same are expected to be both economic growth and replacement demand.
Potential beneficiaries could be pureplay commercial vehicle OEMs, auto ancillaries supplying to CV OEMs and CV financiers. First sign of revival would be improvement in the freight rates. However, generally stocks tend foresee revival ahead of data indictors.
Views invited
9 Likes
From Reliance sec report
Cement outlook after Analyst interacting with dealers
Key Highlights:
- Demand took a sharp hit in May’21 due to lockdown/restrictions imposed by several states and shortage of labourers. As per our channel check, demand contracted by 40-70% on MoM basis in May’21, demand trend was mixed on YoY comparison. While the Eastern region is likely to have recorded YoY decline in volume due to second COVID wave, other regions witnessed moderate YoY growth owing to low base.
- Infrastructure projects along with real estate construction activities supported volume during the month, as a large number of companies succeeded in holding back labourers this time to the extent of 50-70%. Demand was severely impacted in Eastern region due to spread of virus and extreme rains in the second half of the month.
- However, the pricing scenario remained fi rm, as the industry witnessed price hike for the third consecutive month despite demand hit. All-India average cement price increased by 1% MoM (~Rs60-80/tonne) led by 1.5-2% price hike in Eastern, Southern and Western regions. However, average price in Northern and Central regions remained broadly fl at on MoM comparison.
Price hike was undertaken in May’21 mainly to pass on higher fi xed overheads and rise in fuel cost. - Further, the non-trade prices remained fi rm across regions (barring Eastern region) and moved in tandem with the trade prices. There are certain pockets, where non-trade and trade price (WSP) became almost equivalent. For instance, the WSP in South Maharashtra hovers at ~Rs345-350/bag, while non-trade price also hovers in the range of ~Rs340-350/bag, mainly due to widened gap between WSPs and invoice prices.
- 1QFY22 TD: All-India average price increased by 5% QoQ to Rs330-335/bag, mainly led by sharp ~10% QoQ jump in Southern realization followed by 7.4% QoQ and 6% QoQ jump in Eastern and Western realization, respectively.
- Most dealers have indicated possibility of further price hike to the tune of ~Rs10-30/bag in Jun’21, which in our view seems unlikely in light of the current demand situation. However, withdrawal of lockdown/restriction in several states and pre-monsoon demand are expected to result in sharp volume recovery in Jun’21.
- Further, unlike last year, revival in rural demand (which accounts for ~45-50%) might not happen faster this time due to severe dent in the income level of the people led by second COVID wave. However, we expect rural demand to pick-up signif i cantly post monsoon
5 Likes
Cotton yarn spinning-Turnaround
All Cotton yarn spinning mills are posted one of the best (Historical) profit year Expected to extend the same in coming months.
Few real reasons for galloping of markets are -
- India is biggest exporter of Cotton yarn ,having market share roughly around 30% world consumption
2)Across the world many spinning units in developed countries are closed or Running under utilized due to covid situations created labour shortage.
-
No expansion in industry is taken place since last 3 years ,where as many old units are closed & expected to be not restart
-
Deamand of cotton yarn is outpaced supplies across the globe
-
one of the highest profits & margins earning by spinning mills,
not witnessed in dicas.
mills are covering cotton to their maximum capacity. -
Location of stocks are in strong hands like CCI, MNC and large traders
-
Exports moved very well in March and April due to our cotton being cheapest.
This changed sentiments of market
-
Ginners are not keen to sale as they will be suffering heavy shortage if sold before proper setting of monsoon.
-
unfortunately 10% duty levied on import removing price compition.
6 Likes
couldn’t find the generic chemicals thread but this seems to play out what members here have long suspected and bet on
Is the metal cycle about to cool down / correct for a short term now?
The dollar index is heading towards the 96/98 mark again, before settling. The NiftyMetal Index is showing a decline. Should one be cautious?
1 Like