
Latest newsletter from Marcellus team highlighting the stupendous outperformance of CCP vs the Nifty in FY20
Marcellus CCP +7.6%
Nifty 50 -25%
Outperformance 32.6% (STAGGERING)
Based on the publicly available info - this is what I believe should be the current CCP holdings. Have tried to calculate what has been the FY20 performance of these holdings assuming equal weight holdings in the beginning of FY20. Marcellus CCP being an actively managed PMS - has different weights allocated and also has had some churn in FY20, have publicly revealed exiting Marico around Q3FY20 and entering Divi’s Labs. That is why the FY20 performance number below is different to what they’ve shared.
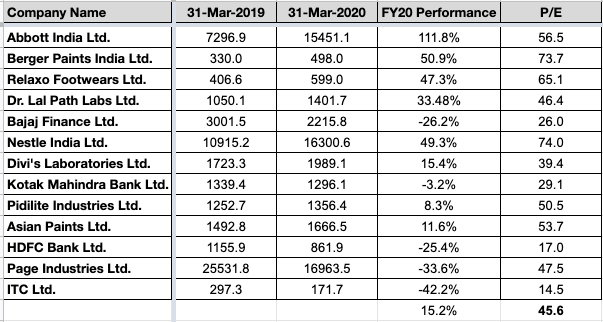
The two numbers at the bottom are based on equal weight portfolio-
FY20 Performance +15.2%
Average Portfolio TTM P/E - 45.6
Number of key takeaways for me from this:
-
4 out of the 13 companies have performed similar or worse than the Nifty with >25% downside
-
Getting even 60-70% picks right in a portfolio can enable significant outperformance vs the market - 30% is massive by all means and regards, do not expect this over a period of time
-
Even Marcellus CCP does not appear perfect - as borne out by numbers above, equal weight portfolio of above 13 companies would have given them double the returns in FY20 (in no way a criticism - just an observation and IMO they’re damn close to being perfect, trust me!)
-
The Average TTM P/E of this CCP is 45.6 vs Nifty current P/E of 16-18x and this portfolio is absolutely smashing the Nifty - please read, re-read and again re-read this point!
@antokdavis - Sincere request to you to please read this newsletter and all the associated newsletters hyperlinked in it, before cluttering this thread with anymore mumbo jumbo lacked by an adequate understanding of Coffee Can approach to investing. Quite a few others have already tried to explain this above to you without much success it seems. With each and every subsequent post, the quality of this thread is getting further diluted.