
Company: Clean Max Enviro Energy Solutions Ltd
Basic Details
• Market Cap: ₹15,238 crores
• Current Price: ₹ 1,296 (as of [13/10/2026])
• Listing Date: 2/03/2026
Brief Intro:
Commercial and Industrial businesses consume about half of all the electricity generated in the country, and pay the highest price for it, ₹7.50 to ₹9.00 or more per kWh, so that DISCOMs can sell power more cheaply to farms and households. It’s cross-subsidisation which has been unchanged for decades.
This gap has created opportunities for companies like CleanMax Enviro Energy Solutions which holds roughly 12% of India’s C&I renewable market, about twice the scale of its nearest pure play competitor, it builds, owns and operates solar, wind and hybrid projects across 23 Indian states, plus the UAE, Bahrain and Thailand.
How the Arbitrage Works
Here’s what CleanMax’s pitch looks like in numbers, for a customer paying the average industrial grid tariff:
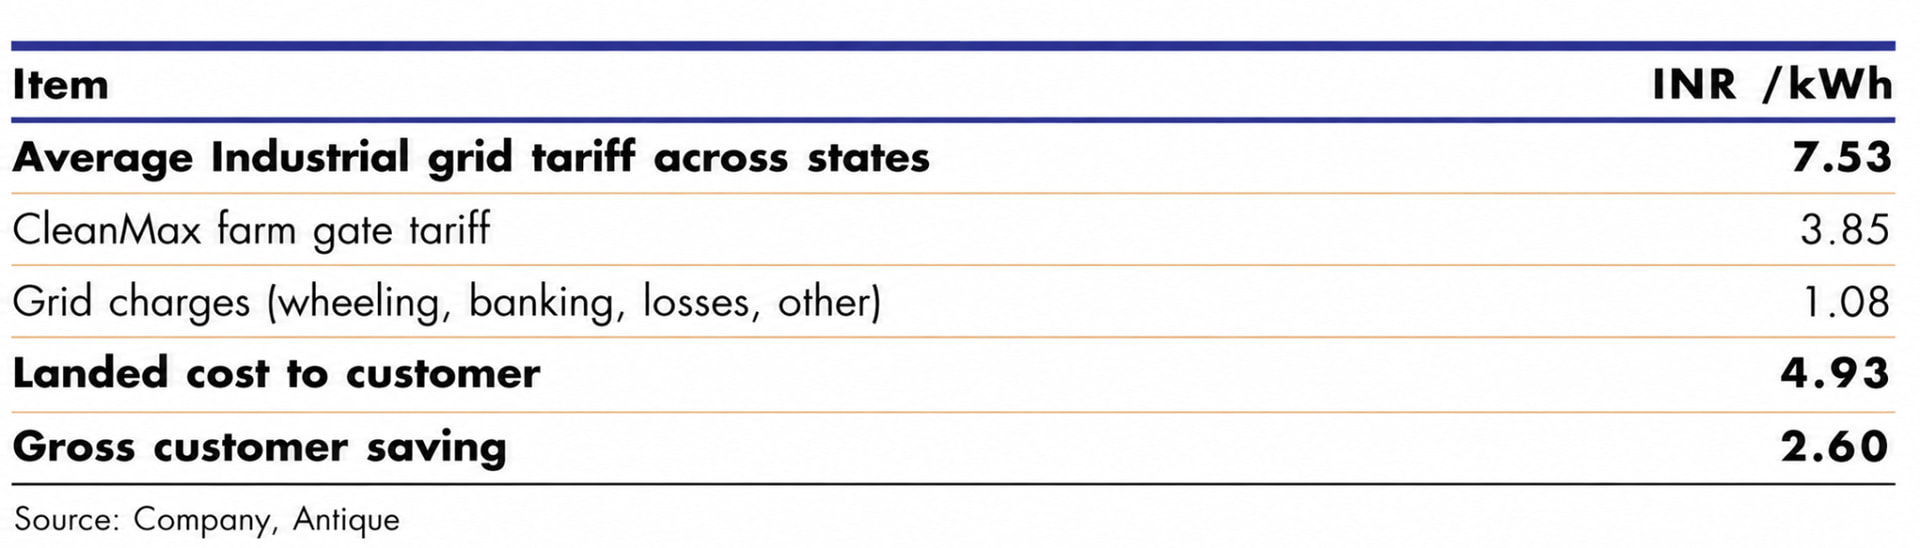
CleanMax’s own price for power, the farm-gate PPA tariff, is ₹3.85, already close to half the grid tariff. Add the grid charges the customer still owes for using the state’s wires (wheeling charges, banking fees for time-shifting supply against demand, line losses, standby charges), ₹1.08, and the landed cost comes to ₹4.93. The customer pays a third less than the grid price, and CleanMax still earns a healthy tariff on the power it sells.
The saving isn’t automatic, though. It belongs to a customer structured as “Group-Captive” which exempts them from CSS (Cross Subsidy Surcharge) and AS (Additional Surcharge) which together, across key states is ₹1.30-2.50/kWh. More on this in a moment.
The market opportunity
Starting with the size of the pool. C&I consume about half of India’s electricity, of that FY23 consumption, renewables supplied 7.4%. The remaining 92.6% came from DISCOMs and Conventional (mostly Thermal) plants.
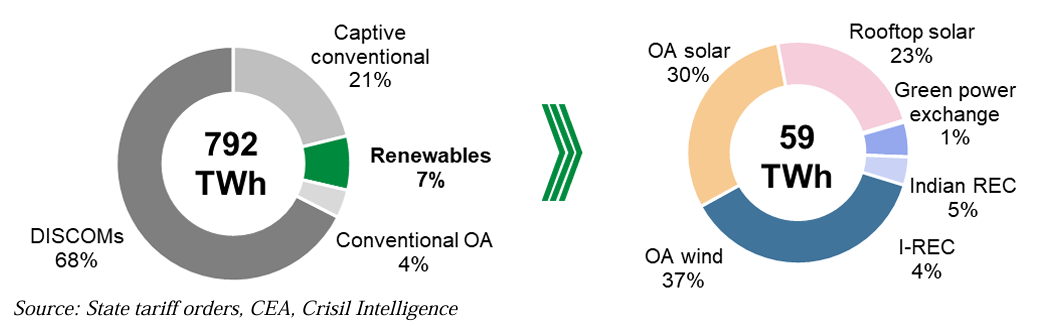
C&I renewable capacity has already grown from 13 GW in FY18 to nearly 45 GW in FY25, and is projected to reach 120-135 GW by FY30, a 22-24% CAGR. That growth comes from three distinct sources and its worth separating them because they have different durability.
-
Replacement of Aging Thermal Captive Plants: India has roughly 80 GW of Captive conventional power capacity, about 96% of it is ageing thermal. CRISIL expects nearly two-thirds of new C&I renewable additions through FY30 to replace that existing Captive thermal rather than serve incremental demand. This matters because replacement demand is far less sensitive to the industrial capex cycle than greenfield demand. A company running a coal captive plant at ₹6-7 per unit has a live reason to switch whether or not it is expanding, because the switch itself is the saving.
-
The Hyperscaler & AI Data Centre Multiplier: India’s hyperscaler IT load is projected to triple from 1.5 GW in FY25 to over 5.5 GW by FY30. Electricity is 30-40% of a data centre’s operating cost, and commercial grid tariffs make that a punishing line item against the roughly ₹5/kWh achievable through a group captive structure. The multiplier is what makes it more interesting. 1GW of IT load translates to about 1.5 GW of continuous power demand, which requires roughly 6 GW of renewable capacity plus 2-4 GWh of storage, since solar and wind do not have a 100% PLF (Plant Load Factor). Run that across the projected build-out and you get a 45 GW addressable market for C&I developers from data centers alone.
-
The tariff arbitrage itself: The third driver is the one to watch most closely, because it’s the one a regulator can take away. A handful of states have already begun tightening the rules that make this arbitrage work smoothly like Maharashtra introducing time-of-day banking restrictions and Tamil Nadu implementing 15-minute settlement cycles, etc. Nothing that breaks the model yet, but a direction worth watching. More on it in the risks section
Why a C&I Developer Is Not Adani Green or NTPC?
When you hear “Renewable Energy Developer” in India, you probably think of Adani Green or NTPC Green. Those are utility-scale independent power producers (IPPs). They bid in competitive government auctions and sell to state DISCOMs or intermediaries like SECI, and the lowest bid wins. C&I developers negotiate bilaterally with corporate buyers, one contract at a time.
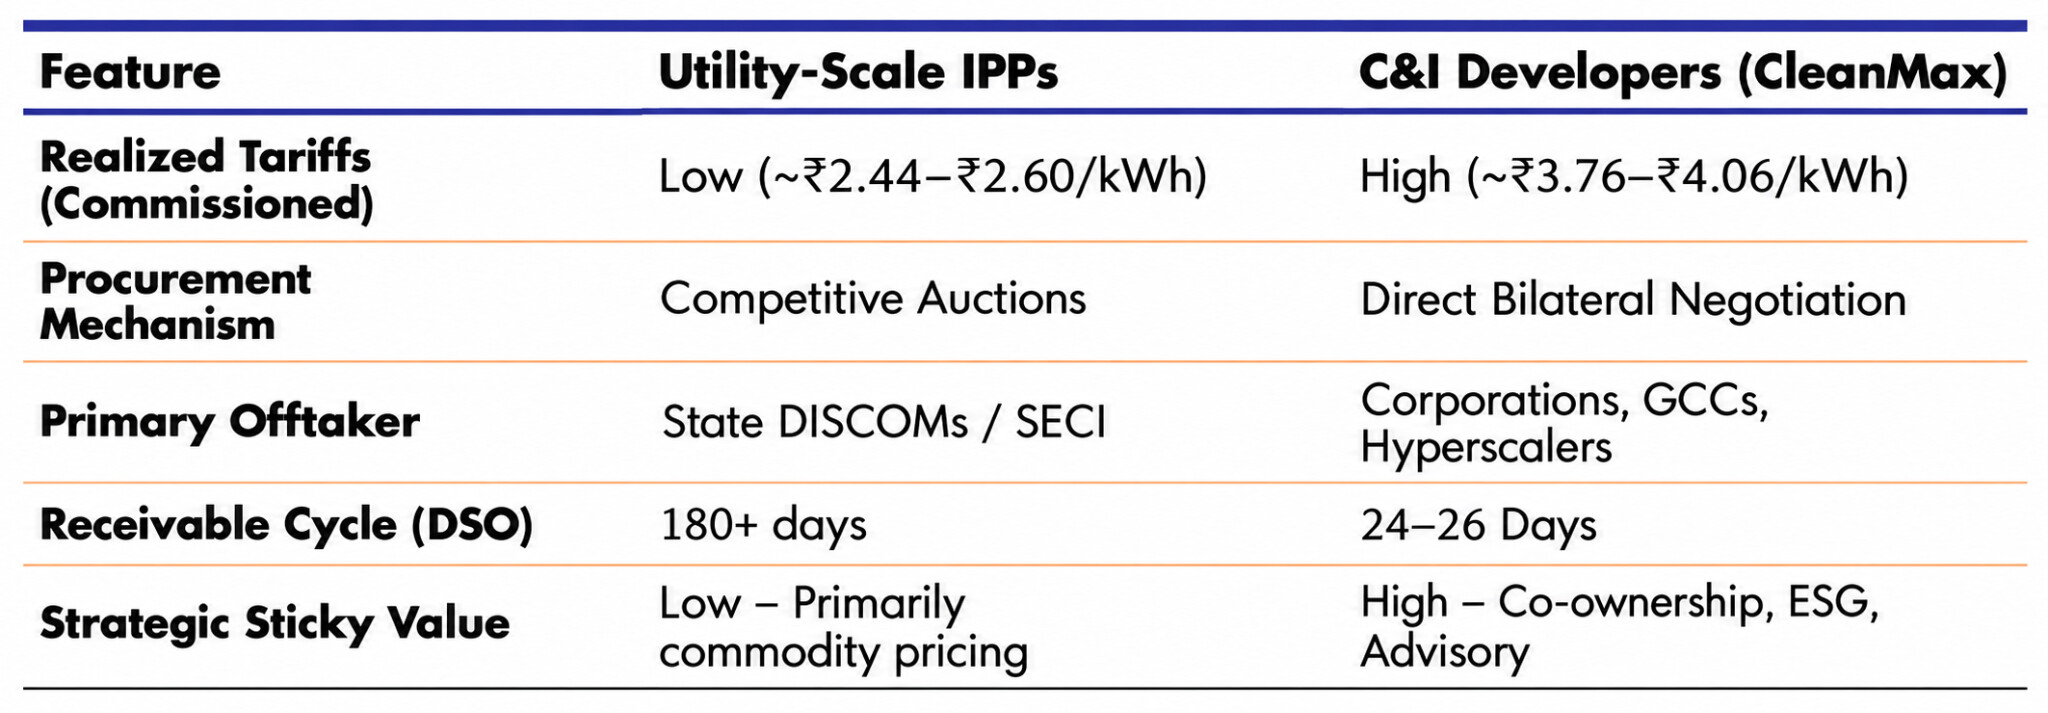
Look at the first and fourth rows. The C&I developer earns a tariff roughly 50% higher and collects its receivables about seven times faster, from counterparties that are far more creditworthy.
So why does the auction route persist? Because it’s easier. You deal with one offtaker, sign one contract for enormous volume. CleanMax, by contrast, has to originate, contract and service with 100’s of separate corporate customers across 1000’s of PPA (Power Purchase Agreement).
That difficulty is the moat. Anyone with capital can buy solar panels. Very few companies can build an origination engine that persuades hundreds of risk-averse corporate buyers to sign 25-year contracts and consistently win repeat business from them.
Three Contract Structures Needed to Understand C&I
1. Group Captive: Under the Indian Electricity Rules, 2005, a project qualifies as a group captive plant if a consumer holds at least 26% of the equity in the project SPV and consumes at least 51% of its annual generation.
That classification is what unlocks the economics. Ordinarily, a company buying power through Open Access i.e from anyone other than its DISCOM pays two levies: the Cross-Subsidy Surcharge (CSS) and the Additional Surcharge (AS). Across key states these run to ₹1.30-2.50/kWh. Group captive plants are exempt from both, which is how customers achieve net savings of 30-45% against grid tariffs.
Notice what this does to the capital structure. The customer funds 26% of the project equity, so the developer’s own equity cheque shrinks. And the customer becomes a co-owner, which makes the relationship far stickier.
2. Third-party open access: Here the developer retains 100% of the SPV and sells under a conventional bilateral PPA. Because the customer holds no equity, there’s no exemption: full CSS and AS apply, unless a legacy state industrial-policy waiver exists. The saving is thinner, but still real.
3. Virtual PPAs structured as CFD (Contract for Difference): This one takes a moment to follow, but it’s where CleanMax’s fastest growth is, so bear with me.
Meta, Google, Amazon and Apple have committed to carbon-free power, and a growing list of Indian corporates are chasing similar targets, most with a 2030 deadline. For many, Scope 2 Emissions, which is the emissions embedded in the electricity they buy, is the largest part of their footprint and the hardest to shrink directly, because they don’t control the generation mix of the grid they’re connected to. Compounding it, the best wind and solar sites are rarely near their facilities, and often not even in the same state. A virtual PPA solves both problems by splitting the deal into three parts:
- The developer sells whatever electricity it generates into the exchange as ordinary “brown” power.
- Separately, it agrees a fixed strike price with the buyer, say ₹3.85 per unit. If the exchange price that day is ₹3.20, the buyer pays the developer the ₹0.65 difference. If it rises to ₹4.50, the developer refunds the buyer ₹0.65. Either way, the developer’s realisation stays fixed at ₹3.85 for the life of the contract.
- The buyer receives the renewable energy certificates (REC) tied to that generation and uses them to reduce its reported Scope 2 emissions.
The alternative is a green tariff: a fixed premium of ₹0.50-1.00/kWh over the grid rate, with little transparency and no upside if market prices move in the buyer’s favour. A virtual PPA’s cost floats with the market instead, which is why large consumers racing toward 2030 targets increasingly prefer it.
CleanMax’s Business Segments
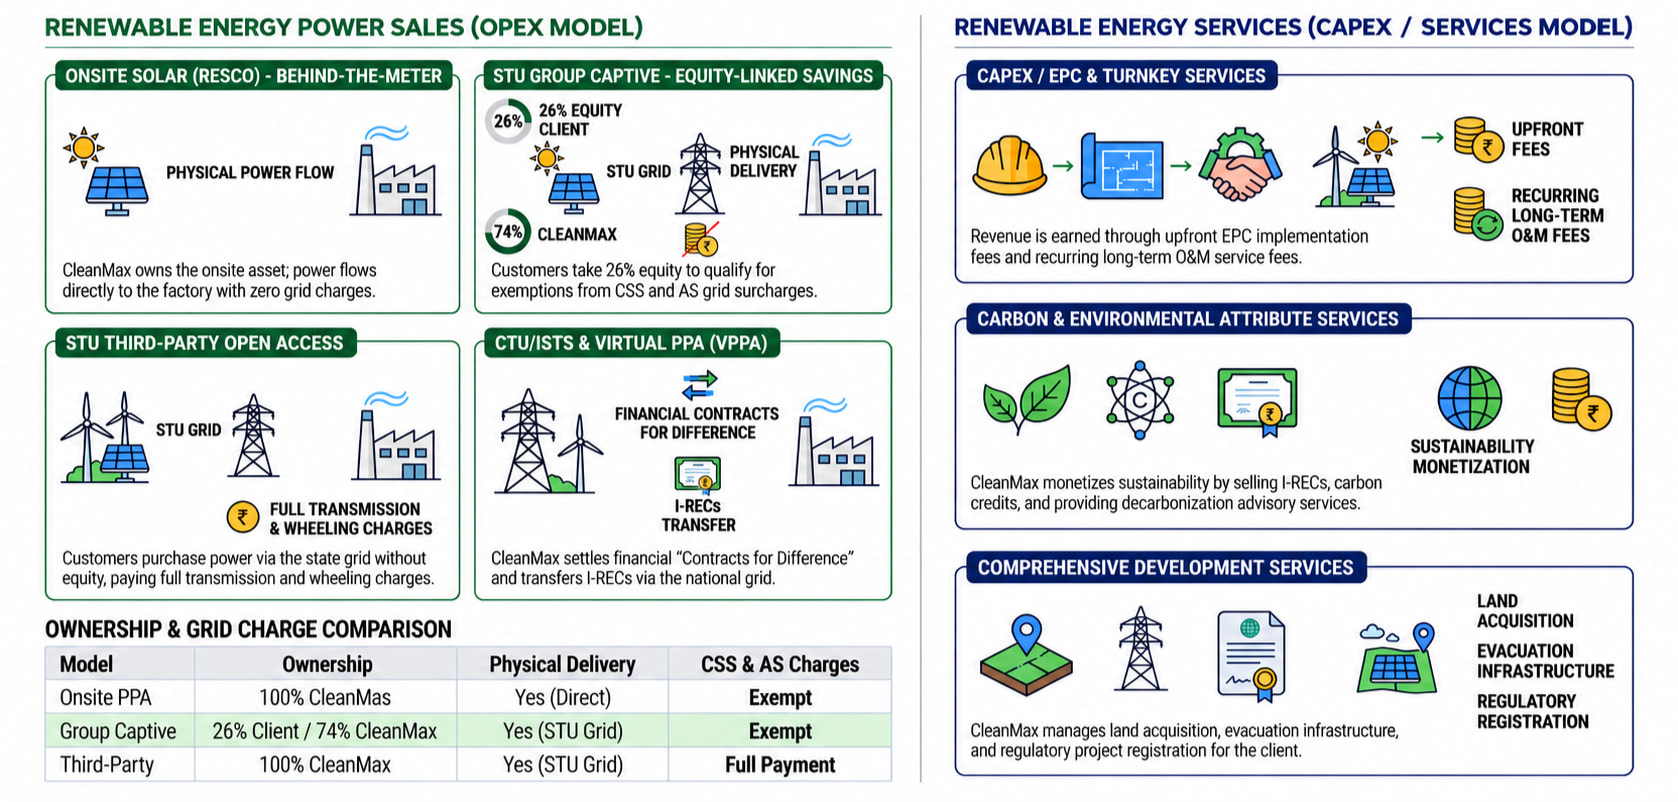
CleanMax runs two segments:
1. RE Power Sales: This segment contributes more than 75% of revenue. It sells electricity under 20-25 year PPAs and VPPAs at fixed tariffs, with gross margins of 92-94% and EBITDA margins of around 84%. Once a farm is built, its fuel is free. As of Q1 FY27, operational capacity stood at 3,493 MW. Four delivery models sit underneath it:
- Onsite solar: CleanMax funds 100% of the capex, installs panels on the customer’s premises and sells per kWh consumed under a 15-25 year PPA. Generation happens behind the meter, so there are no grid or open access charges at all
- STU group captive: CleanMax builds offsite solar, wind or hybrid parks on the state transmission grid. The customer takes 26% of the SPV and commits to consuming at least 51% of the output. CleanMax funds the remaining 74% plus the project debt, builds and operates the plant, and sells at farm-gate tariffs. Customers achieve net savings of 30-45% against grid tariffs
- STU third-party open access: Same offsite park on state transmission grid, but there’s no customer equity. CleanMax earns the contracted farm-gate tariff, and the customer absorbs CSS and AS.
- CTU Connected: These are large projects on the central transmission network, with two revenue routes. The first is interstate physical supply to multi-state industrial customers. The second is virtual PPAs and EAPAs for global hyperscalers, where CleanMax sells the physical power on the Energy Exchange, settles against a fixed strike price via CfD and transfers the unbundled renewable attributes (I-RECs) to the customer
2.RE Services (Capex): For customers who prefer to own the asset, CleanMax provides turnkey development, EPC and ongoing O&M. It also runs a smaller carbon credit, I-REC and decarbonisation advisory business. Margins are much lower, with EBITDA margin at about 20% in FY26, up from 14% a year earlier. Operational capacity was 682 MW as of Q1 FY27
The segment is strategically more valuable than its margin suggests. Customer advances fund equipment procurement, so it runs on negative working capital. And it gives CleanMax a relationship with customers who aren’t ready to sign a 25-year PPA yet.
Operational and Contracted Capacity as of Q1 FY27
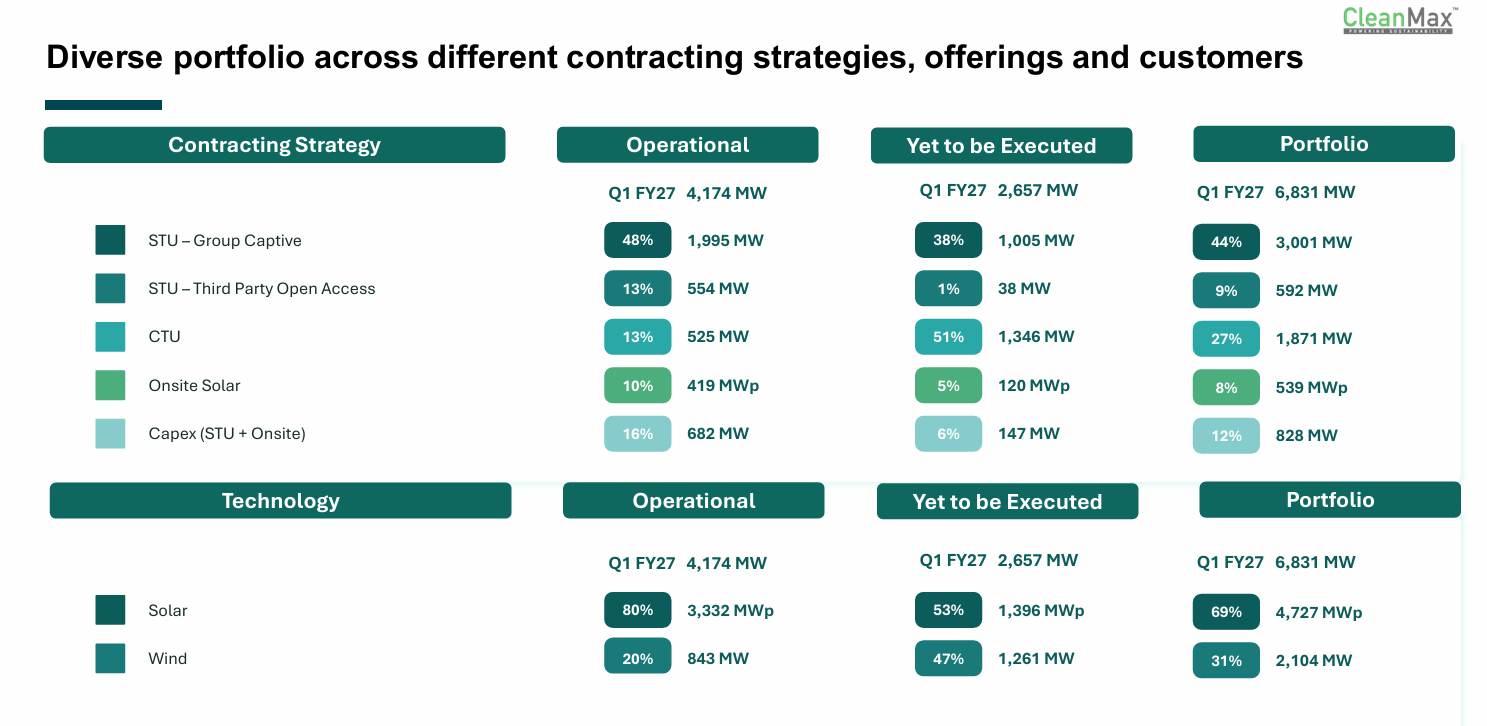
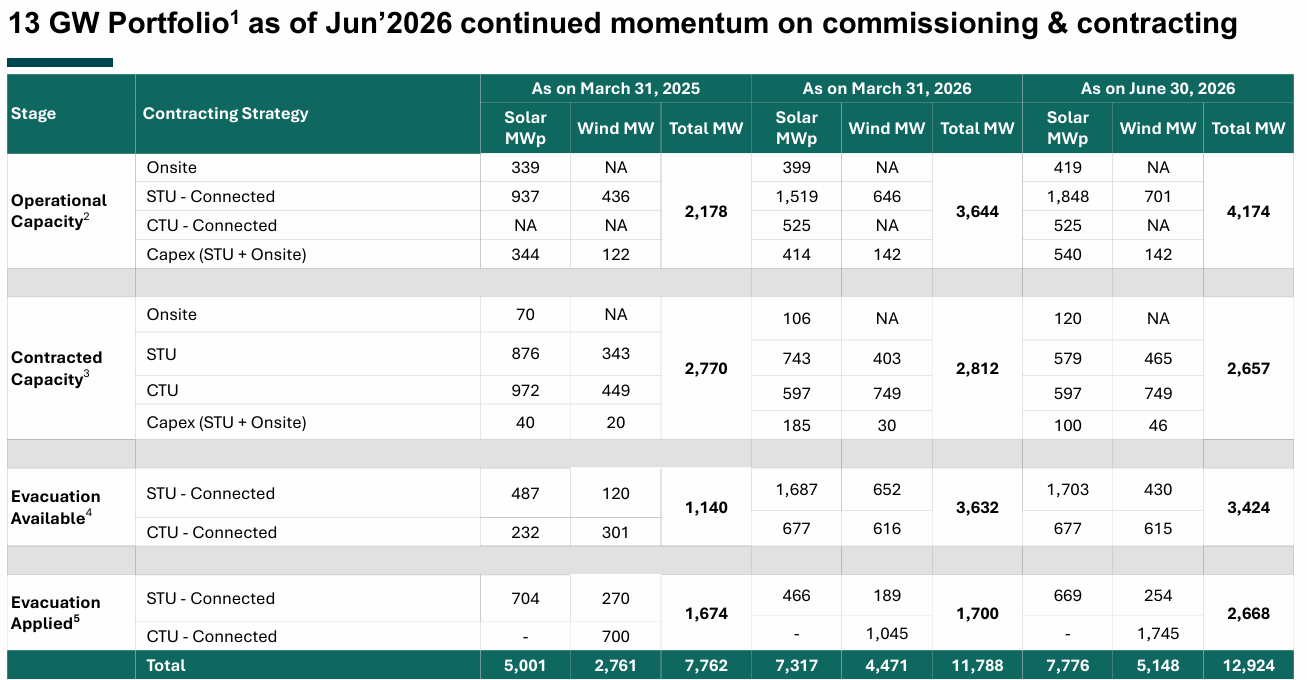
Two things stand out here:
-
The mix is tilting toward wind: Wind is 20% of the operational fleet but 47% of the unexecuted pipeline. That is almost certainly deliberate. Solar generates only in daylight, and wind smooths the generation profile, which round-the-clock contracts demand.
-
There is a pipeline behind the pipeline: Beyond contracted capacity, CleanMax reports 3,424 MW with grid evacuation already available and 2,668 MW where evacuation has been applied for. Grid connectivity is one of the key bottlenecks in Indian renewables, and CleanMax is securing it ahead of signed demand.
The Hyperscaler & Data-Centre Growth
Contracted data-centre and AI capacity went from 240 MW in March 2024 (14% of the portfolio) to 2,400 MW by March 2026 (42% of contracted capacity): a tenfold increase in twenty-four months. CleanMax estimates it holds 35-38% of hyperscaler energy deals in India and about 37% of the domestic virtual PPA market.
The book splits two ways:
- Virtual PPAs and EAPAs: 1,870 MW (78%): These are CTU-connected emission-offset deals for global hyperscalers: Meta at 1.1 GW+, Google at 258 MW, Amazon at 100 MW, and Apple through a 150 MW joint venture.
- Direct physical supply: 510 MW (22%):This is STU group captive power delivered physically to data centres like Equinix, STT GDC, NTT, Iron Mountain, Princeton Digital Group, Cisco, L&T and HPE. They are clustered around the subsea cable landing hubs of Mumbai, Chennai and Bengaluru.
What makes the business durable
1.A savings buffer that absorbs regulatory pressure: The obvious worry is that grid charges rise until customers stop saving. So how much room is there?
CleanMax structures its PPAs as a farm-gate tariff plus actual grid charges, so any increase in wheeling or transmission charges passes straight through to the customer rather than hitting CleanMax. It also guarantees a minimum saving of ₹0.50 per unit, against a current gross saving of ₹2.60 leaving ₹2.10/kWh of headroom.
So grid charges would have to rise by ₹2.10 per unit, nearly double today’s ₹1.08, before a customer’s saving hits the guaranteed floor. That doesn’t make CleanMax immune to regulation. It means regulation has to be punitive, not merely unfriendly, before it bites.
2.Exceptional project-level economics: Stabilised operating assets generate a cash ROE of about 34.93% (FY25) and 34.20% (FY26), with equity payback of roughly 2.51 years against an average contract life of 23 years. Put simply, a project recovers its equity in two and a half years and then has about twenty years of contracted cash flow still to run.
The consolidated numbers look far more ordinary: cash return on capital of 13.03% in FY25 and 11.90% in FY26. That isn’t a contradiction. It’s construction drag. Capital sunk into projects that
aren’t generating yet sits in the denominator and earns nothing, which is exactly what you’d expect from a company nearly doubling its fleet in fifteen months.
The implication is that the gap only closes when growth slows. As an investor, you are underwriting the project economics, not the reported ones, and you should make that leap consciously.
3.Sticky, high-quality customers.
- 588 corporate customers across 1,280 PPAs, with an average contract tenure of 23.25 years.
- 79.09% of new contracted order inflow in Q1 FY27 came from existing customers expanding their procurement. Over the last three fiscal years, repeat business consistently drove 74% to 81% of annual volume additions at 73.99% in FY26, 77.28% in FY25, and 81.53% in FY24.
- 95.06% of counterparties are rated A- or above, and 81.21% are AA/AAA-rated or MNC subsidiaries.
- No single customer accounts for more than 10% of revenue.
Land a customer once and you have a 23-year annuity from an investment-grade counterparty that pays in about 25 days and will probably buy more. That is a genuinely unusual asset in Indian power, where most producers wait six months or more to be paid by a DISCOM.
4.A capital-light approach to a capital-heavy business: Three sources reduce the equity CleanMax has to commit at the parent level:
- Customer equity: Group captive customers contribute at least 26% of SPV equity.
- Strategic co-investors: Apple holds 49% of CleanMax Taurus, and Osaka Gas invested ₹176 crore for 51% of a 300 MW platform
- Negative working capital: Customer advances in the services business fund equipment procurement.
The capital it does raise is getting cheaper. CARE upgraded CleanMax to AA-/Stable from A+ in May 2026. Its weighted average project borrowing cost fell from 9.5% in FY24 to 8.4% by 30 June 2026, and it is preparing its first domestic corporate bond issue to refinance term loans. In a spread business, those 110 basis points flow almost entirely to equity returns.
5.Regulatory tightening has so far been a rounding error: Management stress-tested its operational fleet of 2,986 MW (at the time of the analysis) against the most restrictive state-level time-of-day banking rules:
- 48% (1,443 MW) is unaffected: onsite solar (384 MW), CTU interstate supply (525 MW), and third-party open access with plant-level waivers (534 MW).
- 52% (1,543 MW) is exposed: STU group captive, where the harshest rules cost 2.7% of segment EBITDA.
The consolidated impact is 1.4% of EBITDA.
Valuation
With the project economics established, I use a 10-year FCFF DCF, a long explicit forecast that’s defensible here because of the contract structure: a 23-year average PPA tenure gives unusually good visibility on revenue per MW, in a way it wouldn’t for most companies.
Based on these explicit cash flow projections, DCF valuation yields intrinsic value of ₹1,404.60 per share, representing a +8.4% upside against the Current Market Price (CMP of ₹1,296.00).
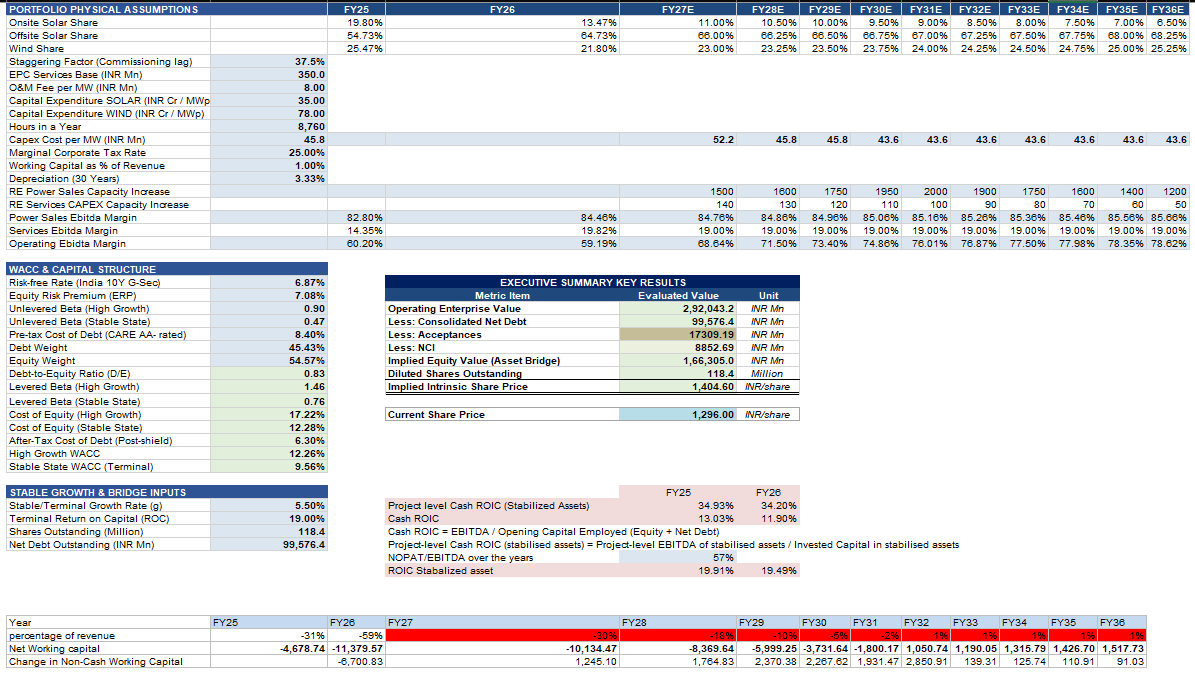
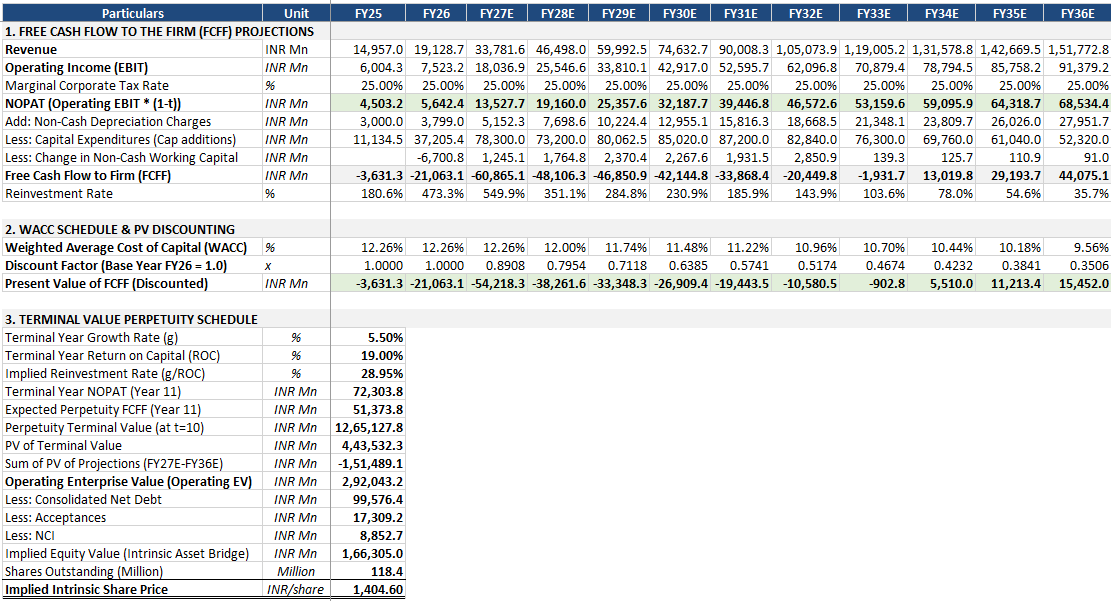
Treatment of acceptances: Note 27 of the RHP financials classifies ₹17,309.2 million of acceptances against capital creditors as current operating liabilities. Acceptances are bank-intermediated payables: the bank settles the supplier’s invoice, and CleanMax repays the bank. Whether you treat them as working capital or as debt is a judgement call and I treated it as debt and deducted in the equity bridge, as above. These are capital creditors, not operating suppliers. The money funded plant and equipment. My view is that the debt-like treatment is both more conservative and more correct, which is why ₹1,404.60 is my headline number.
Risks
-
Regulatory Policy Shifts & Open-Access Economics: The core business rests on a ₹2.60/kWh gross saving, which is facing headwinds on two regulatory fronts. First, state utilities are tightening banking frameworks such as Maharashtra introducing time-of-day (ToD) banking restrictions and Tamil Nadu moving to 15-minute settlement cycles. Second, interstate transmission (ISTS) charge waivers are phasing out on a strict timeline: 25% payable from July 2025, 50% from July 2026, 75% from July 2027, and 100% from July 2028. Projects co-locating Battery Energy Storage Systems (BESS) before June 30, 2028 receive a 12-year waiver extension, creating a strong incentive to deploy batteries, though central grid projects face a rising cost line either way. Equipment costs add further pressure: MNRE’s ALMM List-II mandate for solar PV cells introduces a domestic cell cost premium of roughly ₹60 lakh per MW, though an official memorandum allows C&I open-access and net-metering projects to use non-ALMM cells until December 31, 2026, shifting compliance costs onto post-2026 builds. While CleanMax’s stress test shows a worst-case EBITDA impact of under 1.5% on the existing operational fleet insulated by contractual pass-throughs, new contracts may require higher pricing to preserve target returns, which in turn could slow down the growth in new contract additions
-
Inter-State Transmission (CTU) Curtailment Risk: This risk has already materialised. CleanMax’s 525 MWp Bikaner-II CTU solar project in Rajasthan ran at roughly 70% curtailment in June 2026, because PGCIL’s Neemrana-II substation wasn’t ready. The plant could generate, but it couldn’t evacuate the power. This generated an annualised EBITDA drag of ₹167.3 crore (~9.1% of consolidated run-rate EBITDA), with grid backdown expected to persist through the end of FY27 while transmission upgrades catch up. While the subsequent Koppal project in Karnataka is flagged with no curtailment risk.
-
Minimum Savings Guarantee Revisions: The minimum savings guarantee protects a customer’s saving against rising utility costs, but if DISCOM grid tariffs themselves fall, the guarantee can force CleanMax into downward tariff revisions to keep the promised saving intact. That has already happened in isolated cases across Gujarat and Karnataka. The secular direction of Indian grid tariffs is still upward but it’s still an active contractual risk worth considering
-
BESS Execution: Delivering 24/7 round-the-clock power and securing post-2028 ISTS waiver extensions depend entirely on battery storage. However, BESS entry is capital-intensive and in a technology domain where CleanMax has no operating history at scale. Key operational variables such as lithium-ion cell pricing, cycle life performance, and degradation rates remain open execution questions. Co-locating BESS before June 30, 2028 is mandatory to unlock the 12-year ISTS waiver extension, making storage both a capital-cost risk and a strategic necessity.
-
Private Equity Overhang: Brookfield holds about 21.3% and is expected to sell down its position over time, which can amplify share price volatility regardless of underlying operational performance.
Thanks @GourabPaul for introducing me to CleanMax and guiding me through the research
Disclaimer
Small and midcap stocks and recent IPO stocks carry higher risks due to their smaller size, limited operating history. This analysis is for educational purposes only and should not be considered as investment advice. Always conduct your own research or consult with sebi registered financial advisors before making investment decisions.