
Hi @AlokMoghe.
I try to automate everything I can on Google finance.
The code for the 200DMA is:
=average(query(sort(GoogleFinance(“NSE:” & A13,“close”, today()-300, today()),1,0),“select Col2 limit 200”))
where I keep the NSE codes in my A column, in this case A13. An example with Infosys, replacing the A13 is:
=average(query(sort(GoogleFinance(“NSE:” & “INFY”,“close”, today()-300, today()),1,0),“select Col2 limit 200”))
Sometimes the NSE codes return an error, or you may be looking for a company listed on the BSE. In this case, you can just add the six digit BSE code directly. For GRM Overseas,
=average(query(sort(GoogleFinance(“531449”,“close”, today()-300, today()),1,0),“select Col2 limit 200”))
It’s based on this post at stack overflow. Please note that this calculates the simple moving average, while the support lines on Screener.in are exponential moving averages.
Once you have the moving averages, you can use the current price to calculate how much higher / lower it is to the support line, and I use conditional formatting to make it easy to eyeball.
There’s a whole host of attributes that google finance automatically parses, including daily volumes, P/E multiples, etc. You can read more here:
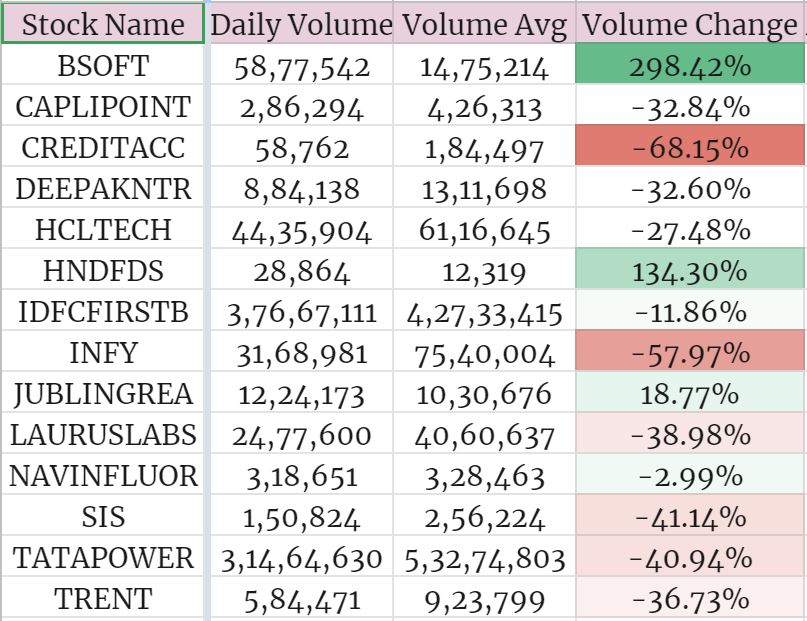
Edit: Here are the daily volumes compared to the 50 day average for my portfolio:
If you’d like the full sheets template, I can send it to you via DM ![]()