Can Growth, Valuation and Momentum Together Help Reduce Portfolio Drawdowns?
My 5-Year Backtest Reveals Some Interesting Findings.
Why I decided to test this strategy
Whenever we look at companies for investing, we generally pay attention to their business growth, profitability, valuations and future opportunities.
But one thing I have been thinking about is whether identifying a good business is enough.
Because even if a company is growing well, that doesn’t necessarily mean its stock price will continue performing well. We have seen several cases where fundamentally strong companies experience significant price corrections.
So I wanted to test something slightly different.
What if we combine business growth, reasonable valuation and price momentum, while also having certain rules to exit stocks when their price behaviour starts changing? Would such a strategy perform differently during market corrections? More importantly, would it help reduce portfolio drawdowns?
To understand this, I ran a historical backtest covering approximately five years, from January 2021 to May 2026.
My intention was not simply to find a combination that generated attractive returns. I was particularly interested in understanding the drawdown side. Because I feel generating returns is one part of investing, but protecting those returns during difficult market conditions is equally important.
How I selected companies from growing industries
My starting thought was fairly simple.
If an industry is growing, companies operating within that industry may have opportunities to expand their businesses.
For this particular backtest, I used:
-
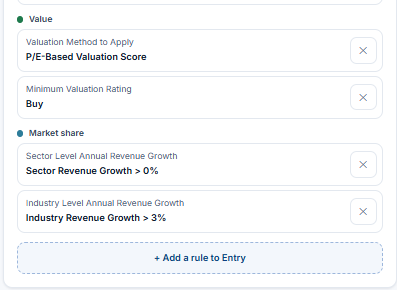
Sector annual revenue growth: Greater than 0%.
-
Industry annual revenue growth: Greater than 3%.
But sometimes the market has already priced in several years of expected growth. Even if the business continues performing well, the stock may not deliver similar returns because its valuation is already expensive.
This is where I wanted to add another condition.
For valuation, I used a P/E-based valuation score, with the minimum qualifying rating set to “Buy”.
Why I added price momentum
Instead of buying stocks only because they appear fundamentally attractive, I wanted to see what happens when we also require some evidence of price strength.
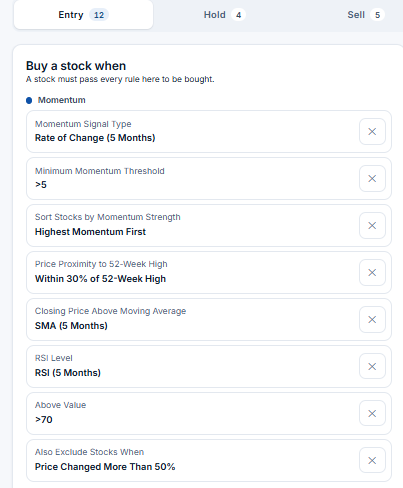
For entry, I selected the following conditions:
-
Momentum signal: 5-month Rate of Change.
-
Minimum momentum: Greater than 5.
-
Ranking: Highest momentum first.
-
Price proximity: Within 30% of the 52-week high.
-
Trend: Closing price above the 5-month simple moving average.
-
RSI: 5-month RSI greater than 70.
-
Additional exclusion: Price changed more than 50%, as defined in the backtest setting.
How I constructed the portfolio
After defining the selection criteria, the next step was to understand how this basket of stocks would have behaved historically.
The configuration was:
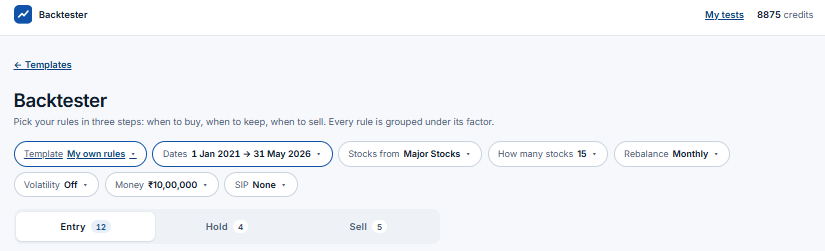
After defining the selection criteria, the next step was to understand how this basket of stocks would have behaved historically.
One thing I want to highlight is that the portfolio was not necessarily holding 15 stocks throughout the period. The setting allowed up to 15 stocks, but actual holdings could be fewer depending on how many companies qualified.
Buying a stock is one decision. Continuing to hold or exit it is another.
I feel having a proper process for holding and exiting stocks is equally important as selecting them.
For continuing to hold a stock, the strategy checked whether:
-
The stock remained above its 10-month SMA.
-
It remained within the top 600 ranking.
-
It continued to qualify under the selected P/E-based valuation rating.
For exiting a stock, I included the following conditions. Any one of these could trigger an exit.
| Exit rule | Setting |
|---|---|
| Monthly price decline | Greater than 12% |
| RSI | 5-month RSI crossing above 85 |
| Price trend | Price falling below 5-month EMA |
| ADX | Crossing above 80 |
What did the five-year backtest show?
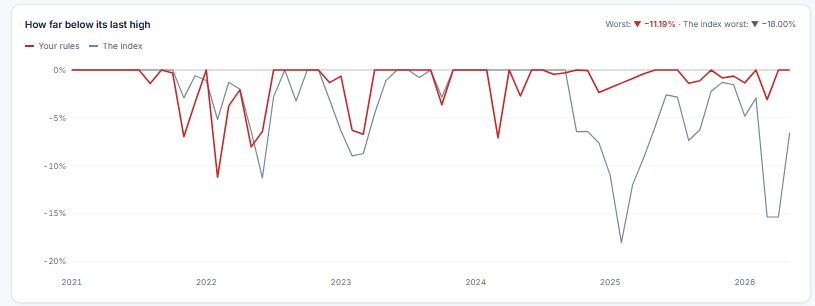
Now, coming to the results.
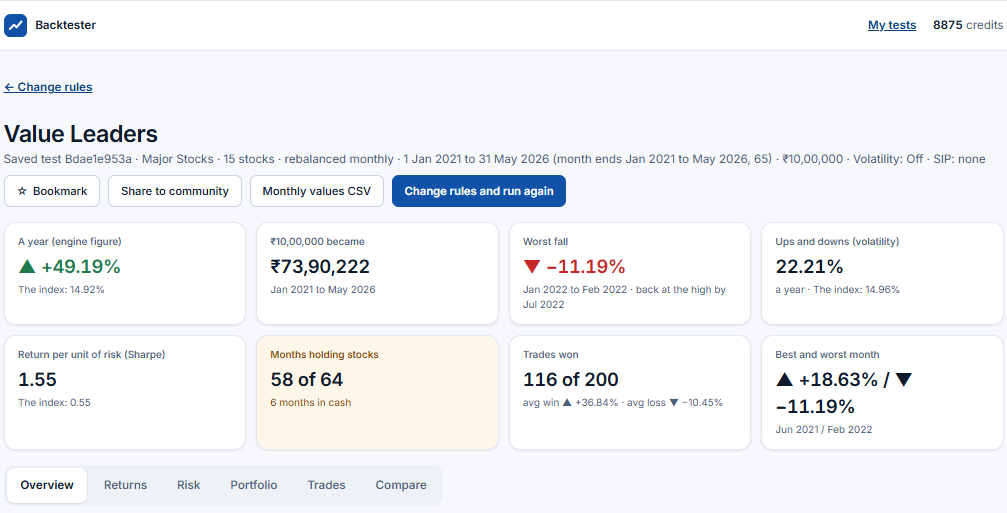
One of the first things that caught my attention was the difference in maximum drawdowns between the strategy and the benchmark.
-
Strategy maximum drawdown: -11.19%
-
Nifty 500 TRI maximum drawdown: -18.00%
That’s a difference of approximately 6.81 percentage points.
For me, this was worth understanding.
Because when we look at portfolio performance, we generally focus a lot on returns. But the extent to which a portfolio falls from its previous high also affects the investor’s experience.
For example, a portfolio that falls 40% requires a gain of approximately 67% just to recover its previous value. Whereas a portfolio that falls 20% requires only a 25% gain to recover.
So the size of the drawdown makes a considerable difference.
However, there was another interesting observation. Although the strategy recorded a lower maximum drawdown, its annualised volatility was actually higher.
| Metric | Strategy | Nifty 500 TRI |
|---|---|---|
| Maximum drawdown | -11.19% | -18.00% |
| Annualised volatility | 22.21% | 14.96% |
So the strategy was not necessarily less volatile. It simply experienced a smaller maximum decline from its previous peak based on the monthly observations.
What happened during negative market months?
Another observation was how the strategy behaved during months when the benchmark declined.
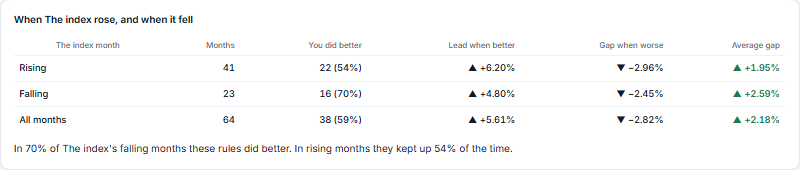
The backtest contained 23 months in which the Nifty 500 delivered negative returns.
Out of those:
-
16 months: The strategy performed better than the benchmark.
-
7 months: The strategy performed worse than the benchmark.
So in approximately 70% of the benchmark’s negative months, the strategy delivered relatively better performance.
This doesn’t mean the strategy generated positive returns in all those months. It simply means the strategy performed better relative to the benchmark, even if both were negative.
Another important observation: the portfolio was not always invested
While studying the results, there was another aspect that caught my attention.
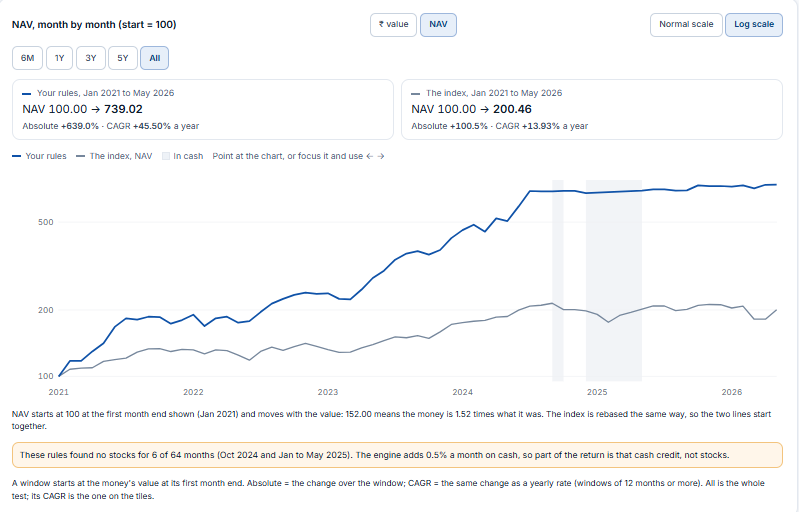
The strategy held no equities during six of the 64 monthly return intervals, including October 2024 and January to May 2025.
Interestingly, some of these months overlapped with the benchmark’s larger correction.
This could have contributed meaningfully to the difference in drawdowns.
So sitting in cash is also part of a strategy.
When market conditions don’t support the selected rules, the process may keep the portfolio away from equities rather than forcing it to remain invested.
At the same time, the lower drawdown cannot be attributed entirely to momentum exit rules, since reduced equity exposure and the assumed cash return may also have contributed.
What this backtesting exercise taught me
The biggest learning for me from this exercise is the importance of having a process-driven investment approach.
When we select stocks individually, we usually focus on whether a particular company looks attractive. But when we build a basket of 15 stocks, the picture becomes different.
We also need to understand how those stocks behave together, what happens when some lose momentum, when positions need to be replaced and how the overall portfolio responds during market corrections.
A strategy is not only about which stocks to buy. It is also about when to enter, how long to hold, when to exit and when not to invest at all.
In this particular test, the combination of growth, valuation, momentum and exit rules produced a lower reported maximum drawdown than the benchmark. Though it doesn’t prove that any single rule was responsible, it gives an interesting perspective on how the complete process worked.
Before putting capital into a strategy, understanding how that strategy behaved in the past, especially during difficult periods, helps us make more informed decisions and understand the risks involved.
I would love to hear your views on this approach and any suggestions on how I can further improve this strategy.