Could not find relevant topic hence created new one.
Am working on this concept from sometime hence putting here for community comment.
For whom: Long term investor with less dedicated time.
Problem: When to Buy, When to Sale and How much is always top question for investor.
Solution: Can we develop systematic approach?
Example: Reliance. I purchased at level of Rs. 950 & 1100 but failed to averaging it on his upward movement.
When we purchase stock; in long term either it goes up or down. For simplicity lets consider we have Rs. 100 invested in stock.
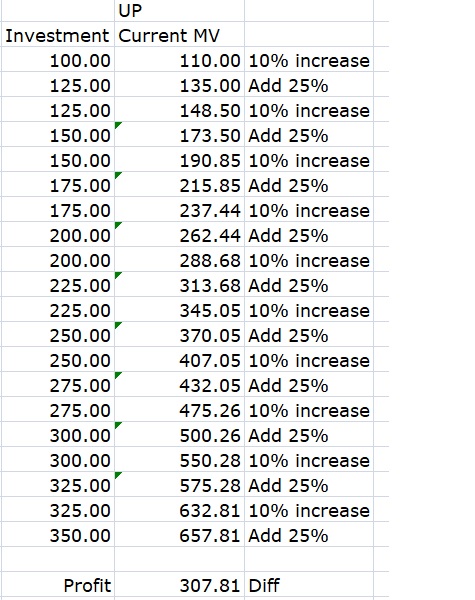
When stock moves UP:
Action: Averaging on up ward movement.
10% UP add 25% of initial investment (Rs. 25 in our example)
If no action taken then Investment of 100 will become 260.
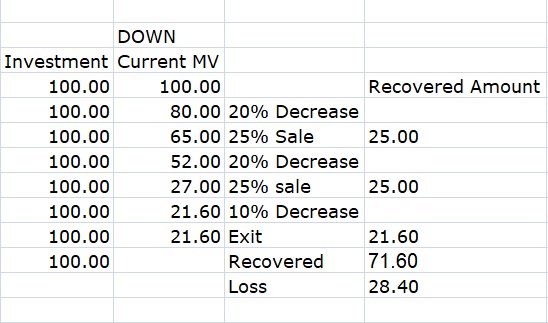
When stock moves DOWN:
Action: De-averaging on down ward movement.
20% DOWN Sale 25% of initial investment (Rs. 25 in our example)
If action taken when stock is down 50% then Investment of 100 will be of 50.
There are many assumptions is taken like accurate mapping of price and sales on exact market price etc. Hence in actual scenario result will be slightly different.
For downward movement, when we sale 25% of invested amount, the net invested amount will also reduce. But same is not reflected in your calculation. May I know the reason?
Other than that, I personally feel a good method for at least those who do not have much time as well as knowledge to determine entry and exit price levels. Thank you for sharing.
Personally I feel that any long term investor won’t sell a stock just because it’s price has fallen down. Unless and until you need the money or something fundamental changes in the company (earnings, moat, management, etc), I don’t think it would be right to sell shares. Averaging up can also be a double edged sword, you reap slightly better returns as opposed to if you hadn’t done anything, but you are also increasing your risk by buying at higher valuations.
I think we can, but it might not be simple to make. We’d need to correctly develop a parametric mathematical model with enough expressive power and then fit the parameters based on past data.
I just have 1 comment on the scheme you have suggested: it sounds a lot like momentum trading. The difference is that the momentum in this case is accompanied by fundamentals as well. I personally plan to follow some kind of momentum investing but the momentum is in fundamentals not price. The difficulty is we only get data 4 times a year, and even then we need to discount for the present conditions, take a view on whether the improvement or deterioration in fundamentals is secular or cyclical or one-off. Imo it is this determination which makes the process very subjective and generates an edge for hard working investors. To consume all possible information, in an unbiased way, and then correctly predict not only the future direction of fundamentals but also the duration of the said fundamentals, is indeed a challenging task.
To give an example: consider Nestle India. They had the famous 2015 maggie Fiasco. From a high of 7000 in 2015 Feb it fell to 5000 in 2016 beginning. That’s a drop of roughly 30%. Sales had declined 17% for the affected year. Also, did we really expect a Swiss FMCG giant like nestle to not do anything in order to bring back Maggie? The market was (imo) clearly over-reacting to a temporary problem. In such a case, would it make sense for an intelligent investor to average up, or to average down? Imo, it would make sense to average down and buy more of nestle. Nestle has become triple in the last 4 years since that incident.
The question of whether to average up or down depends on the time horizon of the bump up or bump down in profits, related to time horizon of the investment itself. For a 10 year investment horizon for a specific company, momentary falls in profits due to 1-off is a reason for buying more not selling. For a 3-year investment horizon a 1-year fall in profits could easily be a good reason to sell.
Thanks. @Killerswit. First column just shows paper investment. The reduced investment is shown in column 4.
Thanks @Yash_Puthran and @sahil_vi.
Sahil, Good point. let’s just take example of Nestle you quoted. At that time there was fear in market that maggi will be ban completely and am not sure investor like me can take the call. If we continue de-averaging concept; let’s say we have Rs. 100 of nestle. With fall of 30% our 20% down trigger and we should sell 25% and we remains with Rs. 75. Now when nestle triples that means it’s up 10% multiple times. So we should have participant in better way.
I believe we should not sell in hurry, hence considered it at 20% vs 10% trigger in UP.
Said so this is Work in Progress. Averaging UP need liquidity/cash on hand.
it is not the better way, it is the strictly sub-optimal way. If we bought 25% additional when 20% downfall happened, we would have received much more units than if we bought it if we averaged up. Another way to put it is, how far away from optimality are we ready to be, in order to stick to a quant system? That is a personal choice every investor has to make. It also depends on each investor’s investment goals. if the aim is to beat market returns by 4-5%, what you’re enumerating might very well work. But if the aim is to average 26% per year like samir vartak wants to (Great articles to read on the web - #1011 by harsh.beria93) then it definitely would not make sense, imho.
This is the template I have made. Its a google sheet which auto populates the prices from NSE. it has a built in add and sell price (which i have kept at 30 percent above the target price (which is 13 percent CAGR). Similarly if it falls below add price we can add
Thanks @sahil_vi, I respect your view. As you rightly mentioned its depend on individual’s goal.
I heard Samit live on Saturday. Indeed its treat listen to him. Must say new age investor is innovative and hard working.
@bhaskarbora67, it’s actually opposite, its de-averaging on down. Thanks.
@Dr.stock, Thanks. If I rightly understood, it seems you are averaging both way UP and Down. Integrate live stock feed - new to me, good idea. Thanks.
Thanks for acknowledging, I respect your views too. Another thing I wanted to add is that I absolutely do like averaging up. In fact in 3 of my PF stocks: astec, poly medicare and NCC I have been averaging on the up move. My ability to average up does depend on “how large the opportunity size is”. If i believe a company will grow its earnings 3x-4x in 5-7 years, then I would not mind paying up 10-20% more than my 1st buying price. But if a company is a pure under-valuation “mean reversion” play, I might not have the margin of safety required to average up. What I would definitely avoid is an indiscriminate averaging up. If the stock moves up 200% in a year, I would most certainly not feel comfortable to buy at those levels for most companies, if the earnings only grow < 100%.
@Dr.stock I just wanted formula in the google sheet, you can just enter 1 row with referencing as I want to know how to create in the google sheet. the column you have posted doesnt contain formula required to create it (ex =googlefinance"price") and such other attributes. Even 1 row is enough with any random data you create for any stock.
I had developed a strategy around 2 years back on the similar theme but it will need some effort from the investor.
Identify the highest quality stocks which you can invest for a long term, like 7-10 years or more.
Eg: Reliance, HUL, TCS, etc… the bluest of blue chips which you know will not default or trap you.
Then, just buy 1 share of each (or x shares depending on your capacity) whenever the stock is down 1% (or x%).
Because of this, my average buy price of Reliance is considerably lower. I have thus bought on dips.
I spend 5 min in the morning at 9:15 am to place a buy order on each of my selected stocks at a 1% lower to close of last day. If it hits, good. If doesn’t let it expire and repeat the process next day.
Couple of drawbacks:
You need to devote time everyday, even though it’s just 5 min. However, even if I miss placing an order some day, it’s okay. It’s a long game.
Sometimes the stock goes down 3-4%, then I need to buy 3-4 stocks. Remedy is that once I have bought 1 stock in the morning and then I only check prices at around 3 pm. If it’s fallen more, I add more. On the volatile days, this strategy throws issues, but it’s okay.
If I can code this stuff, then amazing.
Warning: Do this only with the bluest of blue chip stocks.
@vaibhavjain87 Thanks for sharing.
This seems interesting. It seems better than SIP; many people doing SIP in blue chip every month on fix date.
What is your experience so far? If you can quantity with numbers for 1-3 stocks you did this. Like how much quantity you had when you started with purchase cost and how much is now both Qtn/average cost etc.
So I started doing this in Reliance in Nov 2018 with average around ₹1,300 / share. I missed on many occasions as well, for example, when, say in March, Reliance went down by 14% on 23rd March, I bought only 10 shares not 14. And similarly other times mismatch kept happening.
Had this been an algo, it would have run smoothly. There will be variations if done manually, but I think this has worked well for me.
HUL - I started this last year in August, and average has been around ₹2070 (this didn’t fall much in covid times except for once when Block trade happened).
Disclaimer: no intention of selling these off for another 7-10 years. But will stop buying once I hit a certain % of my portfolio in a single stock.
IMO, the impact of averaging and/or de-averaging has to be assessed on portfolio outcome rather than individual stocks. The averaging cyclical stocks will lead to suicide whereas averaging com-pounder stocks will yield better results in long term say atleast 10 years. Such plain mathematical formulation is good for satisfying market grieved soul but wont make anyone wealthier. Only mathematics wont make wonder in stock market! Best step is to keep researching and reading the company fundamentals across market, there will be high probability to get hold of some real gems.