
While I am writing this thread Buger King India received SEBI approval to listing. This IPO may be the most awaited IPO of 2020 considering the fact that India has long runway for growth in CDR/QSR segment.
The issue will comprise a secondary share sale worth Rs 600 crore by private equity major Everstone Capital and fresh fundraising worth Rs 400 crore, which will be used to fuel the burger chain’s expansion plan.
Promoter : (Everstone 87.5% , Burger Corp USA 12%)
Everstone Capital created an investment holding company F&B Asia Ventures to build a pan-Asian food and beverage platform with assets across multiple cuisines, geographies and formats. On the QSR front, the platform company plans to grow Domino’s Indonesia, as well as Burger King Indonesia and India, by 30 to 50 stores each annually. Currently, Burger King Indonesia has over 70 stores while Domino’s Indonesia has more than 130.
About QSR sector
Quick service restaurant platforms are getting much better valuations than casual dining since they can be easily scaled up. On the back of their good economics, these can also be taken to market easily.
According to GlobalData, the Quick Service Restaurants (QSR) & Fast Foods segment in India has witnessed steady growth and reached US$45bn in 2018 and is forecast to reach US$63bn in 2023 at a compound annual growth rate (CAGR) of 7%.Though the market is very fragmented, with smaller chains together holding 97% of value share in 2018, the growing inclination towards branded chains makes it lucrative for international fast food joints.
Burger King has had a presence in India since late 2014, but it hasn’t been alone in targeting the market since that time. According to the Economic Times, six burger chains, including Burger King, McDonald’s, Carl’s Jr., Fatburger, Wendy’s and Barcelos have planted a flag in India in the past five years. In March, Johnny Rockets also announced its return to India earlier this year.
There’s a reason for this movement. While smaller chains in the market made up 97% of market share last year, consumer inclination is shifting toward branded international QSRs, according to GlobalData research. India’s dine-out market is expected to reach $131 billion by 2022 with QSRs expected to grow 9.2%, according to Euromonitor data reported by the Economic Times. Western branded QSRs are projected to grow at a rate of 13.4%, making up $1.8 billion by 2022.
India’s per capita spend is much lower than other countries. This gap remains significant even if we compare the per capita spend in top-8 cities (which constitute 42% to food service market). When we analyze the per capita spend across cities on the basis of the nature of store, spend on unorganized food service is similar across the top-8 and the next-21 cities. The difference arises in the per capita spending on chained and organized standalone categories (Rs 2,546 / Rs 4,584 in top-8 cities versus Rs 587 / Rs 1,830 in the next-21 cities). This further strengthens our belief on the huge runway for growth for the chained players even in the smaller cities.
Comparison of QSR players (see figures) shows that the Indian players operate currently operate at 30-50% of their global counterparts. Domino’s India operates at 70-120% sales throughput of developed regions like Australia, Japan and Europe and believe that the chained players can get closer to the global throughput in the long-term.
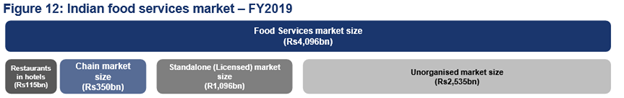
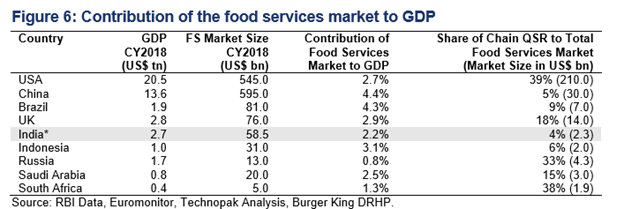
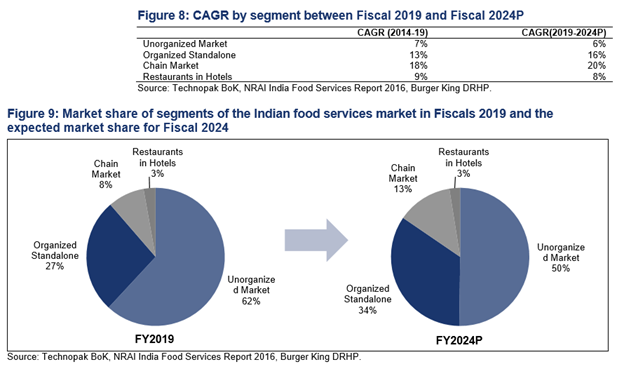
India’s food service market at USD59bn constitutes 2.2% of GDP, a significant level when compared to other countries. However, more than 62% of this is unorganized market. Share of chained outlets (8%) and organized standalone outlets (27%) still remains low.
The share of chained QSR within the overall food service, at 4%, lags significantly as compared to the other countries globally.
Outperformance of chained market in India will be driven by category formalization, store network expansion by chained players and rising consumer preference for new cuisines and branded offerings.
Chained players within food service are likely to grow the fastest, at 20% over FY19-24, driven by increasing presence and rising preference of consumers to shift to branded players.
The per capita spend by an Indian is much lower than other countries, both developed and developing.
The gap remains significant even if we compare the per capita spend in the top-8 cities (Delhi, Mumbai, Kolkata, Chennai, Bangalore, Hyderabad, Pune and Ahmedabad) versus other countries.
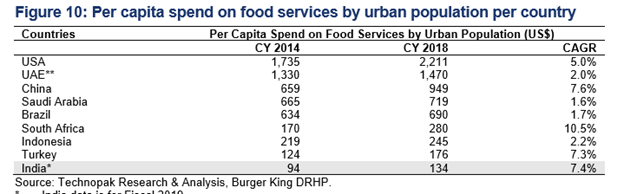
The top-8 cities in India together constitute 42% of the overall food service market. However, these cities contribute 87% of the total chained market in India – signifying huge opportunity for the QSR players to expand into the smaller cities.
Process Design:
Burger King has over 200 restaurants across 50 cities in India at present, which is far behind the more than 400 stores of rival McDonald, but with strategic investment and improvement in supply chain, the former aims to narrow down the gap.
Burger King’s process builds on a customized, made-to-order process. Rather than stock finished goods in inventory, Burger King produces and stocks standard components in a steam table and prepares the ingredients in a non-finished process. Then employees assemble the semi-products when customers place their orders. Burger King provides better, fresher food with this process, although the waiting time for the customer is comparatively longer than the made-to-stock process. Burger King should slightly change its process to stock some inventory for major products in peak times to reduce the waiting time.
Burger King has a machine called the Continuous Chain Broiler with a capacity of 8 burgers per chain, and it requires no human intervention. Patties are placed at one end, and after 80 seconds they come out the other end one-by-one. In the working station, Burger King only needs one worker to place the raw materials into the broiler and assemble them after the broiling process, and the worker could make 12 burgers (or 8 sandwiches) a time. The simple process implies that Burger King requires less staff than McDonalds. Burger King could generate 100 Whoppers and 200 burgers in an hour, which means the average cycle time is 12 seconds for a burger and 24 seconds for special sandwiches such as fish and chicken.
On the other hand, McDonalds cooks their hamburgers on grills, batching 12 patties per grill, and it requires human intervention to turn, sear, and pull the patties. This batching process favors the maketo-stock environment since it can produce a lot of product in a little amount of time. Cycle time for McDonalds is 100 seconds for a batch of 12 patties, so 8.3 seconds per patty, faster than Burger King. McDonalds’ idea was to serve uniformly high-quality food that was delivered quickly and in a clean atmosphere. The emphasis was on quick order times, in contrast to Burger King’s emphasis on fresh, custom-order foods. Both companies traded either time for quality or quality for time.
Burger King’s menu is best known for its flame-grilled cooking process, which results in better tasting burgers. Instead of developing a more creative menu or new burger flavors, Burger King prefers to maintain its menu by focusing on its core products, such as their flagship Whopper sandwich. Their products were also designed for bigger patties, thus their major customers are mostly teenagers and males. With the fast spreading concept of eating healthier, people are starting to care about a healthier diet. Burger King intends to broaden its products to meet this demand by launching expanding product platforms and introducing 21 new or improved menu items in 2012. However, compared with McDonalds’s menu, Burger King’s menu still does not provide as abundant choices as McDonalds.
Burger King applies special wrappers to maintain foods’ quality and freshness and to mark a number to show how long the food is being made. The pictures on the wrappers also represent the special recipes for special order customers. It could better prevent people who work at the counter from giving the wrong orders and having customers receive the wrong burgers. At McDonalds order-takers made note of special orders on a slip of paper and handed to the grill workers who then kept it under the bun top to identify it. Because of the extra time for additional requirements, consumers would be told to step aside while counter workers helped the next customers. This was also the process for regular sandwiches when a regular sandwich was not ready.
Burger King uses a microwave in its production process to keep food fresh and warm whereas McDonalds serves fresh burgers off the grill and stores them in a bin. At McDonalds, if the food is not served within 10 minutes, the food is discarded. Microwaving may affect the freshness and taste of the Burger King burger, and thus the quality of their burgers may deteriorate compared to McDonalds. However, because of this process, Burger King only presents 0.4% waste while McDonalds spends 1.9% more. Also, food wastage leads to paper wastage for McDonalds. McDonalds spends 0.9% more on paper wastage compared to Burger King.
Burger King receives supplies once a week, and the raw materials are ready to use. Burger King stores require a 2 hour preparation time before opening for the food and machine set up and 1.5 hours for cleaning after the restaurants close. McDonalds stores also receive one delivery per week from local suppliers of milk and buns. All food arrives ready to use. However, both opening and closing the store takes about an hour resulting in less setup and cleaning time than Burger King.
Burger King stocks inventory during the assembly as semi-finished goods on the “steam table,” and these goods are assembled after the customer places an order. Thus, the idle time for Burger King’s complete finished-goods are short, which means it could reduce the amount of discarded products. This has a financial advantage, because it is less costly to discard unused semi-finished goods since the total value of the product is not added together already. McDonald’s products are discarded as finished-goods inventory, so the total value is already added to the product, labor plus material costs.
At McDonalds the production area and the counter/drive-thru could not see each other, so a bin manager was required to call for production, manage the flow of product into the bin, and keep the bins stocked and organized. The bin manager also wrapped products. The store manager could predict sales volume pretty accurately and stock the bin to about 50% -75% of what was expected to sell in the next 10minute period. The manager could judge pretty well by experience and through the past few weeks’ data how much inventory was needed for the time and day of the week, noting any special events, the time of the year and the weather. Any product not used after 10 minutes was discarded.
While McDonald’s strategy is to put more emphasis on women and older group by offering healthier salads and upgraded its already good coffee, Burger King continued to market to young men offering high calorie burgers and advertisement featuring dancing chickens and a “creepy looking” king.
As the sun dawns, Varnan casts a glance on the army of employees scurrying around the office, pondering over what new offers should they bring to the table to win the customers who at the moment are loyal to McDonalds or KFC.
Competitive Advantage
Attractive entry-level pricing, a more comprehensive vegetarian menu than meal choices offered by peers in the global quick-service restaurant market and opening stores in crowded area (near metro station) than opening in Mall like competitors are well calculated competitive strategy from Burger King.
-
Store Location
The company took some time between opening new outlets to understand the consumer responses and tweak the strategies to make them more consumers’ centric.
While the Burger King India restaurants are spread over 2,500 to 3,000 square feet, Varman said the company has up smaller restaurants over 300-400 square feet in the Metro stations in Mumbai and New Delhi and now exploring such stores in Hyderabad as well. It also has stores in airports in Hyderabad, Mumbai and Kochi and in highways in Punjab which too will be expanded. Although Burger King tried to open its stores next to McDonald’s, its overall reach is very less as of now. Also, Westlife Development will accelerate its store opening rate to 40-45 a year from FY20 going forward, which is line with the strategy of KFC and Burger King in India. Rather than competition , it will work as complement rather than competition and will increase the pie. -
Localization of Menu
Burger King also found its groove with its menu approach, with a more robust vegetarian menu than its competition, including Starbucks. There are eight vegetarian items on the menu, for example, like the Crispy Veg Supreme and the Paneer King. Nearly 38% of India’s population is vegetarian, the highest rate of vegetarian consumers in the world. “India is a very different market compared to anywhere else in the world in terms of the country’s taste palate and unique vegetarian preference. Over 50% of the population here is vegetarian, so we couldn’t take the international menu and apply it here. It had to be completely redesigned.“Then we had to adapt our supply chain to be able to manage that level of complexity, because although it offers unparalleled variety to the consumer, it also has to offer consistency in taste and quality.” -
Pricing Plan
The average price, both before and after promotions, was the lowest at Burger King compared with Domino’s and Pizza Hut between February and June this year, according to a UBS report. -
Supply-Side Economies of Scale and Scope; (Cluster Approach)
The calculative move to invest in brand building and address the supply chain and operational inefficiencies is in line with the company’s growing interest in Indian market.Optimistic about the company’s growth, Sandeep Dey, Chief Supply Chain Officer at Burger King India, says that the brand’s franchise growth has offered more opportunities than challenges. “Our overall business philosophy has always been to grow deeper rather than grow wider; to strengthen our existing markets rather than entering new cities,” explains Dey. “That philosophy is actually helping us to leverage the supply chain cost and make it much more efficient.“When we open a new store in a new city, the initial distribution cost is slightly higher, because we are not utilizing the full potential of the warehouses and delivery trucks, for example,” Dey says.“However, when we open five or six stores in that region, the overall distribution cost will go down significantly and the stores will start becoming much more profitable. Therefore, scalability is driving profitability and vice versa.” The company purchases its ingredients and packaging materials through a single third-party distributor which in turn procures from its approved suppliers. The company claims this arrangement gives it access to third-party distributor’s multiple warehousing space and extensive logistics network, which supports its cluster approach and penetration strategy in a cost effective manner. The third-party distributor is ColdEx which is present in 210 cities and has a fleet size of 594 vehicles with 5 distribution centers. Chain restaurants can create distribution networks and systems that take advantage of supply side economies of scale. Has its own distribution cooperative which is, Restaurant Services Inc. (RSI), that manage and act as the purchasing agent for the Burger King system in the U.S… This ensures items move smoothly and efficiently from suppliers through regional distribution centers and each restaurant across the country. BK has a long term exclusive contracts with other strong brand names which was Coco Cola and with Dr. Pepper/Seven-Up, to purchase soft drinks for its restaurant.BK reduce its costs and boost efficiency by installing point-of-sale cash register system and flexible batch broiler to maximize cooking flexibility and facilitate a broader menu selection while reducing energy cost. -
Demand-side Economies of Scale (Network Effects);
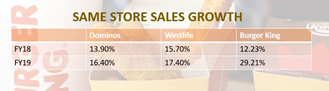
About demand-side economics nothing much to say apart from a few quantific measures like SSGF growth 12%. Sales per store 4cr highest next to MacD. -
Cost Leadership
By optimizing the company’s distribution cost and leveraging shared services and infrastructure, Dey and his team are driving down transportation costs. Combined with the company’s relevant brand and flexibility in its supply chain, this has proven to be a recipe for success.“Our supply chain has played a tremendous role in helping set up Burger King as a brand in the Indian market,” asserts Dey. “To be able to find high-quality vendors who can deliver consistent quality at competitive costs has been challenging and a lot of effort has gone into the supply chain to ensure we can deliver our complex menu, but I think that has been the real trick which has helped us succeed in this market. We have developed a strong back end that can support our diverse, complex menu and which can fulfil our consumers’ needs.”
Profitability
( Don’t have much data to calculate sales/sqft , ROIC etc operational matrix will do later)
The restaurants are profitable, at the company level the business has become positive in earnings before interest, tax, depreciation and amortization (EBITDA) in 2018-19.
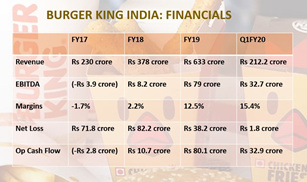
On a per-store basis, both Starbucks and Burger King posted average sales of Rs 3 crore, lower than rival Westlife Development which runs McDonald’s in the South and West and had average sales of Rs 4 crore at each outlet. India has been the fastest-growing market in terms of store expansion for both chains — Burger King had 129 stores while Starbucks had 116 outlets until March this year.
Burger King, however, notched up higher numbers than Jubilant Food-Works (JFL), where average sales per outlet were at Rs 2.6 crore from both Domino’s Pizza and Dunkin’ Donuts.
Peer Comparison
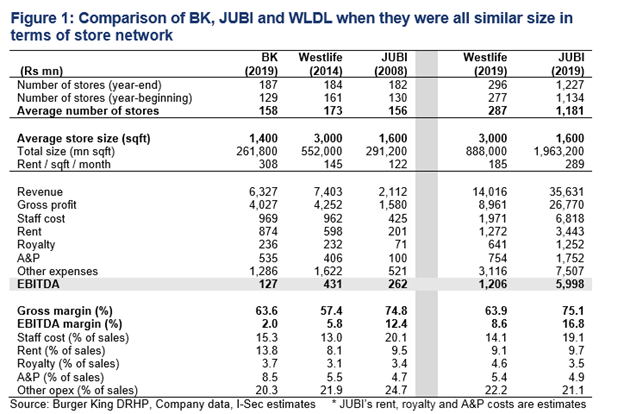
Considering Store economics at their similar stage like BK we have the below observation
Westlife has better sales throughput than BK and JUBI also best EBITDA on a per store basis.
Westlife rentals are lowest due to long term lease while BKs rental cost is the highest due to late entry and specified location like Ariport Metro etc.
JUBI has the best gross margin [PIZA has better margin than Burger] followed by BK then WestLife.
BKs ad spent is the highest since they are late entrance .
-
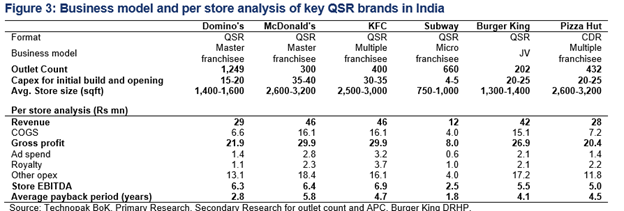
Throughput : Westlife’s restaurant throughput in 2014 was greater than BK. This has further grown at 3% CAGR over FY13-19 to reach Rs49mn per store. JUBI’s throughput in 2008 was just 34% of BK’s, but has improved to 75% by 2019. Pizza outlet structurally operates at a lower throughput than a burger or snacking player.
-
Gross margin : JUBI’s gross margin has been fairly stable since 2008 (+30bps in 11 years). Westlife, on the other hand, has improved its gross margin significantly to 64% in 2019, from 57% in 2014. Burger King already operates at 64% gross margin currently.
-
Employee costs : A key difference between the employee costs across the players. Both Westlife (2014) and Burger King’s staff cost were at 13-15% of sales, while, Domino’s, given its higher reliance on the delivery model, used to incur 20% staff cost in 2008. Even today, this gap remains with Domino’s at 19% while Westlife and BK at 14-15%.
-
Lease rentals : Westlife’s lease rentals are the lowest amongst the three. Even today, Westlife’s rentals average to Rs185 / sqft/ month which is much lower than c.Rs300 for both JUBI and BK. Westlife’s long-term rental contracts with 15% escalation every 5 years (every 3 years for other rental deals usually) gives it this edge over other QSR players.
-
Ad-spends : BK spends 8.5% of sales on advertising expense, the highest amongst the three (JUBI and Westlife at c.5%). This is due to being a late entrant in the QSR market.
-
Royalty : JUBI and BK have similar royalty rates (c.3.5% of sales). Westlife though already pays a higher rate (c.4.6%) and this is likely to increase to 9.6% by FY26.
-
EBTIDA : Westlife had the best EBITDA on a per store basis when the three companies had similar number of stores. This is driven by Westlife’s higher sales throughput more than offsetting the lower percentage margin (versus JUBI).
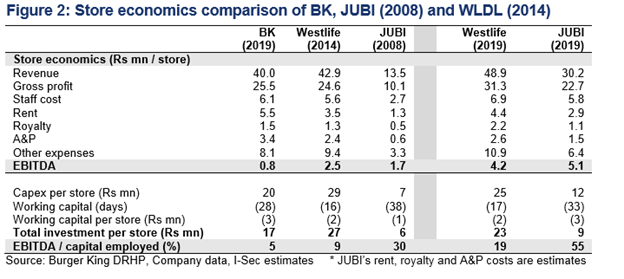
In India, the revenue per store is higher for burger and snack chains versus pizza chains due to (1) greater affordability (smaller ticket product) and (2) more snacking nature of burgers leading to better throughput.
However, better gross margins at Indian pizza chains help them deliver an overall higher store level EBITDA margin. This results in a very similar EBITDA per store operating metric, ranging from Rs5-7mn.
Subway is the clear outlier with Rs2.5mn of EBTIDA per store due to consumers’ cuisine preference led lower throughput.
Concerns :
Cannibalized its existing sales by putting too much emphasis on value meals, which they sell it in lower price compared to its production cost. Thus, causing them to lose money.
Some food items, for example Pizza Burger, contains 2530-calorie. This served as a concern as Americans opt for a more healthy living.
Legislation for unhealthy fast food threatens not only Burger King but the quick service restaurant as a whole. For example, a health reform bill passed by the U.S. Congress in 2010 required restaurant chains to list the calorie content of the menu.
Lack of product Innovations The “barbell” menu strategies that was introduced at both the premium and low-priced ends of the product continuum did not really help much in the growth of Burger King. Since fast food often associated with low price. Furthermore, the premium items need to be constantly advertised. Moreover, its menu development was deemed as horrible and too much emphasis was given on value meals which causes dissatisfaction among the franchisees. The growing concern of health and fitness in the U.S. as well as the passing of the health reformed bill in 2010 by the U.S. Congress is one of the most important issues to be taken into consideration for the quick service restaurant (QSR) including Burger King. Burger King should be flexible in its approach of product offerings but failed to do so by promoting and creating high calorie and unhealthy food items on the menu.
The industry’s supply chain is fragmented in nature and marked by the presence of multiple intermediaries. The lack of appropriate infrastructure, inadequate technologies, and the non-integration of the food value chain are factors key to the wastage of nearly 30-40% of prepared food across the supply chain. Maintaining a cost-effective supply chain is a prerogative with this industry, failing which, all other input would be useless. It is also necessary to establish a chain of supply in a new region. For outsourced products or those procured from third parties, it becomes important to constantly monitor the quality of such goods.
One observation though, the development obligation to reach 700 stores by CY2025 creates a risk for BK India in a situation where it does not get good locations / favorable terms or if there is a prolonged slowdown in consumption. Remember JUBI’s performance over FY13-17 where average SSSG was 0.6% due to significant demand slowdown but the company almost doubled its store count to 1,117 (Mar’17) from 576 (Mar’13). This had led to an EBITDA margin decline to 9.3% for FY17 from 17.1% in FY13.
Also since it is promoted by a PE firm like Everstone so this is a real concern for me, because most PE fund not likely to hold their investment for long. I don’t understand their strategy or motive behing doing so. Also need to know how this PE firm Everstone has done with their previous investments? If anybody can highlight this then it will be a lot of help.
Reference :-
