What EPS you have taken, as per your calculation its 7.6.
In Dec qtr EPS was 9.
They will not be doing any major capex, further with the order book from Saudi joint venture, US, monetization of scrap from Shipyard with min fixed cost, Sintex sales coming on line. There will be growth from q3 onwards. Q1 and Q2 expected to be muted but will be still better than YOY.
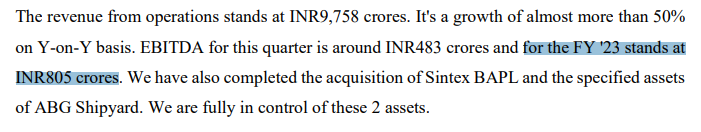
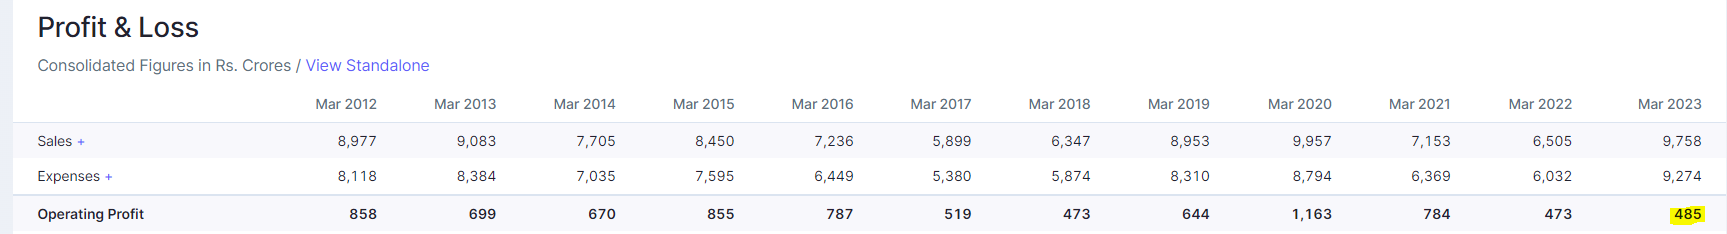
They have guided about 15000 cr top line against 9700 cr in Fy23 and EBIDTA of 1500 cr.
3 Likes
@ cathene
There is some dichotomy in your posting. You have written that in fy 2023 they have delivered more than 1 Mt in line pipe. Their topline was 9700 cr. You have also mentioned that current order book in line pipe is 1.1 my valued at 14600cr. How is it possible? Pl clarify/rectify.
@phreakv6
Generally what kind of strategy do you follow when making a trading bet on a particular position ?
Do you make a limited capital in a particular story and keep increasing and decreasing as the story unfolds or quarter to quarter results basis of performance of the stock ?
So basically how can we minimize the losses in trading bets / positions and maximize return ?
What kind of thought process goes into selecting a set of stocks from universal set size available?
Your feedback on anything will be highly valuable.
And thanks in advance
3 Likes
@dinngap - The deleveraging i meant is in the future. The company is done with all capex and borrowings shouldn’t increase from here. I am trying to see what a 1500 Cr EBITDA can do to this company. Some cashflows are more valuable than the others - if the cash generated repays large debt, the next year PAT increases without the business doing anything (and in businesses like this, its the best deployment of cash) - Equity:Debt is skewed towards equity and market cap increases to the proportion the debt is reduced and interest coverage ratio improves as well
@r8b8 - Yes, I was valuing the business based on the FY24 guidance (forward earnings as you put it). These are awkward shortcuts but trying to be more precise I feel is futile when there are so many variables
@novice2014 - Maybe WSSL isn’t a bad bet either but am not sure about the valuations
@prabhat_mohanty - Topline and margins vary based on export mix. Current order book is export skewed in my limited understanding
@cathene - I think I wrote about the team approach in the last post. The key thing to note is that all members of the team aren’t equal and should never be treated as equals - that’s why you have a batting order in cricket. There’s no point having your best in form batsman coming in at #7. The same approach to me applies to allocations - The typical allocations are 18-20%, ~15%, 10-12% in my top 5-7. So these top 5-7 make up 80% of the portfolio at any point of time.
They seldom get to this allocation level at one go. I start at 3-5%. Nothing decides allocation more than valuation. I try not to allocate higher on momentum stocks (I dont average up, but there are rare exceptions, like HOEC where I added 2% more at 160 levels and 2% at 180 levels to a 12% position at 135 levels). I have a narrow valuation range to buy in and as long as stocks are in that range, I keep buying over few weeks. Since I don’t average up, it is important for me to buy the highest allocation possible when the valuation is still in favor -
For eg. I wanted to buy Spandana and Ugro in the beginning of May. Spandana opened gap up at 695 thowing it completely out of my buying range, so I was buying Ugro instead between 175-195 which was still in my valuation range. Ugro gave lot of opportunity to buy before running up - but then Spandana came into buying range (630-650 levels) - You have to know your valuations and never chase or average up. Buy cheap - that’s the only thing that can protect you when things go wrong
Top 5-7 never look at the same across quarters - mostly because they run up too much and better value emerges elsewhere. Only VBL survived Nov churn intact from my June consumption stocks - most were expensive and were sold to make way for Apar (initial at 1700, averaged down at a lot between 1400-1600 which was super juicy valuation), Shilchar, PML. VBL was sold between 1500-1700 to make way for HOEC at 135 (I still have ~3% left from a initial 20% in VBL which I might hold for long)
There’s no fixed rules to it. These are all bets and you have to manage your portfolio of bets to make sure your allocations are geared for best returns at portfolio level. I see companies as engines spinning at a set RPM - unless you are in the right gear, your linear displacement wont be big - 6000 RPM at 1st gear vs 8th gear is a world of a difference in displacement (3% allocation vs 18% allocation for a stock doubling in 6 months in our terms)
As far as universe goes - cheapness and strong chart are the starting criteria. Growth comes next - this is where there’s lot of possibility to get wrong because cheapness and strong chart are verifiable and in the past/present whereas growth is in the future. If you get the cheapness and strong chart right from the selection universe, getting growth wrong doesn’t hurt a lot because you aren’t overpaying to start with - at worst you will have to swallow your pride and cut your position size which is alright with me
Disc: I have traded in most of the stocks mentioned and it isn’t advice to buy or sell. Borrowed conviction on process probably is exponentially worse than borrowed conviction on stocks - so please use this just to think / ruminate on alternate approaches for yourself
62 Likes
Hi @phreakv6 - Thanks for sharing your views generously. It will be great to hear more about judging ‘cheapness’. Please do so at your convenience.
1 Like
This kind of insight was what I was actually looking for. And thank you for sharing. If I could only double like what you posted
Great work and keep contributing as always
8 Likes
You guys are very kind but asking the most difficult questions. They are difficult because I don’t think about these things in depth until the questions come up. Some of these like valuation have become second nature and I go by the intuition, so when I have to describe, I have to summon my intellectual mind to put it in words and there are invariably going to be gaps
I read Damodaran on valuation early on in '17 or '18 and I dont think there exists a better book on the subject. People hate him thinking he is all DCF but he is a lot more than that. He forces you to understand the business - the narrative behind the moving parts of the business, its operations, unit economics, capital structure, the competetion, the business cycle etc. If you don’t understand this at an intuitive level, your valuation is going to be way off
You have to somehow get an intuitive sense of how to value cash flows - starting with getting an intuitive understanding of discounting. Understanding time value of money and risk is the first step before you do anything else. Once you do, play around with how an annuity is valued differently from a growing annuity or a perpetuity - again formulas are only shortcuts - you have to get the intuition behind them
A lot of the businesses are treadmill businesses and don’t create tangible value. These businesses are better bought at a discount to book value and sold at 2x book (to me almost all cyclicals fall in this bucket - cement, sugar, textiles, steel, shipping, most financial institutions). There are some you go by replacement cost. Some based on historic P/B multiples. A lot of old mature business in sunset industries that dont have reinvestment opportunities and pay out dividends have to be valued like bonds
Very, very few businesses are franchises and can expand their franchise and have a defensible moat and sustainable margins. These have to be valued as growing annuities and when you discount these less (say 12% instead of 15%) and they grow at a 20% for a prolonged period of time (assumption will vary for each individual depending on their conservativeness) - you will see the wide variations in P/E (based on current year’s earnings) each person will be willing to pay. You will understand a 60x P/E from a 20x P/E and the growth, longevity, margin sustainability and stability they imply
All this is still just assuming there’s some rationality to the proceedings. Often, especially in the short term the market is a voting machine, than a weighing machine. So you may come up with a fair value of x but the price could trade anywhere from 0.5x to 2x and this in itself is a 4x in terms of price range with the business doing absolutely nothing different.
I firmly believe that calling this irrational is incorrect - it is absolutely rational of someone to value staying up to sleeping early (simplest form of discounting we do everyday). We should only observe what market participants think as rational for themselves based on personal preferences without passing judgement (understanding market psychology can give you an edge). Sometimes market can seem to be irrational due to cognitive overload as well (complicated businesses dont get valued highly due to this reason)
We are taught to ignore this by books but it would be foolish to do so. Multibaggers are made when you buy something at 0.5x its fair value and sell it at 2x its fair value and in that period, the business grows its earnings 2-10 fold and worst losses are made when buying something at 2x fair value at the top of the earnings cycle. Read a lot about an industry and its competetive structure, profit pools, policies, moats, individual business journey (ARs, concalls), damodaran on valuation, ainslie on hyperbolic discounting and more importantly, think - there are no shortcuts
P.S. The tone of this post appears preachy as if I have it all figured out. Nothing can be further from the truth. Please note I am also learning these things by writing and thinking about them
74 Likes
“there are no shortcuts”, not withstanding, what would be your thoughts on the various valuation scores given on financial sites, including one’s own trading platform and other financial sites. Stupid question…maybe!
Compelling write-up.
Two things tempered my excitement:
1- Ambiguous EBITDA metric: Management update in ‘conf call’ and ‘investor communication’ emphasizes EBITDA. But, EBITDA of management’s update is self-defined: ‘EBITDA’ plus Other Income, which consists of items that are non-operational: Interest Income, Dividend Income, Investment Income etc.

2- Valuation on average (10Yr/7Yr/5Yr blocks) till FY21 were assigned at ~7x EV/EBITDA. In recent two years the multiple has reached to ~17, baking in the expected growth. In turn, possibility of 100% upside seems unlikely.
9 Likes
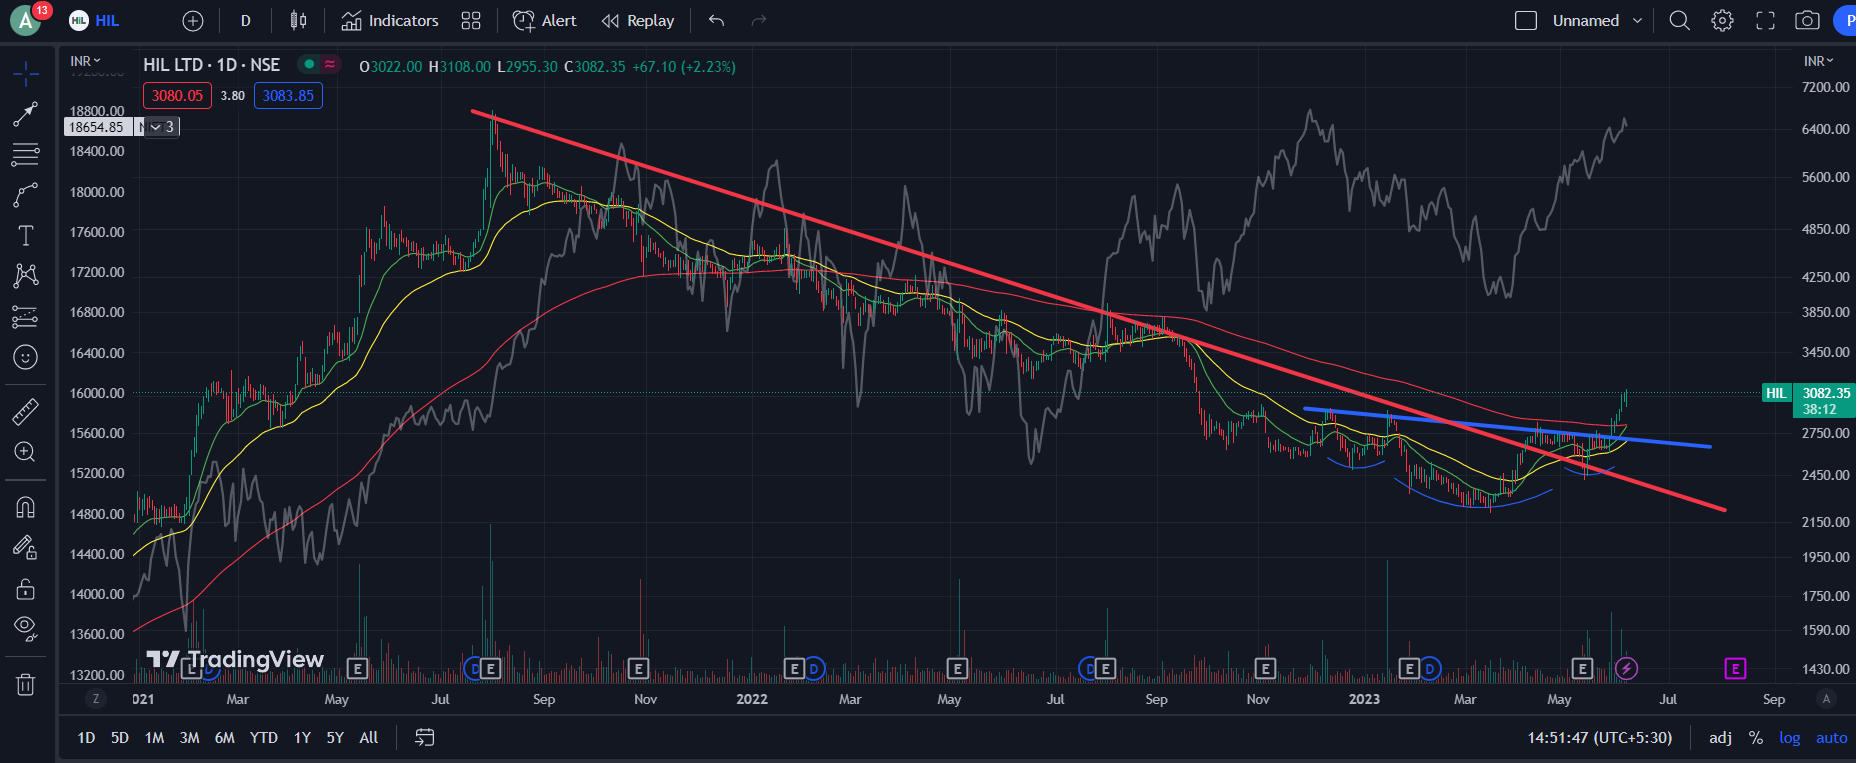
HIL Daily.
Technically, stock seems to have:
- Broken out of almost 22 months downtrend (red line)
- Bottom formation after ~66% correction and broken out of a ‘sort’ of Inverse H&S pattern (blue line)
- Moved above 200 D EMA on good volume.
Fundamentally, margin has probably bottomed and is likely to improve along with higher revenue as per my interpretation of management replies in concall. Company still maintains $1 billion revenue target in 2026. New CEO joined from CK Birla group company 5 months back.
Historically, stock seems to trend quite cleanly above 200 D EMA without whipsaws once uptrend resumes after big corrections.
Disc: Invested 3% at ~3000 levels. Looking to ramp up if company delivers on quarterly result and momentum builds up in stock price.
8 Likes
City Union Bank Ltd
Price Chart: Ongoing base formation ~120, acting as a support for the last 3 Yrs.
PB Chart: Currently PB at ~1.3, last seen 10 Yrs. back. PB below this level was seen during GFC period (2008-09)

Why cheap? Per my understanding:
- Ongoing negative perception (Main Reason):
- RBI’s NPA divergence rap in Dec 2022. Not only requires more provision to improve the PCR but also seeds doubt about the book quality and NPA recognition process.
- Acknowledgement about lack of documentation related to interest subvention schemes, leading to stoppage of interest recognition
- Managements acknowledgment for growth headwinds in FY24:
- Overall NIM compression in FY24 and nil growth in H1FY24. Expected overall growth of 10%+ - H2 to do the heavy lifting using NPA recovery as the key driver.
- Still elevated level of Net NPA plus Restructured Assets (5%+ %)
Key Monitorable: Trend of NPA’s recovery and growth pace of H2FY24 to achieve overall growth of 10%+ in the Net Profits
Valuation: Cheap or will it become cheaper? Current valuation at 1.7Sigma below mean.
| PB | ||||||||||
|---|---|---|---|---|---|---|---|---|---|---|
| Max | 10 Yr | 5 Yr | 3 Yr | 1 Yr | Now | Mean | std. dev. | |||
| CITY UNION BANK LIMITED | 2.1 | 2.4 | 2.2 | 1.9 | 1.8 | 1.25 | 1.94 | 0.40 |
Downside: Already reached, I think, as at historic low on P/B chart | Only other low point on the PB chart belongs to GFC (2008-09) days
Upside Expectation: At least 70% in 1~2 Yrs
Shareholding pattern change: Dec2022 to Mar2023: Insurance companies sold 3% and MFs sold 0.5% | FPI bought 3.6%
Disclosure: Invested at current levels. Not a registered advisor and it’s not a recommendation. Shared to hear counterviews in particular. As I am often wrong in my conclusions, you better make decision as per your due diligence!!!
9 Likes
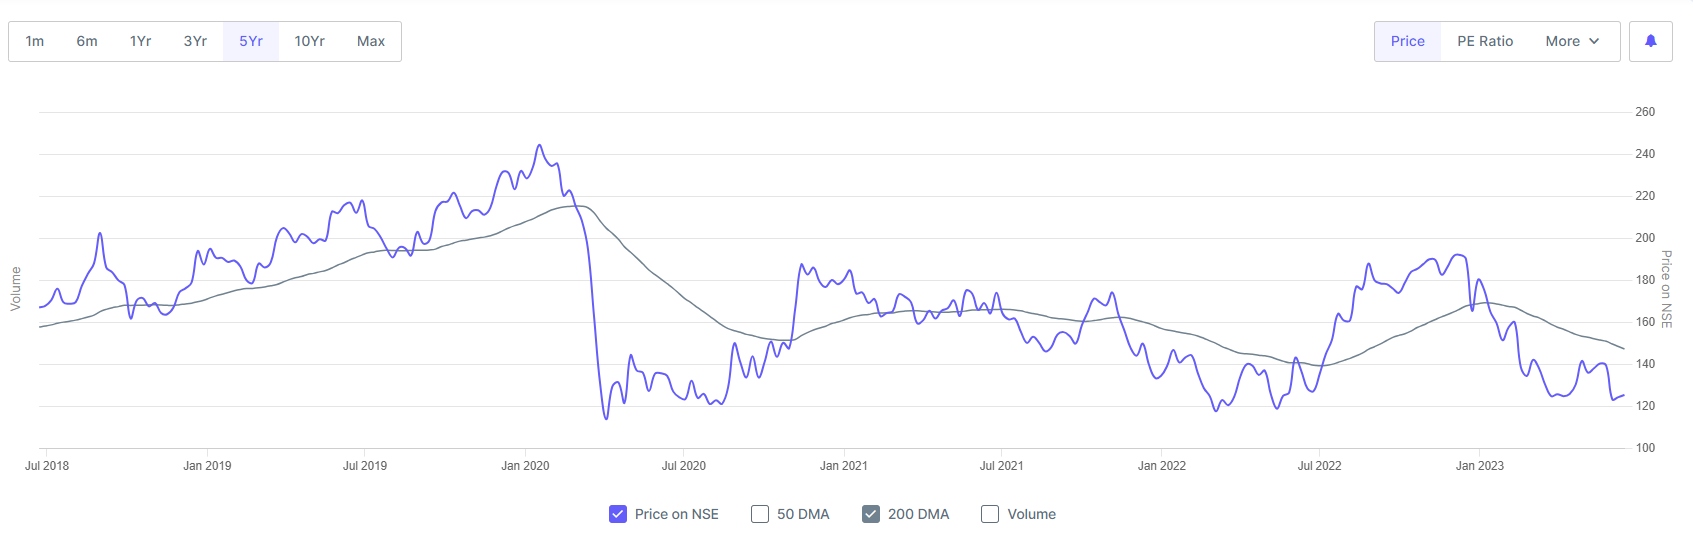
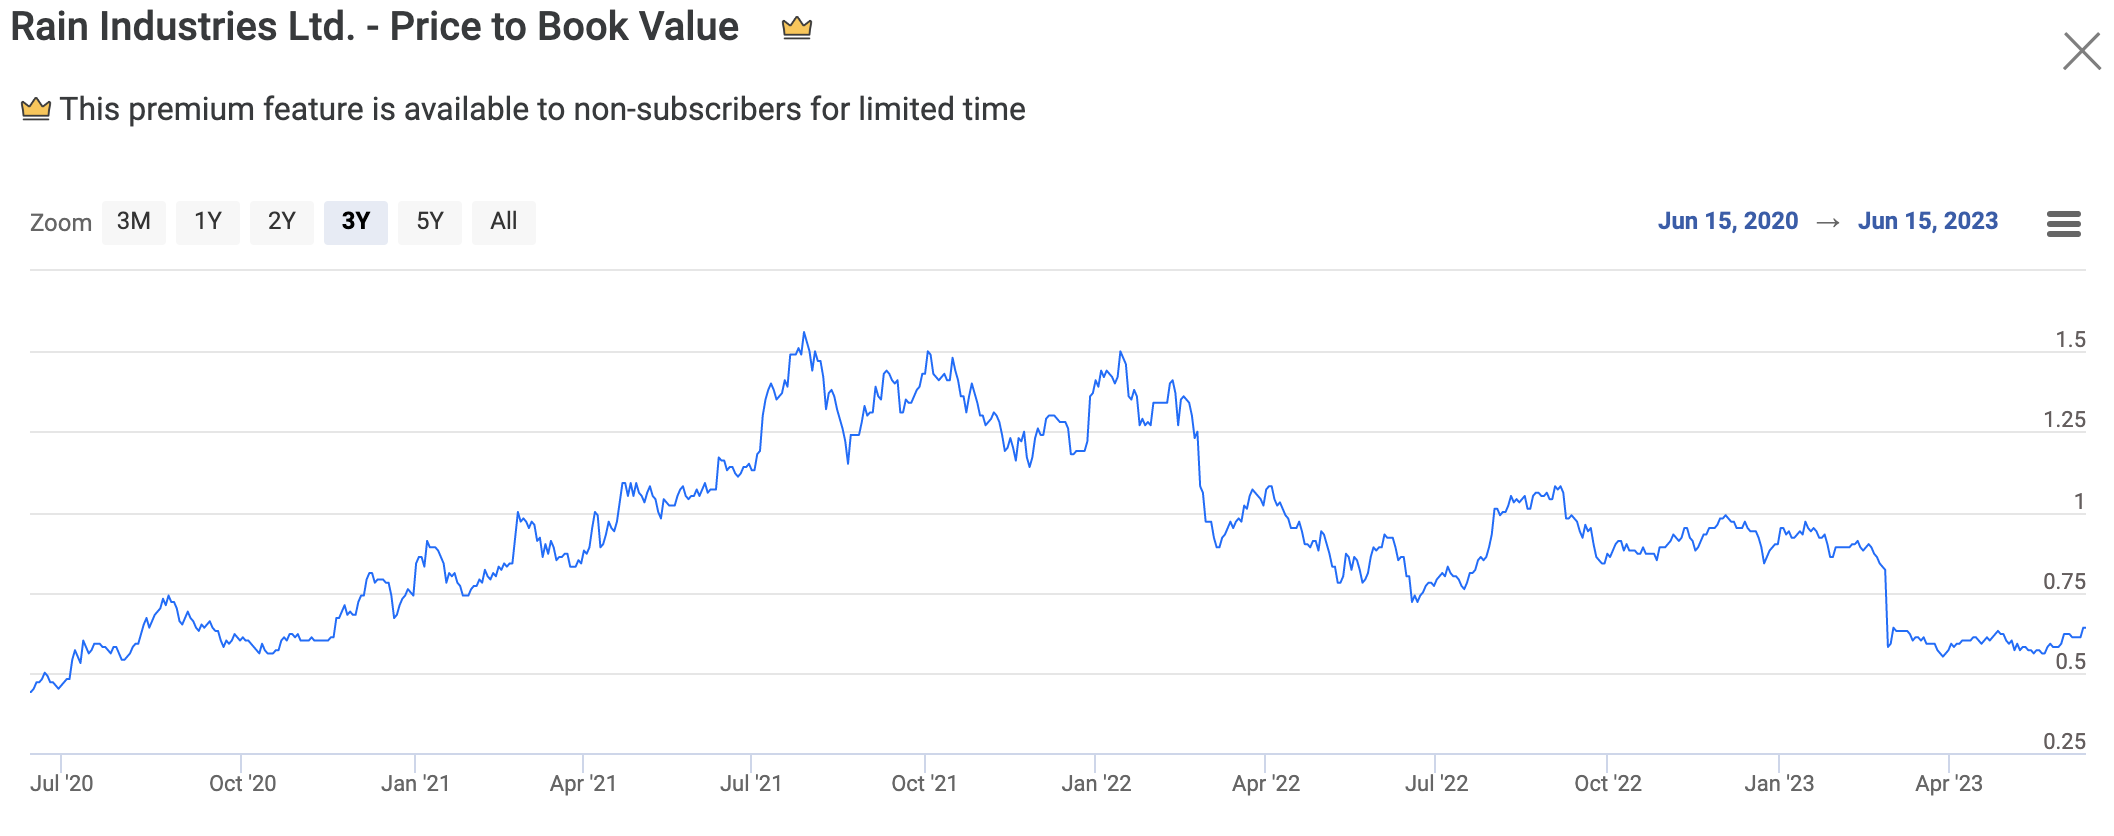
Rain Industries
Hello folks, this is my first attempt at writing a post on Technical analysis in VP forum.
Experienced VPers please correct me if I’m interpreting anything wrongly. TIA ![]()
Rain Industries seemed to have broken a 5-year bearish trendline on a weekly chart with decent volumes, along with a double bottom near the 200DMA level.

P/B is also at historically low levels ~0.6 reducing the downside risk.
Expecting it to reach 190-200 levels during first leg of rally based on previous swing highs.
Disc. Invested around 160 level
12 Likes
Hi @Surender , shouldn’t we use ABV for PB calculation instead of using BV?
Few questions:-
-
For a small bank which aspires to grow at 10-15%. Aren’t the growth rates too less? When icici and HDFC are showing superior growth rates. Sharing this I have seen someone close to me being trapped in DCB, where growth rates were inferior to HDFC Bank.
-
Too much regional concentration along with lack of investments to go PAN India and to launch new products beyond MSME landscape.
-
As per my understanding- Banks have been aggressive in 30-50Lakh ATS for MSME’s vs 1-10 lakhs for the likes of 5 STAR or Equitas. As the latter is much more opex intensive (60%+ C/I) and banks havent entered TIER 3-4. Whereas, CUB in places where it lends, is exposed to competition. Which reflects in inferior growth rates, regional concentration and the Bank still isn’t out of COVID.
-
Operational and asset quality performance has been substandard post covid… In other banks like Indusind or even a South Indian bank at least on asset quality a turnaround has been seen.
Thus, why own this when other financials are growing at 25-30%+ and offering better asset quality. And Valuation wise aren’t absurd+ Don’t have any overhang of Divergence as per RBI?
Disc: Biased in Equitas and SIB. Did take a look at CUB. Want to understand the thought process better ![]()
![]()
No reco to buy or sell. Open to change my mind.
17 Likes
Gents - Thanks for your note. It made me to think.
In my view, no need to adjust the BV with net NPAs.
- Adjustment happens for all the periods and conclusion will not change.
- Net NPA write-offs will be absorbed by PCR, if anticipated and provisioned well.
Lower growth is due to:
- Self-imposed lower loan approval % threshold: This was set during COVID phase and continues till date. Before opening this, management wants to refine their processes after RBI’s knock.
- Limited products: Always worked with a foundational belief that loans shall be extended only for creation and not consumption. However, management agrees that this needs to change with changing times.
Asset quality shall improve from current year. Management mentioned that recoveries and lower provisions will be a key lever for this year’s growth.
Business concentration in one geography for 100+ years makes it terrain lifer, a key lever to either accelerate growth rates or ward-off competition.
My thesis is to benefit from reversal to mean.
3 Likes
Thanks for the detailed analysis with images. Can you please tell the 'guidance and order book images are taken from which website?
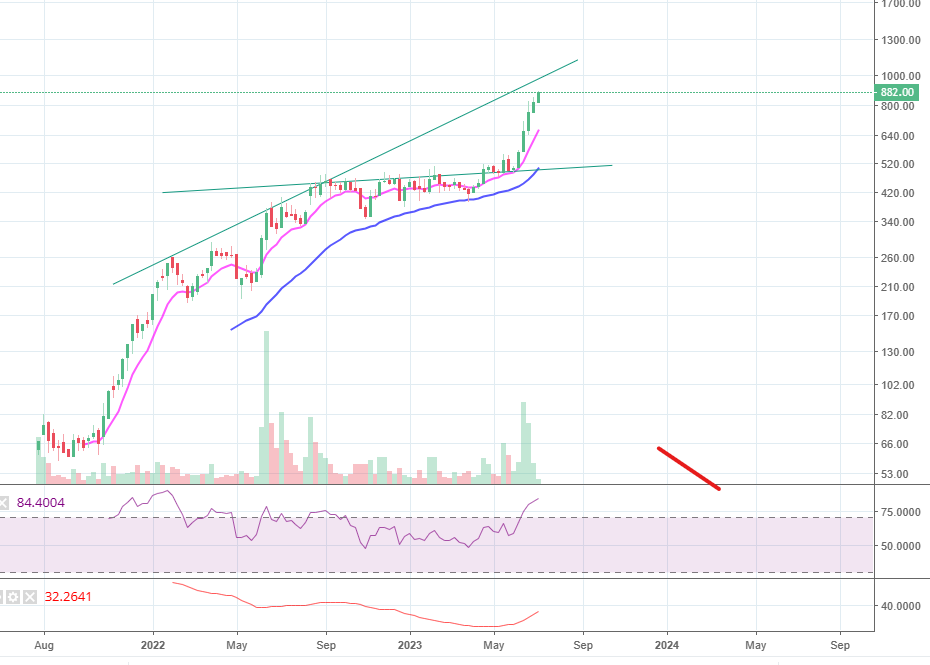
No recommendation for a buy or sell but when I study this, I am assuming 975 is the next resistance level for KPI Green. Weekly Chart attached
3 Likes
Stock has performed exceptionally well these past few months but is corporate integrity an issue one needs to worry about?
This is a try on technical analysis for my novice eye.
Fredun Pharma a small cap , made a triple bottom at around ~780 range and then had a breakout today hitting the UC along with closing above 200 DMA. The current ~Rs 1000 range is close to previous resistance and if it crosses it can go much kore.
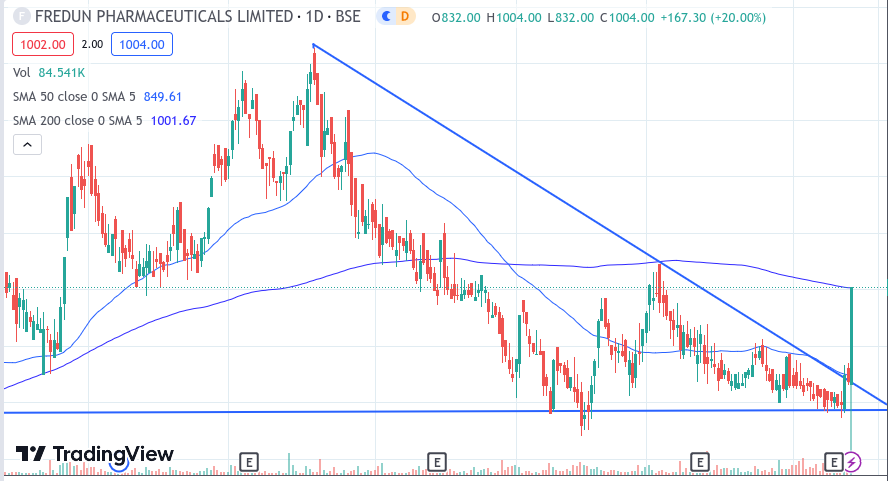
Disc: I am a novice at TA and investing, take my views with lot of salt. Invested just 1.5% of PF as a trading bet.
5 Likes
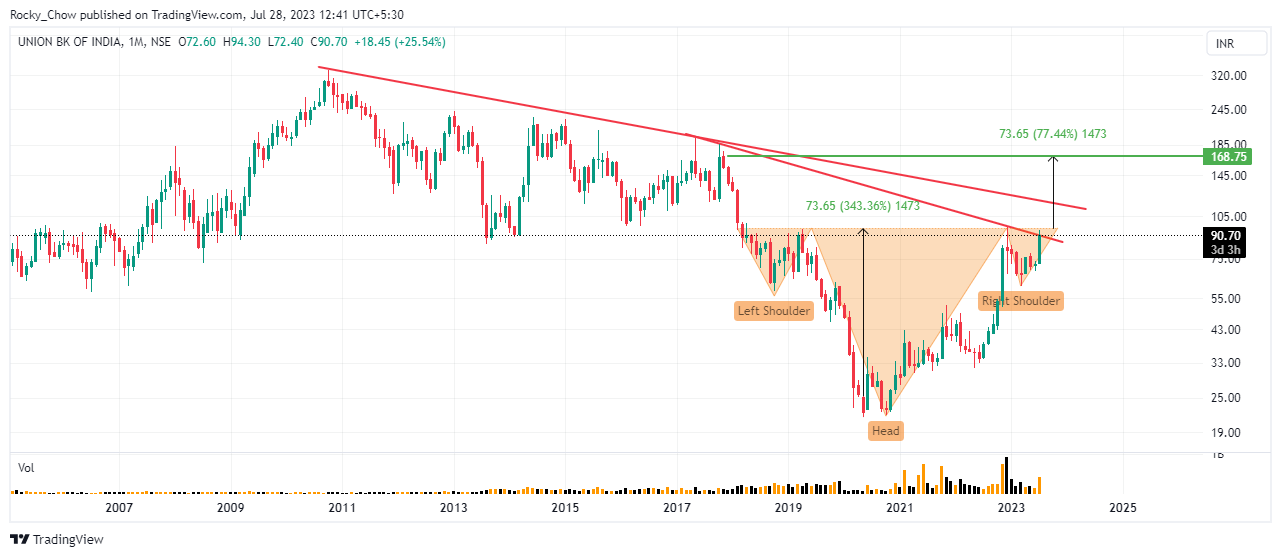
An early alert on the monthly chart of Union Bank of India … looks like an Inverse Head and Shoulder formation taking place which can indicate change in trend… there are some downward resistance lines coming up which are marked in red and price is at a crucial reversal zone… the results of Q1 showed up positive financing margins which is indicating improving fundamentals…
Diclosure: I have entered early here without INHS BO confirmation keeping 78 as a stoploss on wcb…
6 Likes