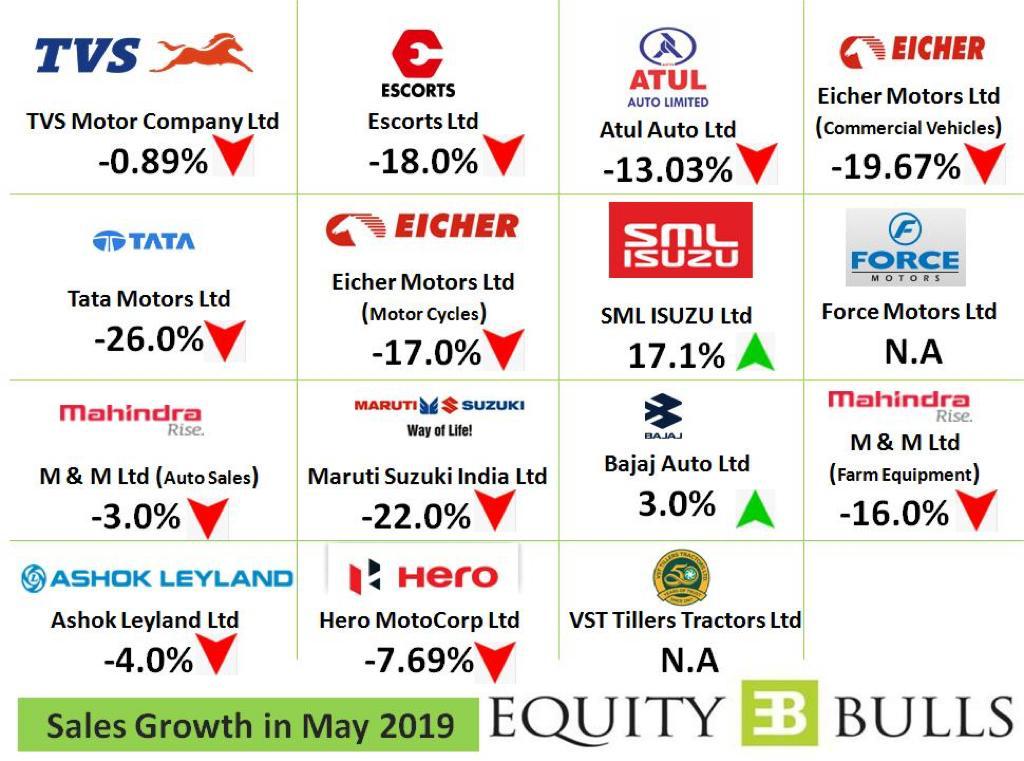
TVS Motors - Looks poised for a breakout on the monthly.
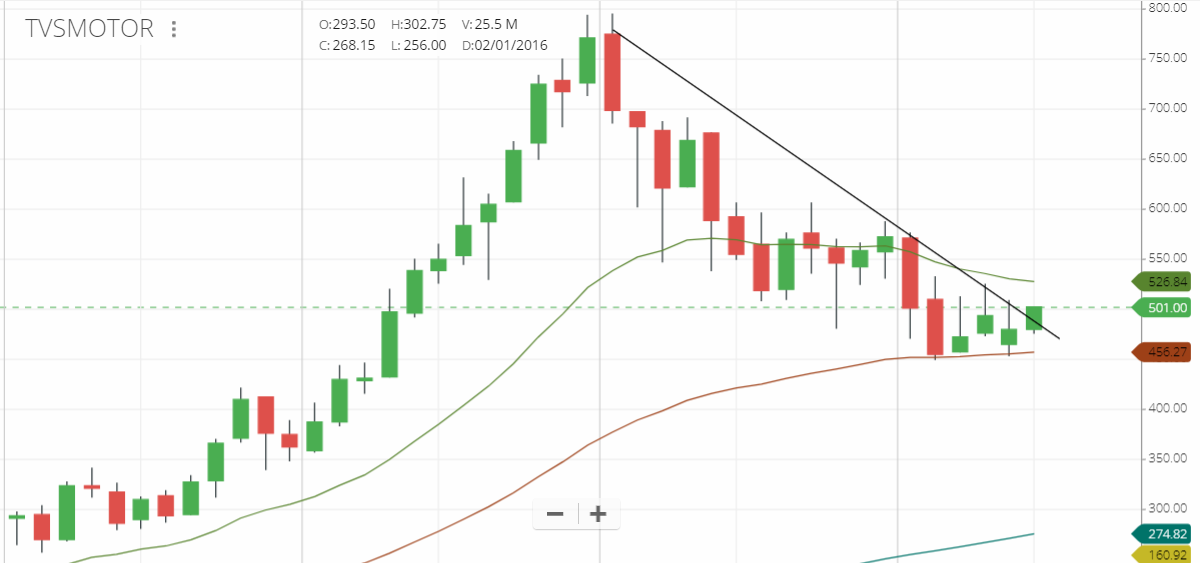
They appear to have bucked the big auto slowdown as well, so breakout looks likely I think.
TVS Motors - Looks poised for a breakout on the monthly.
They appear to have bucked the big auto slowdown as well, so breakout looks likely I think.
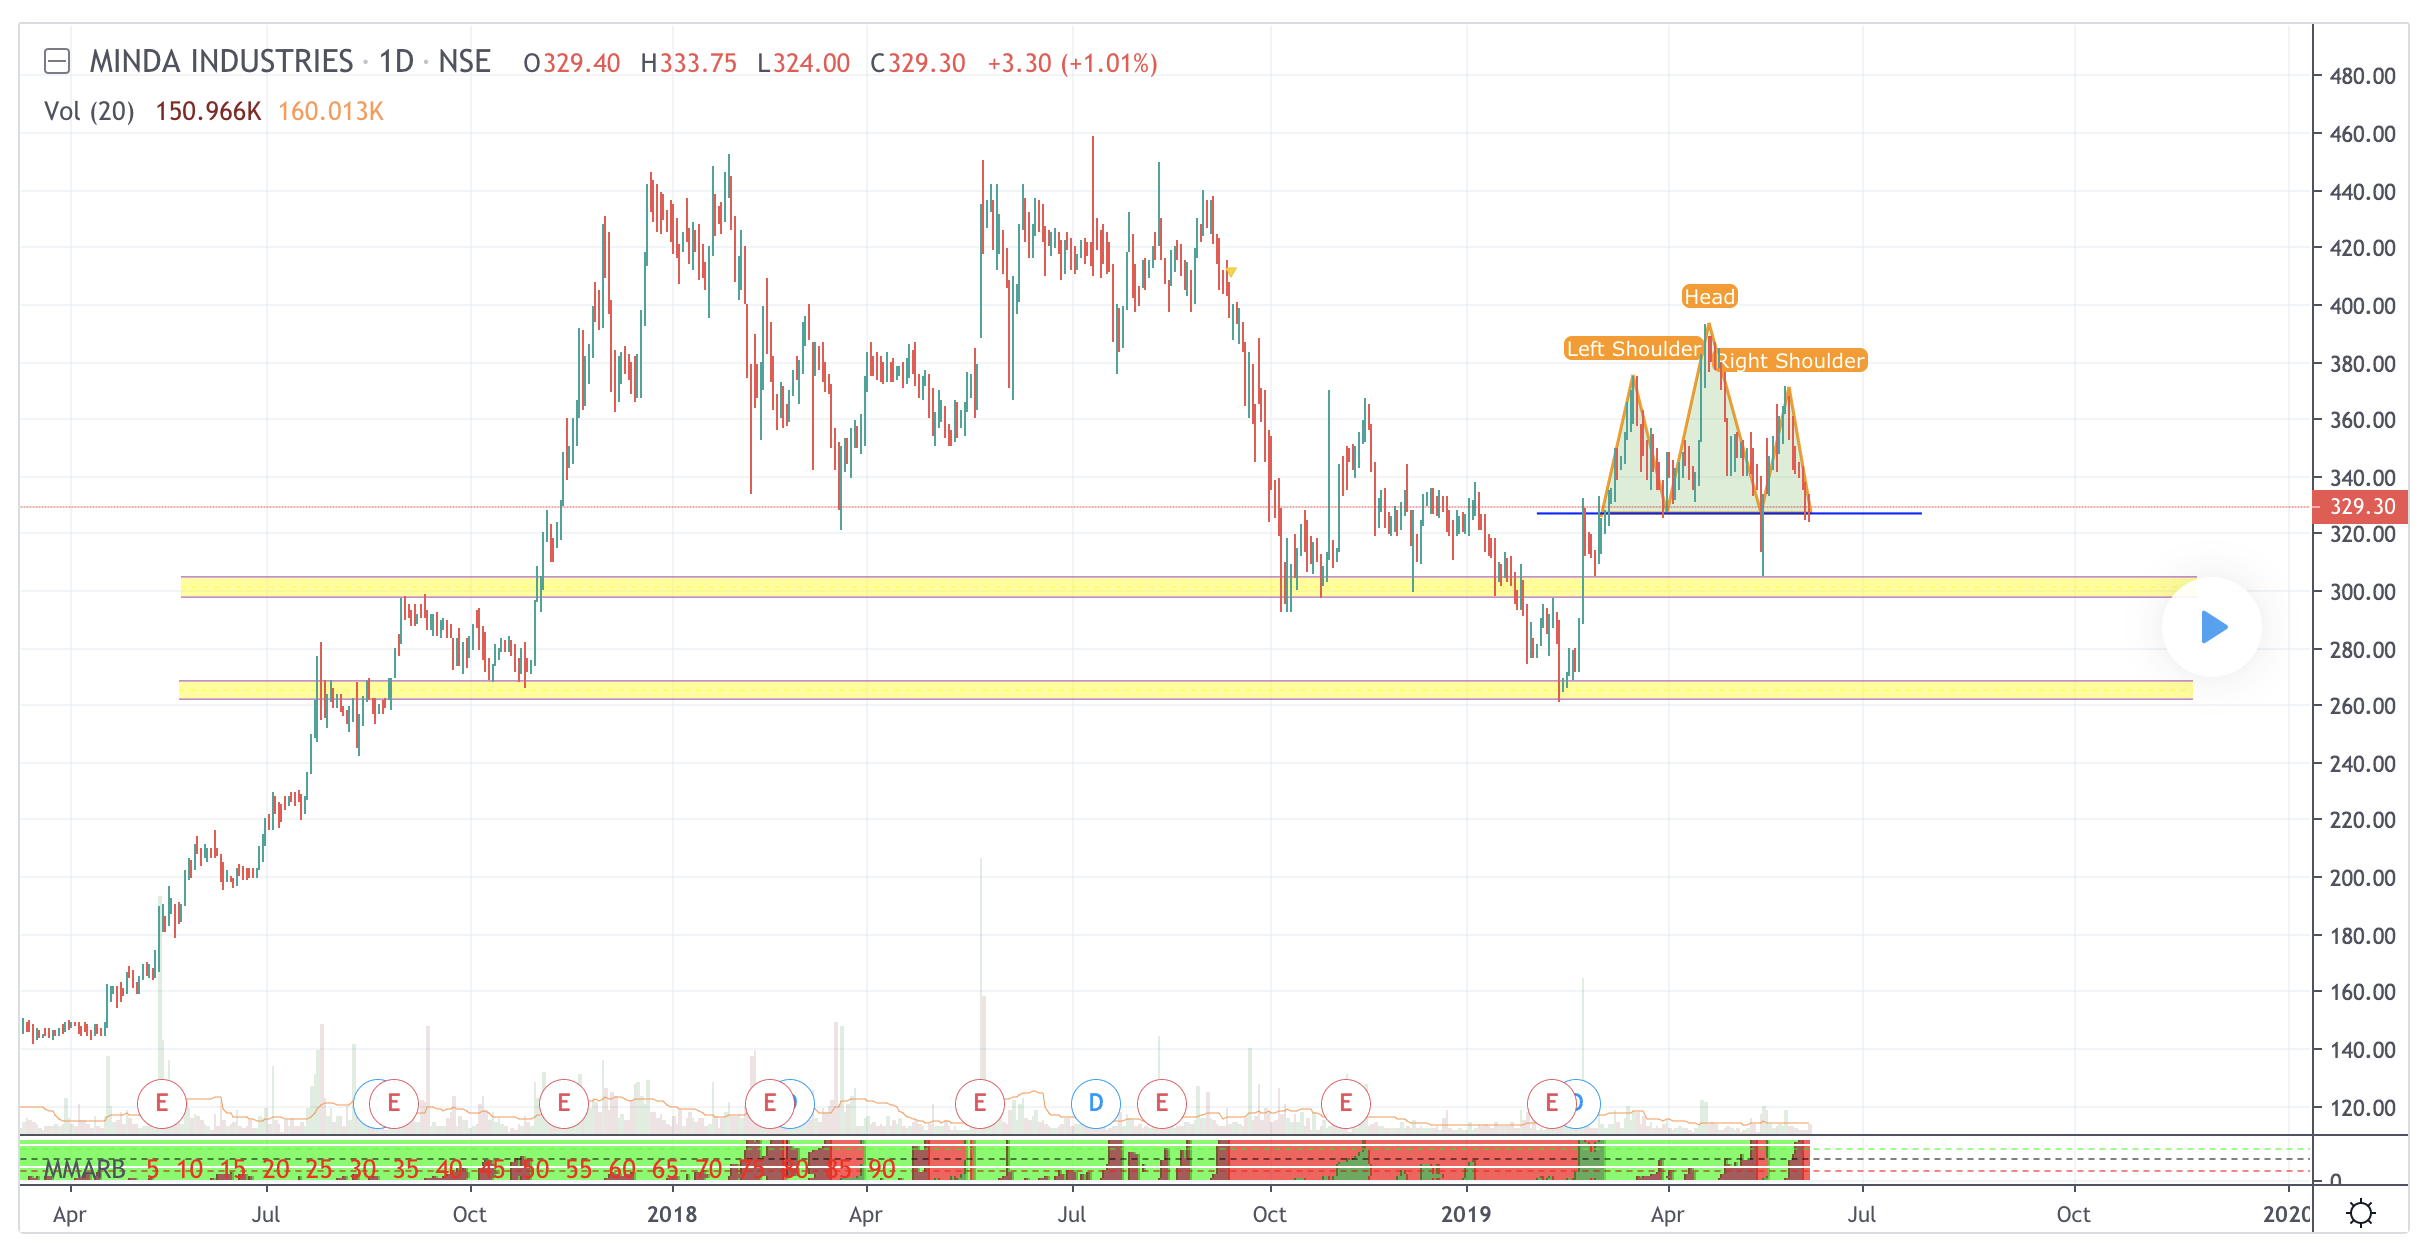
any views on Minda Industries chart. Sluggish performance due to auto slowdown I guess
Minda Industries exactly sitting on the neckline. Any bounce would invalidated the H&S, the breakdown can test recent lows.
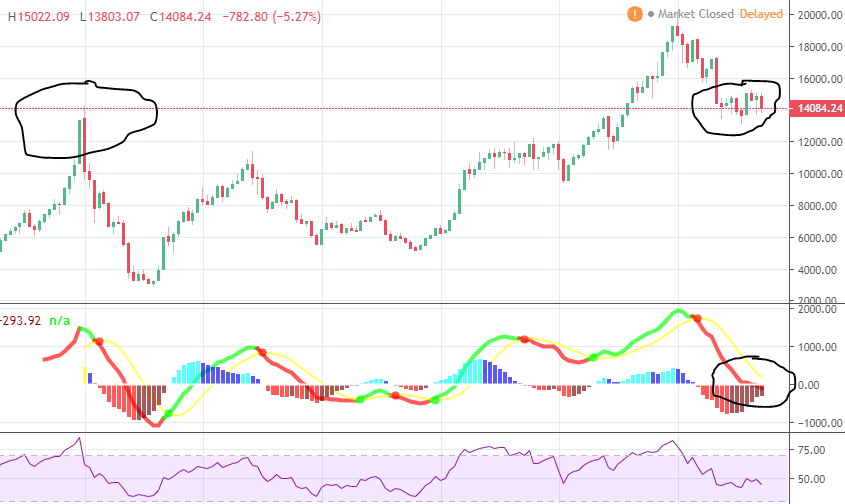
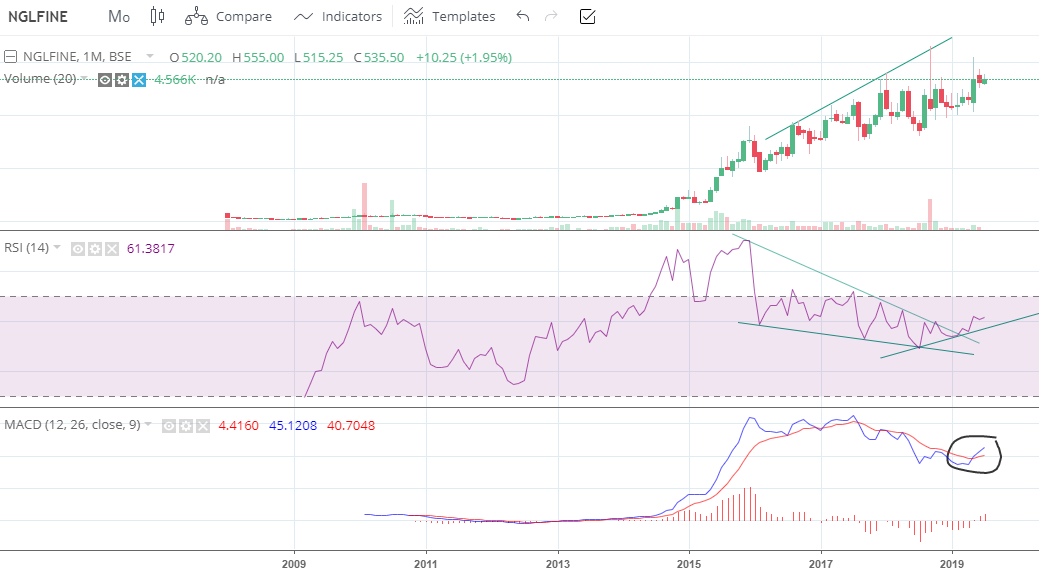
Have been holding Lupin , Glen and Star for long now. Previous assumed bottoms collapsed. Pharma itself may be in some trouble in US on accusations of price rigging and cartelization (if thats a word  ). That said i agree with you about positive divergences on charts on indicators. Another important thing to keep an eye on is Nifty itself, Many attempts at 12k have failed and now negative divergences on weekly 3 indicators leads to some caution. Personally i feel 11,550 can be on cards though i pray for upside . 3 weeks with large upper weeks calls for caution too.

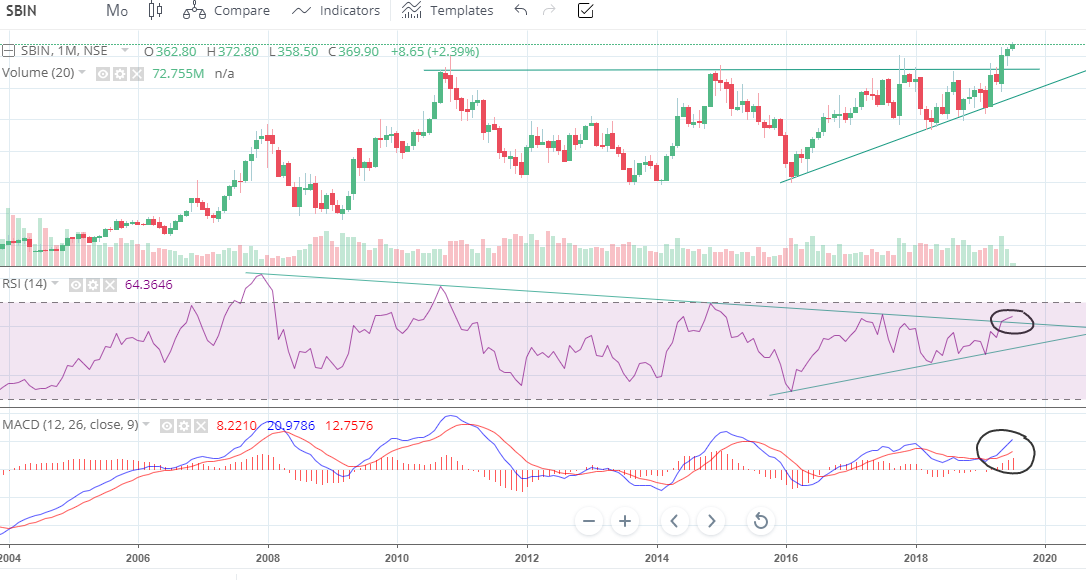
@pranav25; agree with Maithan. Am holding from 550 breakout level and targeting previous 1000 peak in coming months.

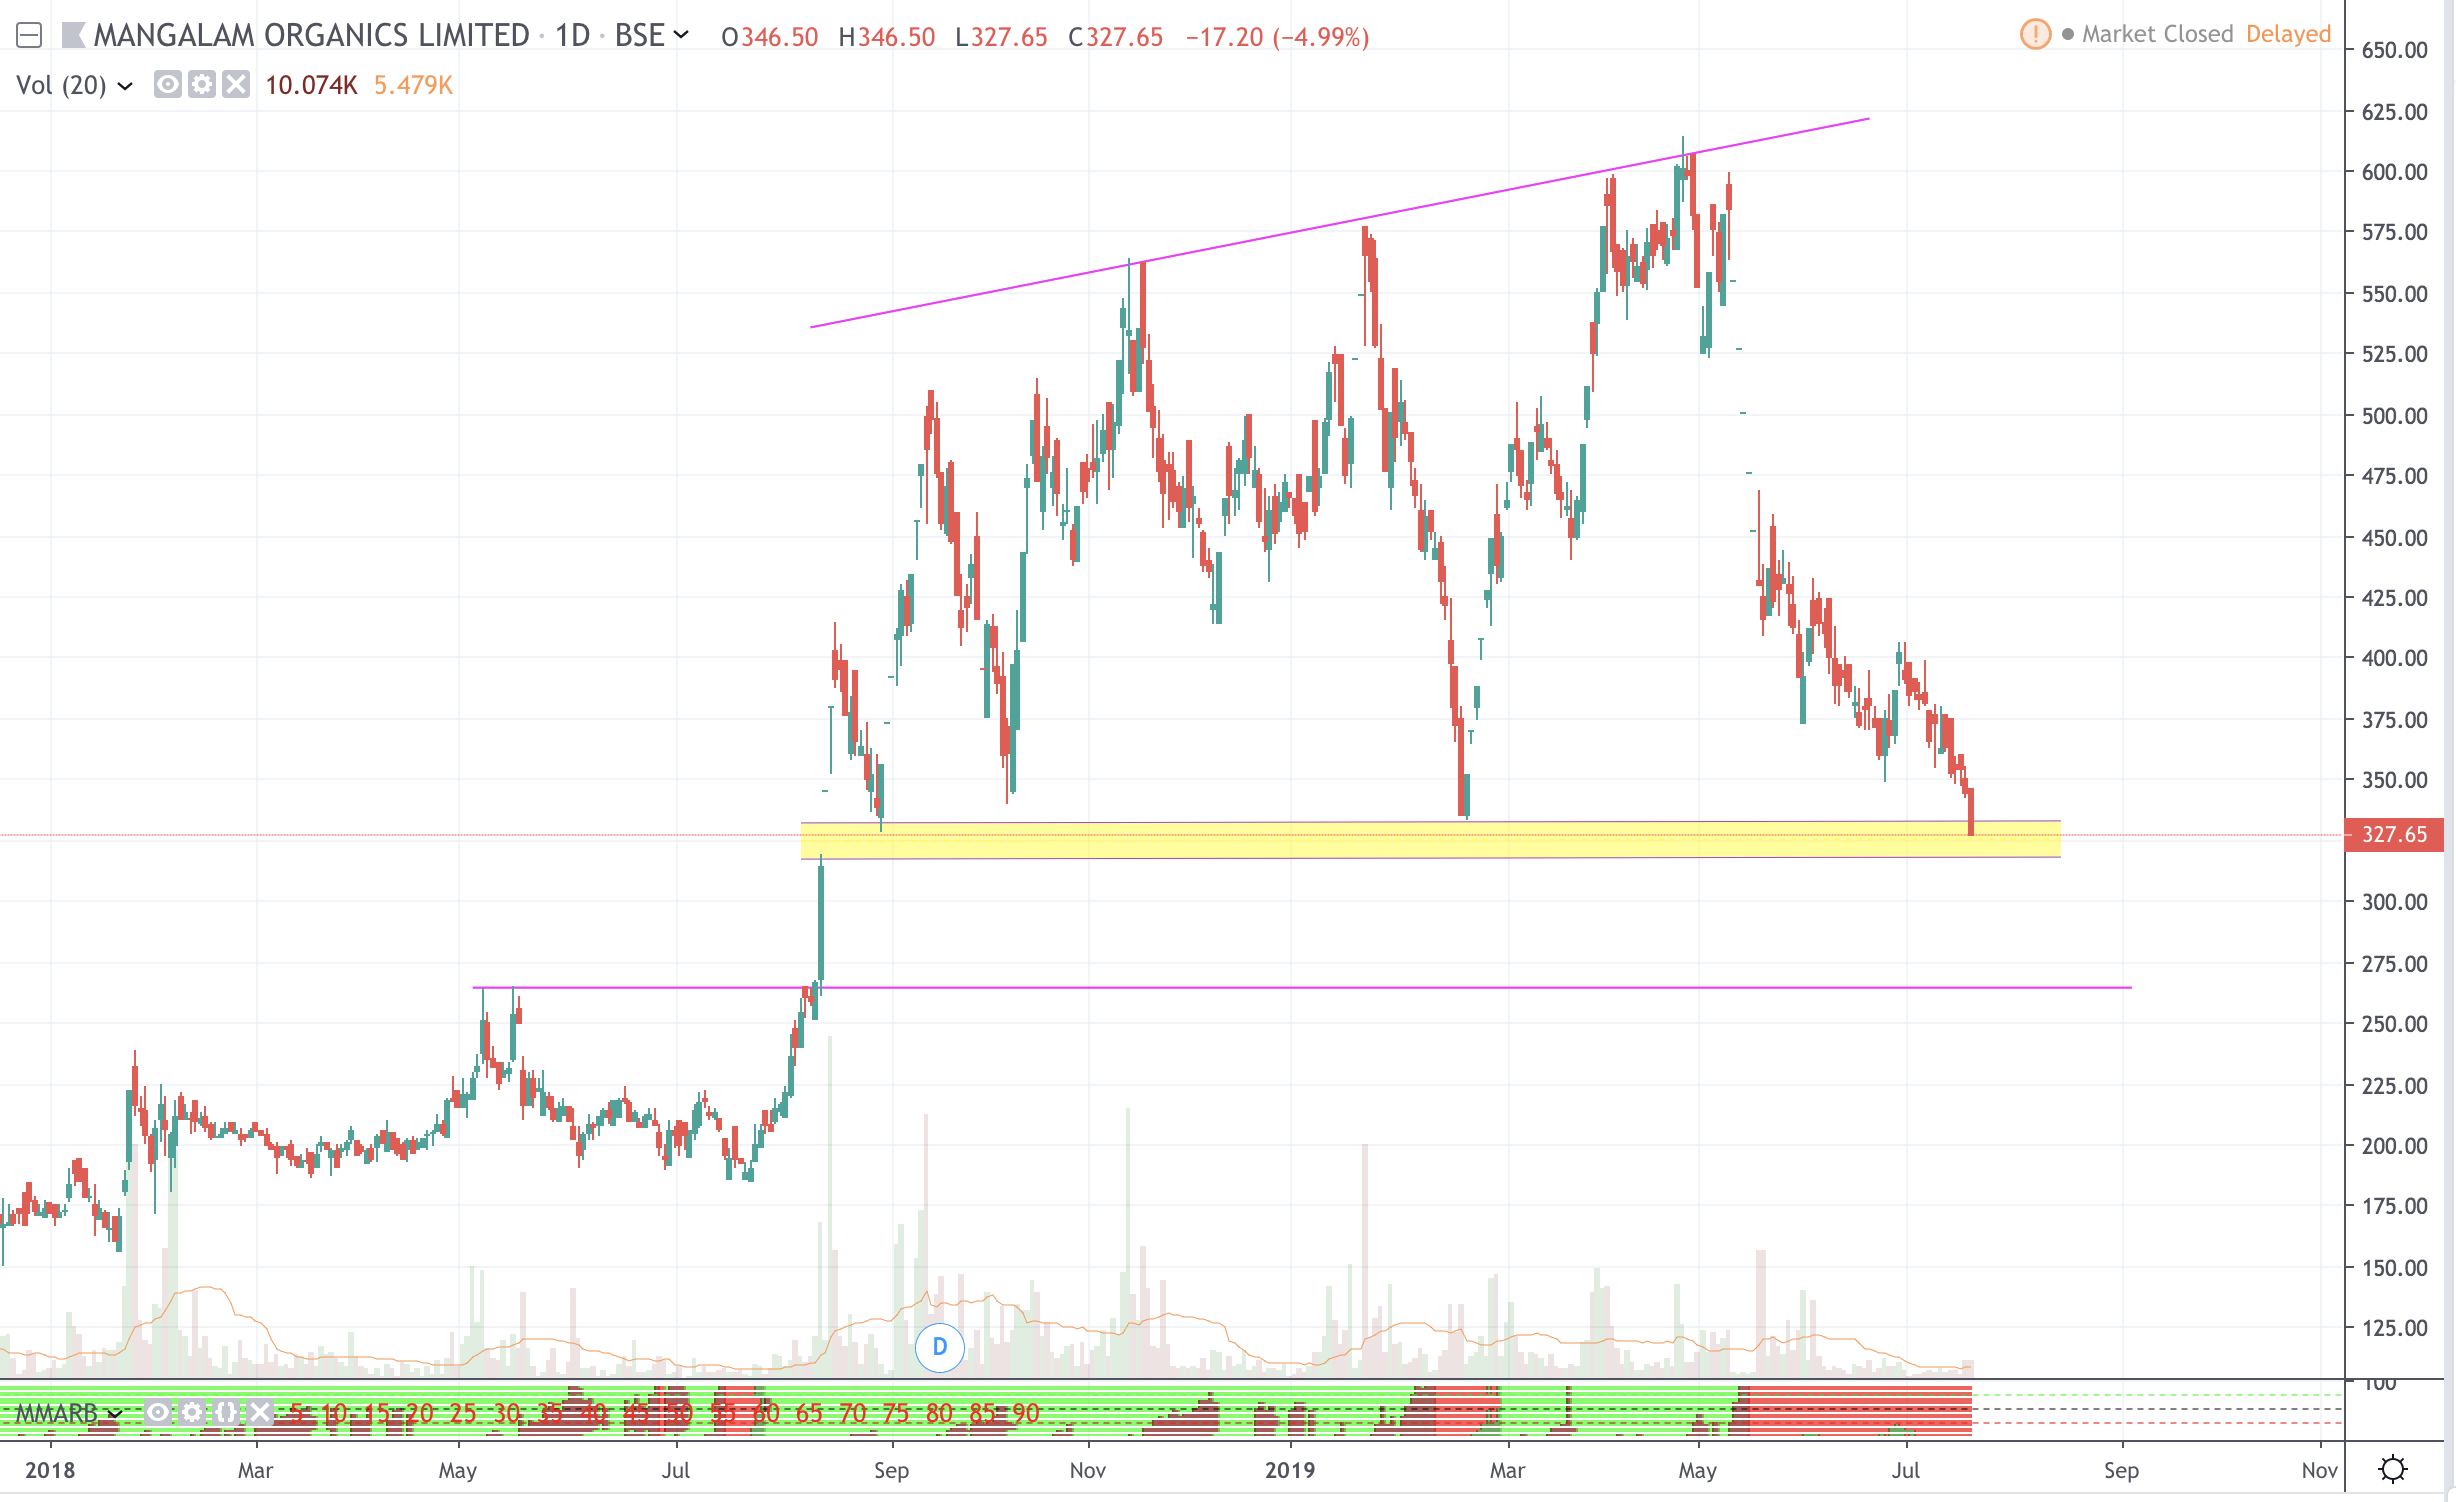
Though it’s tough to predict the exact timing of the next run in smallcap space but it seems the SMALLCAP index is finding a support near 2008 highs.
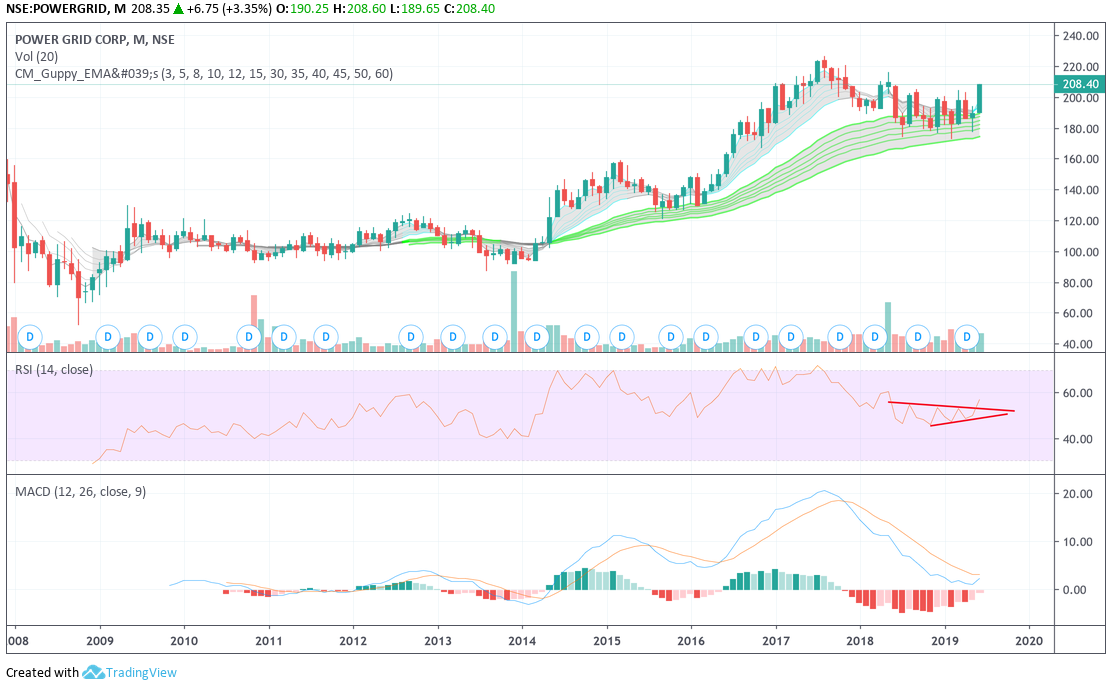
Power Grid
After a decent phase of consolidation, appears to be breaking out. RSI, MACD, Guppy MMA bunching, all point towards positive price movement.
disc; invested my views may be biased
Just a consolidation after downtrend is accumulation or some other confluence factors?need your valuable advice.
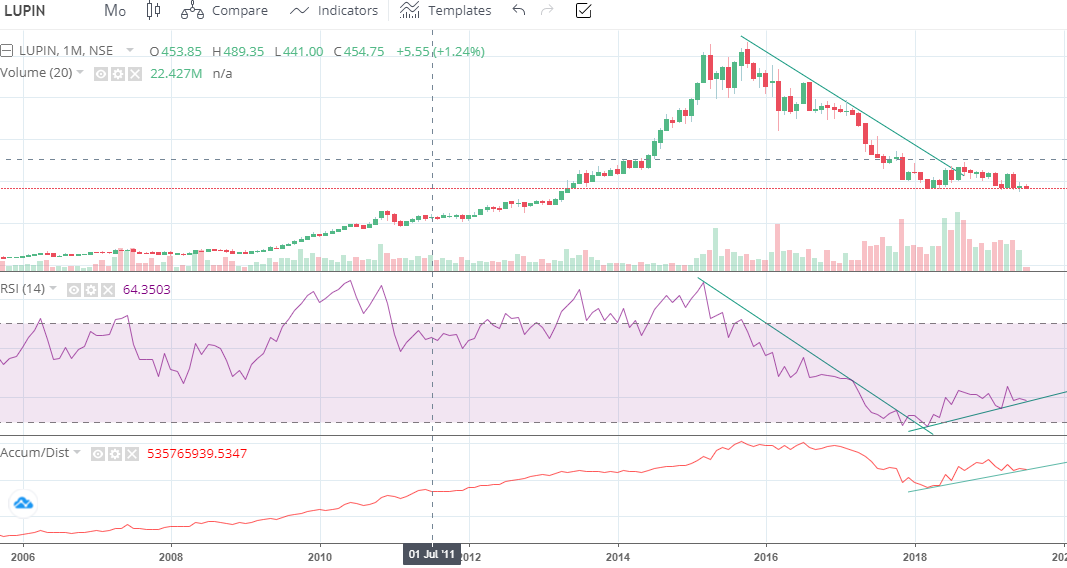
Consolidation in a downtrend is a signal that accumulation is developed, here is a closer look at LUPIN chart.
Yep accumulation is going on…
Rising trendline for A/D against falling price shows that the fall won’t be sustainable and price will rise sooner.
705 is major support…
Hope someone can please help with this : Edelweiss has 200 DMA, 150, 50 and 21 DMA all in very narrow price range of 170.75 and 171.75. Does this mean anything ? Have seen some other charts very range of these DMA getting narrower but above is as narrow as it can be so curious to find out if this has any relevance…
Here basics of technicals based on dow theory in very plain simple words
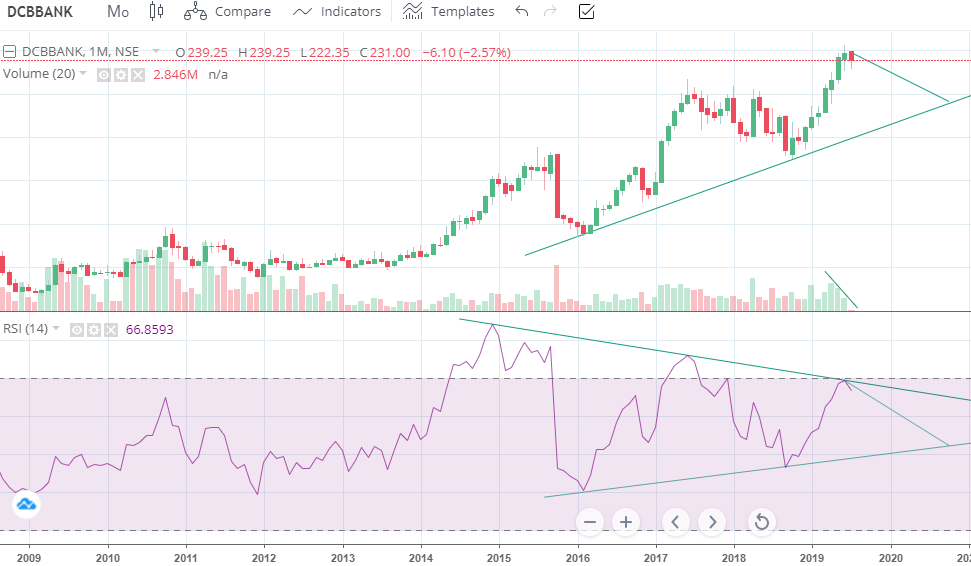
Very good observation and prediction in dcb bank chart. Post results yesterday, the stock price today took a beating and went below 200 dema at around 201.
Listening to the concall, it seems structural story for the bank remains strong but there could be pressure on NIMs for next quarter or 2 quarters. Technically it seems the short to medium term trend is broken and we need to see when and where the stock price settles and takes support.
Trendline support comes in around 170, 200 week EMA is around 160 and retracement levels of the whole rally which seems to be in a five wave upmove are placed at 180 (38.2%), 157 (50%) and 137 (61.8%). I would watch out for support and consolidation in the range of 160-170 if at all stock price goes to that level.
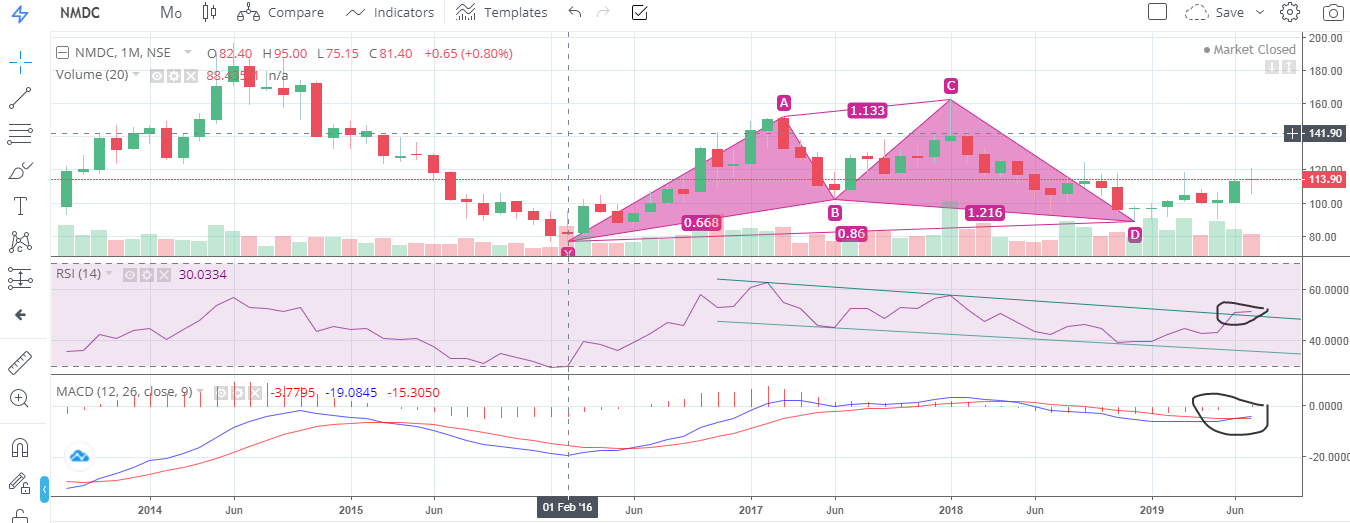
Bullish Bat could fly much higher along with bullish technical (NMDC)
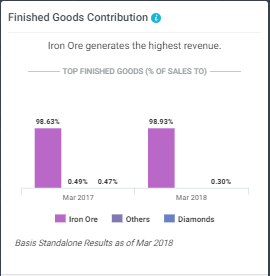
NMDC is India’s single largest iron ore producer, presently producing about 30 million tonnes of iron ore.
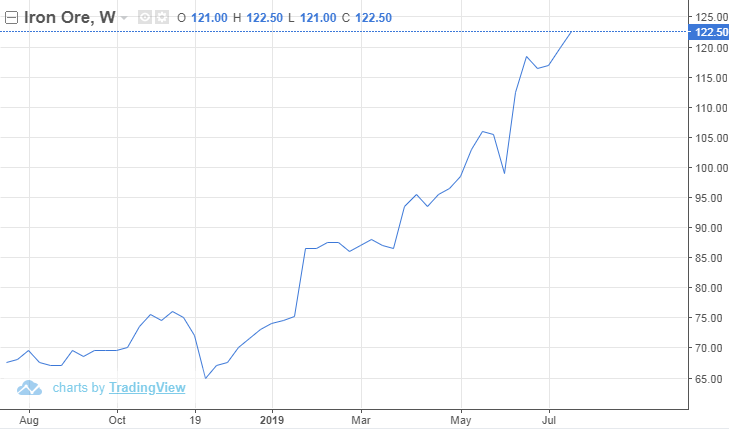
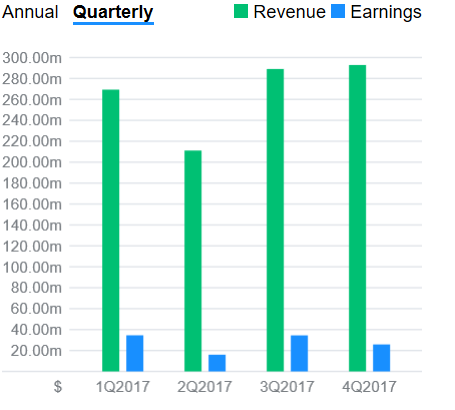
Iron-ore production, sales
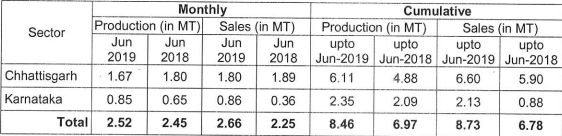
Iron-ore prices up 85% Yearly
Disc- please do your own analysis before investing.