Bull therapy 101-thread for technical analysis with the fundamentals

Hello Fellow Investors,

I’m not sure if this is the right thread, but I wanted to share something I found interesting—something that might serve as a guiding light in these uncertain, yet not necessarily difficult, times.

It’s no surprise that our portfolios are bleeding, especially those focused on small and mid-caps. Every trading day seems to start with another leg down, only to end with the hope that tomorrow will be better.

To make matters worse, the experts we look up to—the celebrated institutional investors—are advising against continuing SIPs in small and mid-caps. They suggest settling for suboptimal returns from here on. While I don’t completely disagree, I believe this message is more suited to general mutual fund investors, not DIY investors like us.

But I see this as the exact opportunity we’ve been waiting for. For the longest time, I wondered why everything was so expensive and where the value was. Well, the market is finally presenting us with that short 10-15 day window (or perhaps a prolonged one), saying: Here it is—take it! And oh boy, I, for one, am all in.

Yes, foreign investors are selling, and domestic institutional investors are trying to match the outflows—but for how long? Meanwhile, retail investors, judging by the last few trading sessions, seem to be losing confidence. Like many of you, I don’t claim to have research reports, expert recommendations, or hard facts. But here’s the light at the end of the tunnel…

If the image isn’t clear, here’s the short version:

The Top Gs (bigger than any FII, DII, or retail investor) are back in town—and they’re buying!

These are the companies I track where this is happening. Feel free to share your own insights and confirm if this pattern holds true:

PVR Inox (19,250 shares)
Deepak Nitrite (30,700 shares)
Tinna Rubber (10,562 shares)
Diamines & Amines (2,754 shares)
Praveg (20,869 shares)
Indoco Remedies (49,700 shares since the start of January)
Pondy Oxide (9,602 shares)
Jindal Steel & Power (Feb: 7,940,815 shares)

They say promoters may sell for a thousand reasons—but they buy for only one.

Happy investing!

35 Likes

Thank you @i_mustafa

I could notice

  1. Zaggle Prepaid
  2. Rashi Peripherals

There could be more.

Probably this warrants a new thread to track Significant promoter buy actions.

8 Likes

Thanks for sharing @james_kerala ,

There has been some follow-up buying in Deepak Nitrite & Diamines & Amines after my last post. Also, adding Nirman Agri Genetics to that list with (10,500 shares).

I found a relevant thread for this. Going ahead, we can use this one below:

3 Likes

thank you for sharing. i have myself recently started tracking promoter buying. but sometimes they buy very insignificant amount. i think we should start to consider large enough amount of transaction as something to take a note off, like say a 1% + change in promoter holding post the transaction (or group of recently done transactions)
i also found this post on reddit from a few years ago where a person did some study on impact of significant insider buys in the us stock market https://www.reddit.com/r/stocks/comments/puhzzv/should_you_follow_insider_transactions_i_analyzed/

5 Likes

Even promoters of Sheela Foam had bought shares from the open market in Nov and Dec last year (2024), and that too in tranches, displaying their confidence in the stock. Since the time of their buying, the stock has only been languishing with each passing week, and now it seems to have broken all resistance levels in its journey to create new 52 Week Lows every day.

Sometimes, promoter buying can also be a window dressing.

15 Likes

Very true
They buy like 1cr worth of stocks which is not even a days turnover

Retail doesn’t usually move markets. Fund do even if they never invest in individual stocks, the funds prop up nifty and other large caps so the rest of the retail is confident on smaller caps

If the large caps fall and funds there withdrawal money, retail also panics and sells

3 Likes

Thanks @Meetkatrodiya . This doc is a treasure trove of information and helps a lot with the calculations and also understanding.

This post is going to be very information heavy, so let me put out the basic objectives first so its clear what I am going to be getting at.

  1. Unit economics
  2. Value addition across the value chain
  3. Capacity calculations by patient for BA and Intermediate (Revised from earlier)
  4. AHA guidelines

The reaction is in 4 stages as per the EC (page 2.45). I am attaching a labeled version here

One key thing that stood out for me is how the structure of intermediate resembles Bempedoic Acid - so intuition told me bulk of the value add is here where the basic carbon backbone is built (Stage 2)

Stage 3 appears to be a simpler reaction while Stage 4 is just purification with no Chemical changes. BlueJet has presence till Stage 2 only.

Also the molecular weights are interesting here - TosMIC M. Wt is 195.24, while the intermediate is 398.59 (or theoretically 1 kg of TosMIC can give 2 kgs of Intermediate) - of course its not produced out of thin air but rest of the weight comes from other components in the equation, like n-Heptane (primarily the Stage 1 which is produced in-house by BJ).

Ignoring Solvent and other basic chemicals, bulk of the cost comes from TosMIC here.

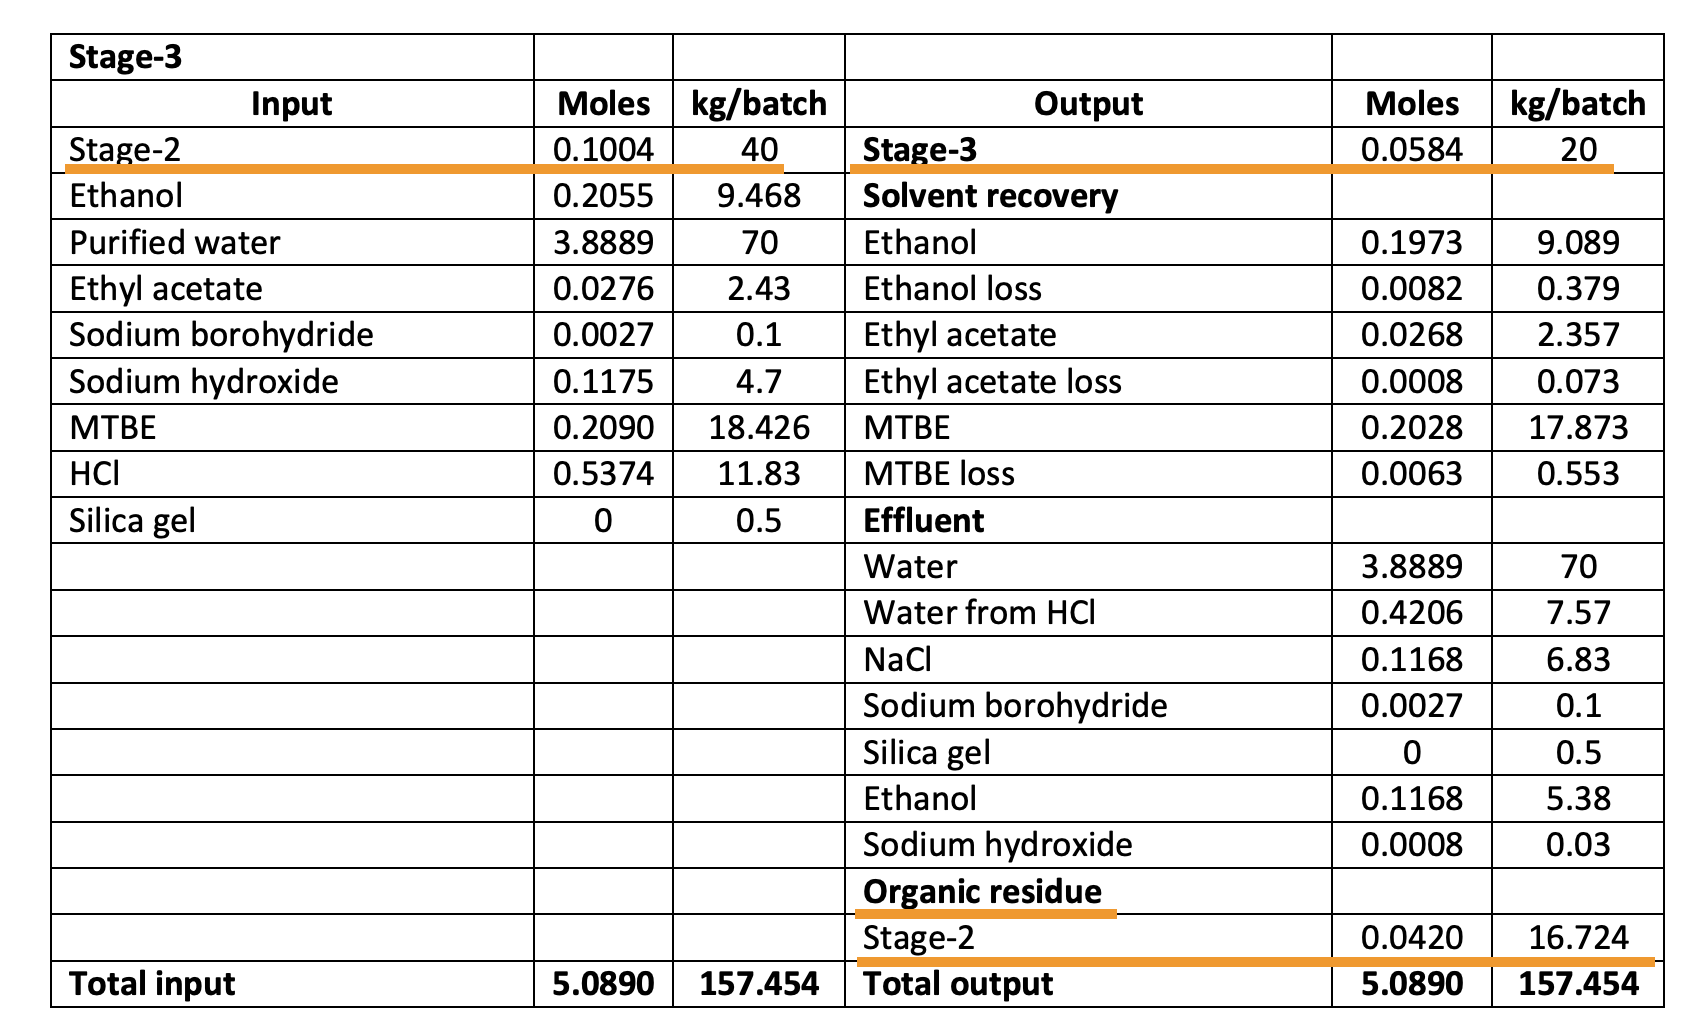
TosMIC is $130/kg. BJ sells intermediate for $450. Neuland sells BA API for $950. On the surface it looks like huge value addition from $450 to $900 (Stage-3 and Stage-4) but a closer look at the Mol Wt. shows Intermediate is 398.59 but BA is 344.49 which means the max conversion ratio we can expect is 86% (or 1kg of Intermediate can produce 0.86 kg of BA which means to produce 1 kg of BA, you need 1.16 kg of Intermediate. We were working with 1.3 as the conversion factor earlier which is a reasonable assumption)

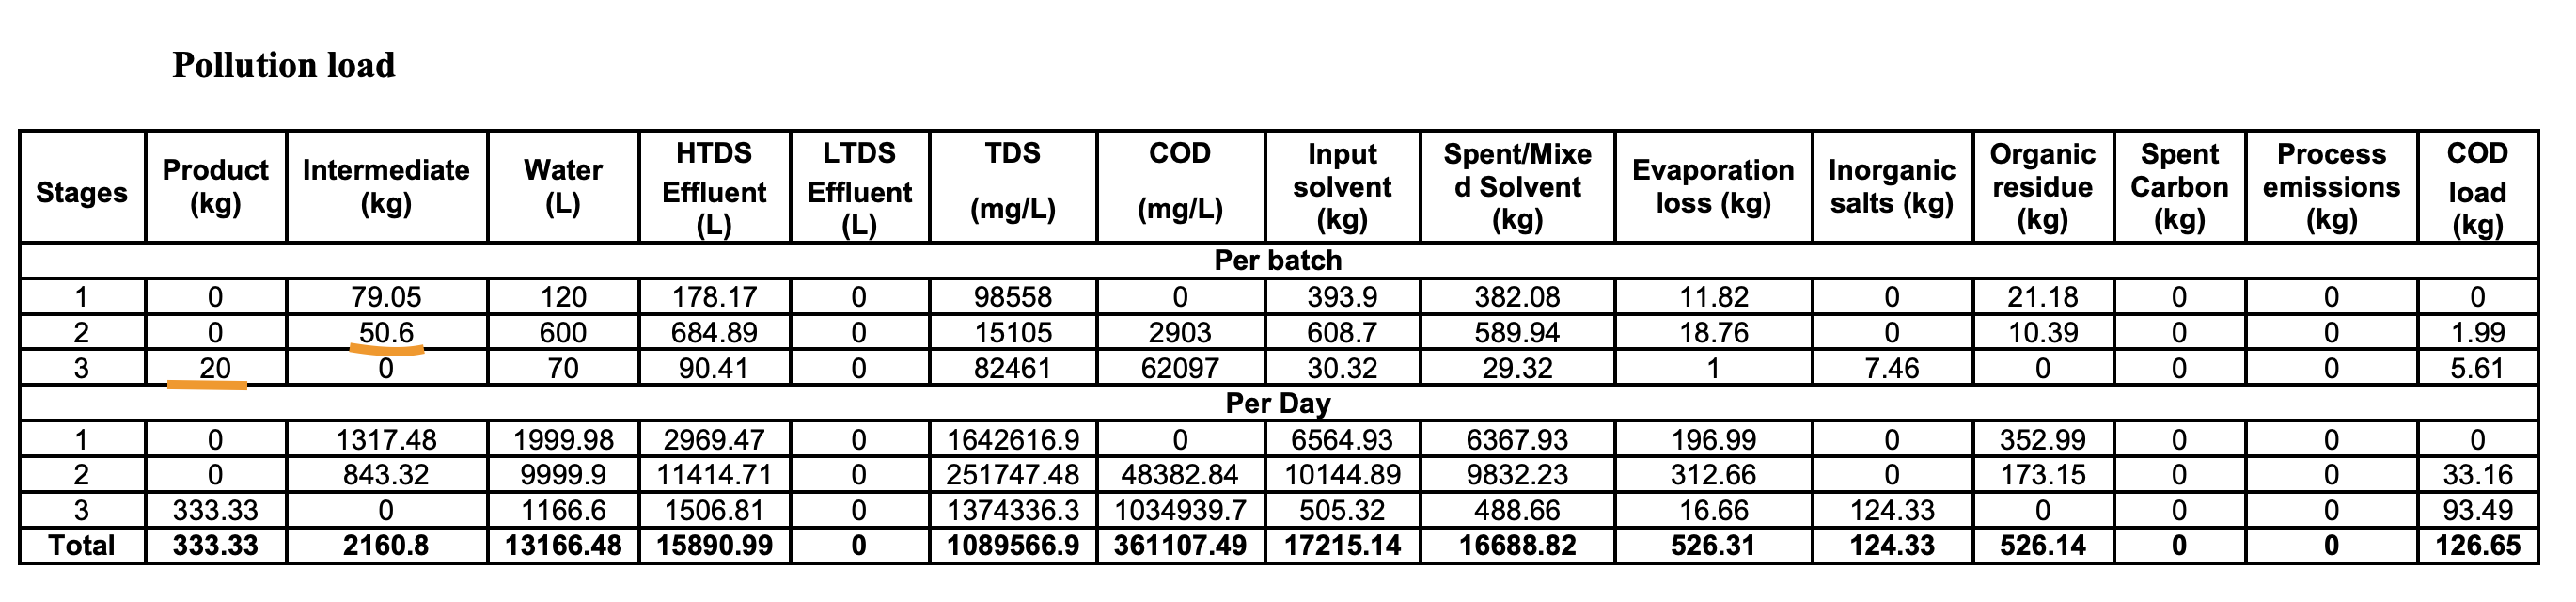
But, the EC also shows something else interesting - it says 50 kg of Intermediate from Stage 2 produces 20 kg of product per batch. This implies a conversion ratio of just 40% which implies that it takes 2.5 kg of intermediate for 1 kg of bempedoic acid unlike our earlier assumption of 1.3 (This tells us our earlier assumptions of patients was way off which we will revisit in a bit). Also notice that per batch produces just 20 kg of products and to produce 333 kg/day, 16-17 batches have to be run (maybe 30 mins per batch?)

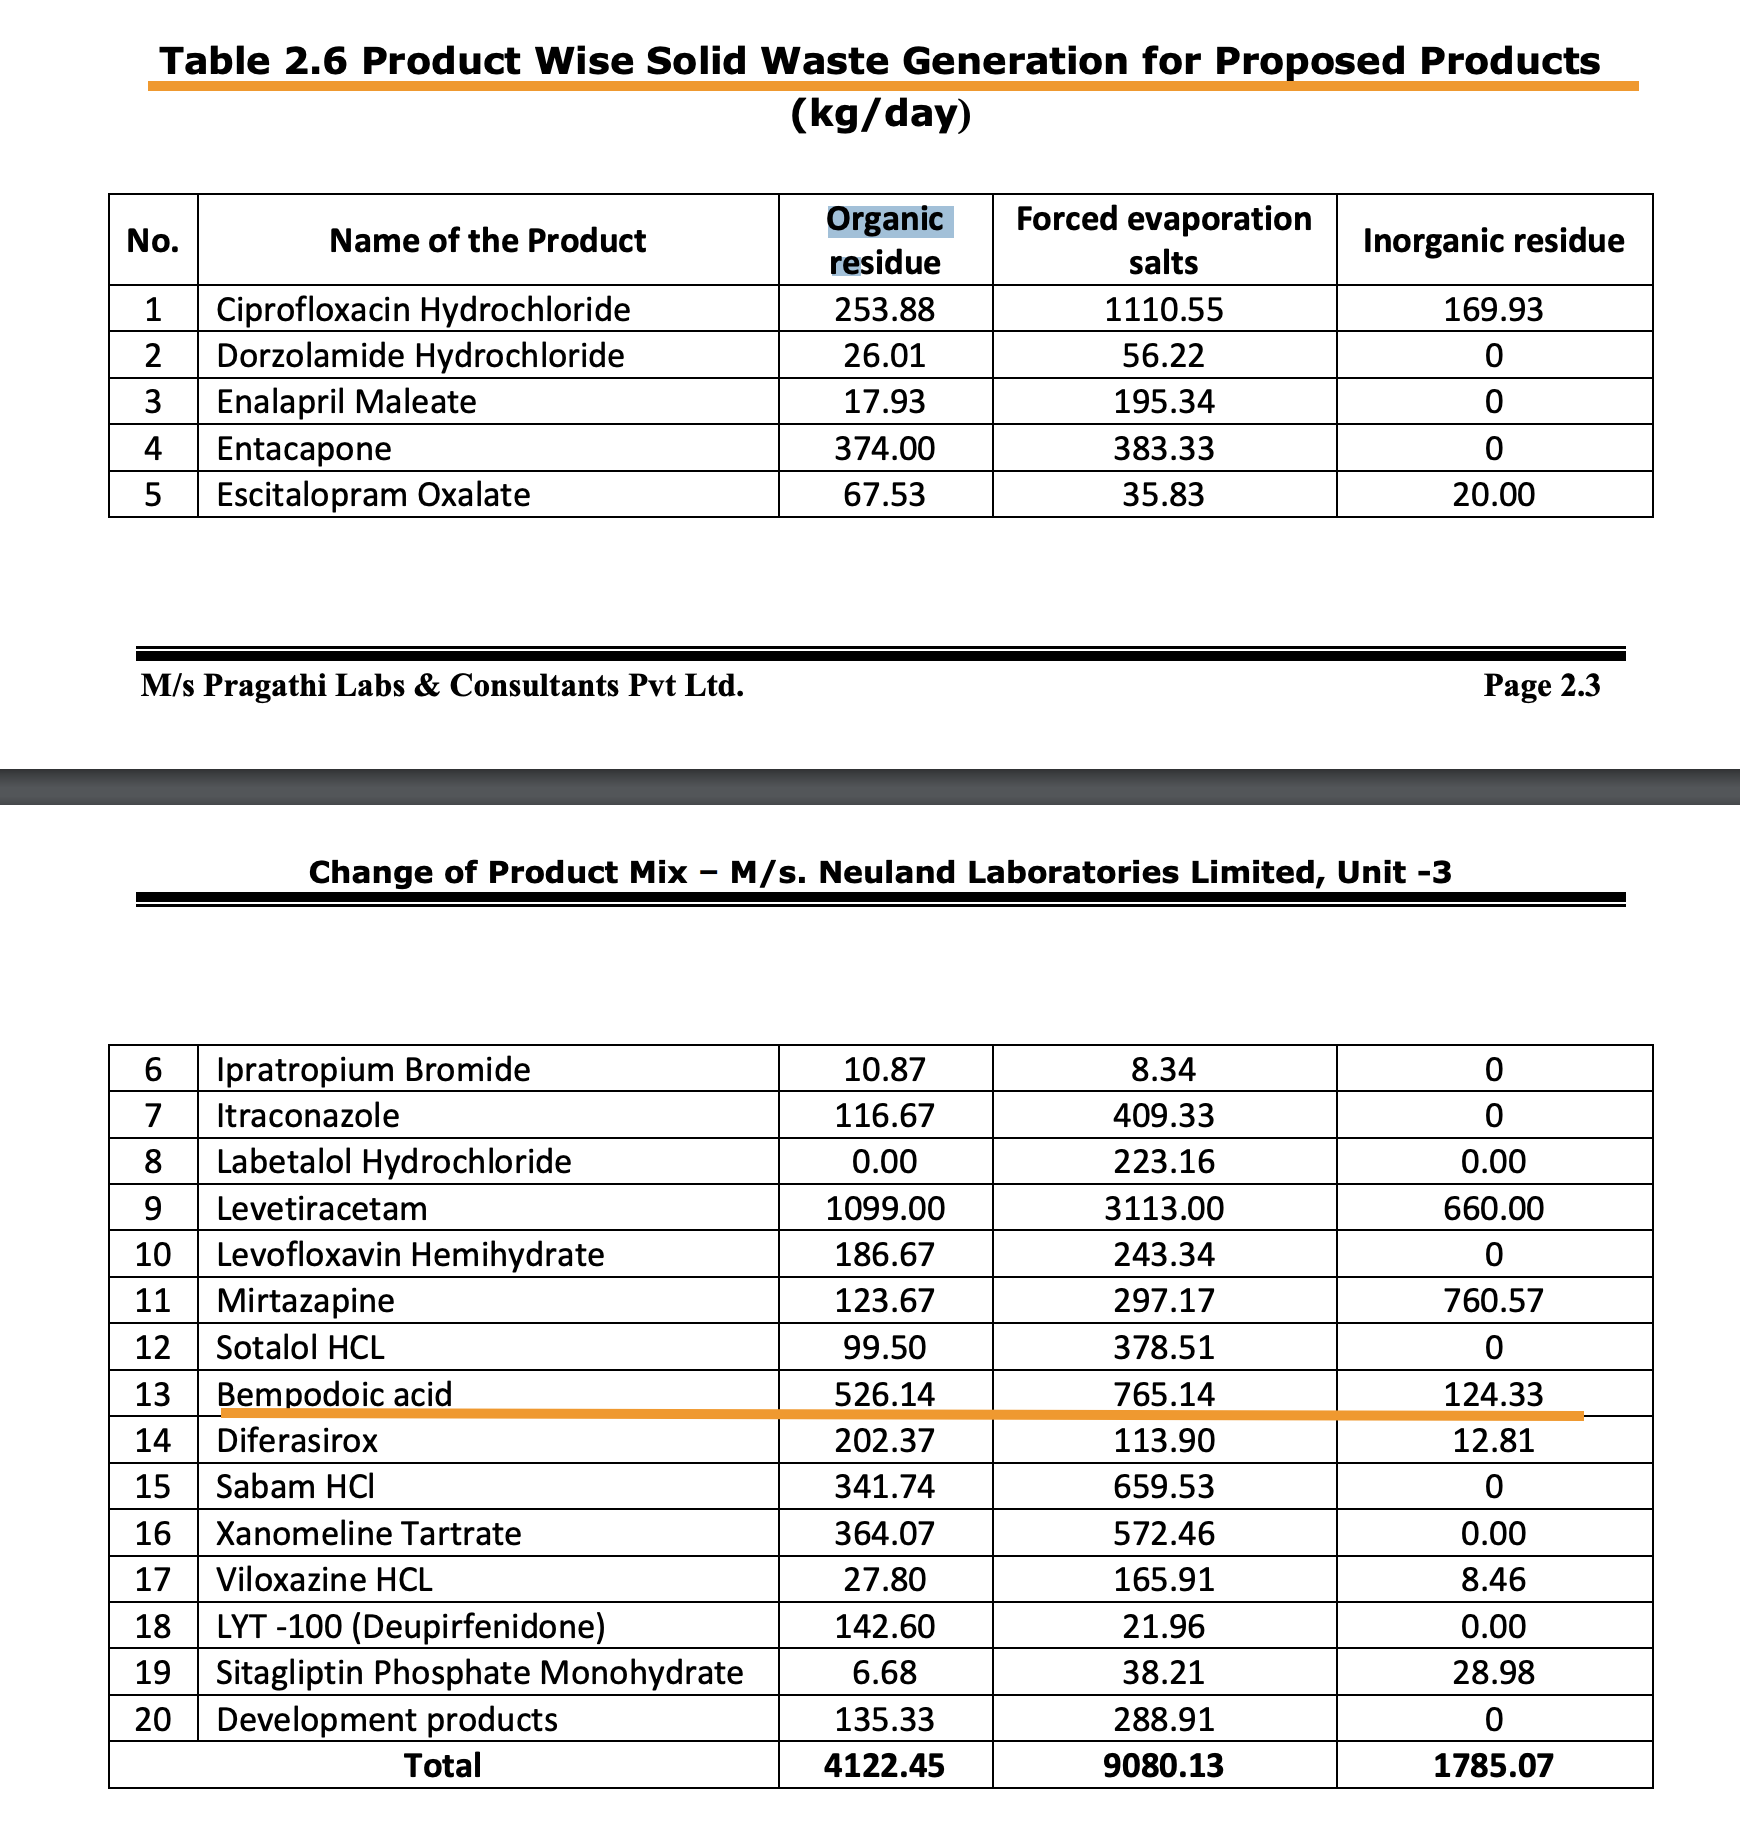
The Stage-2 conversion into BA is actually more like 50% (40 kg/batch of intermediate produces 20 kg/batch of product). A whole lot of intermediate that BlueJet makes is lost in the process of producing BA as “Organic Residue”

The natural question that arises is if this is reusable. This doesn’t seem to be the case as Organic Residue here is marked as Solid Waste.

So we can safely, conservatively assume 2kg of BlueJet intermediate makes 1kg of BA API.

Now lets address the question of value addition in Stage-3. If it takes 2kg of Intermediate - that adds up to $450x2 = $900 of Intermediate to produce $950 of BA API which on the surface makes no sense but if you think about it, Neuland is backward integrated and so can produce BA API for somewhat cheaper and we are comparing it with shipped cost of Intermediate by BlueJet. Piramal Pharma buys BA API from Esperion for a whopping $1300 - this is because of the above intermediate cost of $900 that goes into it.

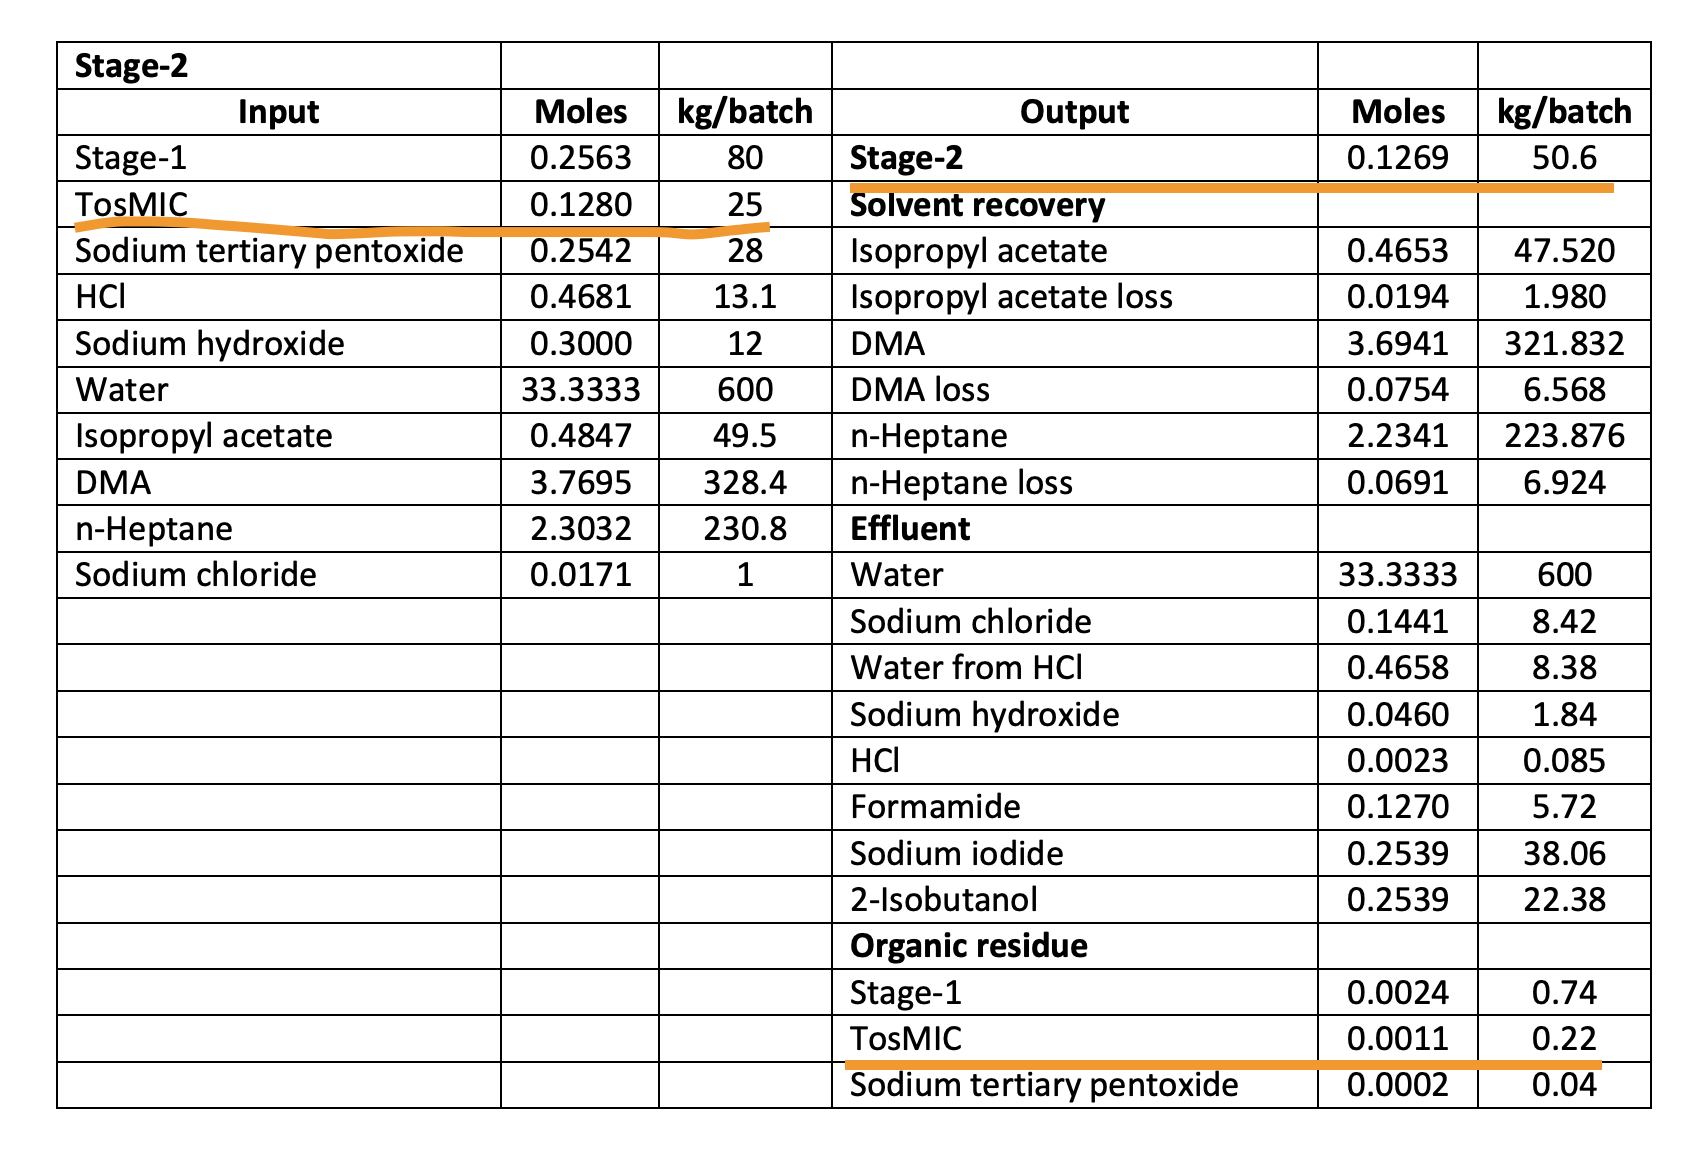
Now let’s look at value addition in Stage-2 which I was guessing was the big money step. The Mol Wt. of TosMIC and Intermediate told us there’s a possibility of 1kg of TosMIC ($130) yielding 2kg of Intermediate (2x$450 = $900). What’s it like in reality as per Neuland’s EC?

25 kg of TosMIC produces 50.6 kg of Intermediate! This is a super-efficient step and you can see TosMIC lost as organic residue is very, very small. So the conclusion is clearly that BlueJet captures almost all the value with the intermediate production.

What does this do to our patients per MTPA calculations? It remains same for BA API at 15,220 patients/MT as earlier. But at 50% conversion, it reduces it to 7600 patients/MT for intermediate and to 6000 patients/MT at 40% conversion ratio (which the first table seems to imply when it says 50kg of intermediate produces 20kg of BA). This would put the 180 MTPA capacity of BlueJet at roughly 1M patients (6000 x 180 MTPA) because this can effectively cater to a BA API capacity of only 72 MTPA (0.4 x 180 MTPA).

Continuing with the unit economics, we know from Esperion’s sales that the revenue for US per patient/month works out to $55 (Take Sept '24 - $31.1m for 190k patients per quarter works out to $163 for 3 months or $55/patient per month). We know 1 MT of BA API caters to 15,220 patients - that’s $950x1000 worth of API per year - so per month it works out to $5.2 per patient per month. So ESPR markup is roughly 10x on the API which is understandable since they are the innovator. This also tells us there’s no point for them to squeeze BlueJet or Neuland as their cost in API is just 10%. The retail price of this without insurance goes up to $500 - another 10x markup! No wonder there are discounts available to buy at $220 or so online in the US without insurance. With insurance, it seems to work out to around $35 or so per month.

In India (there’s no patent here, so generics are available), the tablets sell for Rs. 240 for 10, so its roughly $9 for a month. The amount of API in this, assuming they follow the same stringent manufacturing standards remains at $5.20, so there’s still a good margin for the generic guys. It is fascinating to see how overvalued meds are in the US when you work out unit economics this way (Even if there’s a crackdown by RFK, this base price of API should remain protected as its such a small part of the price to customer)

There’s another interesting development that has happened last week. The American Heart Association has finally revised its guidelines for ACS after 6 years.

2025 Guideline for the Management of Patients With Acute Coronary Syndromes.pdf (1.4 MB)

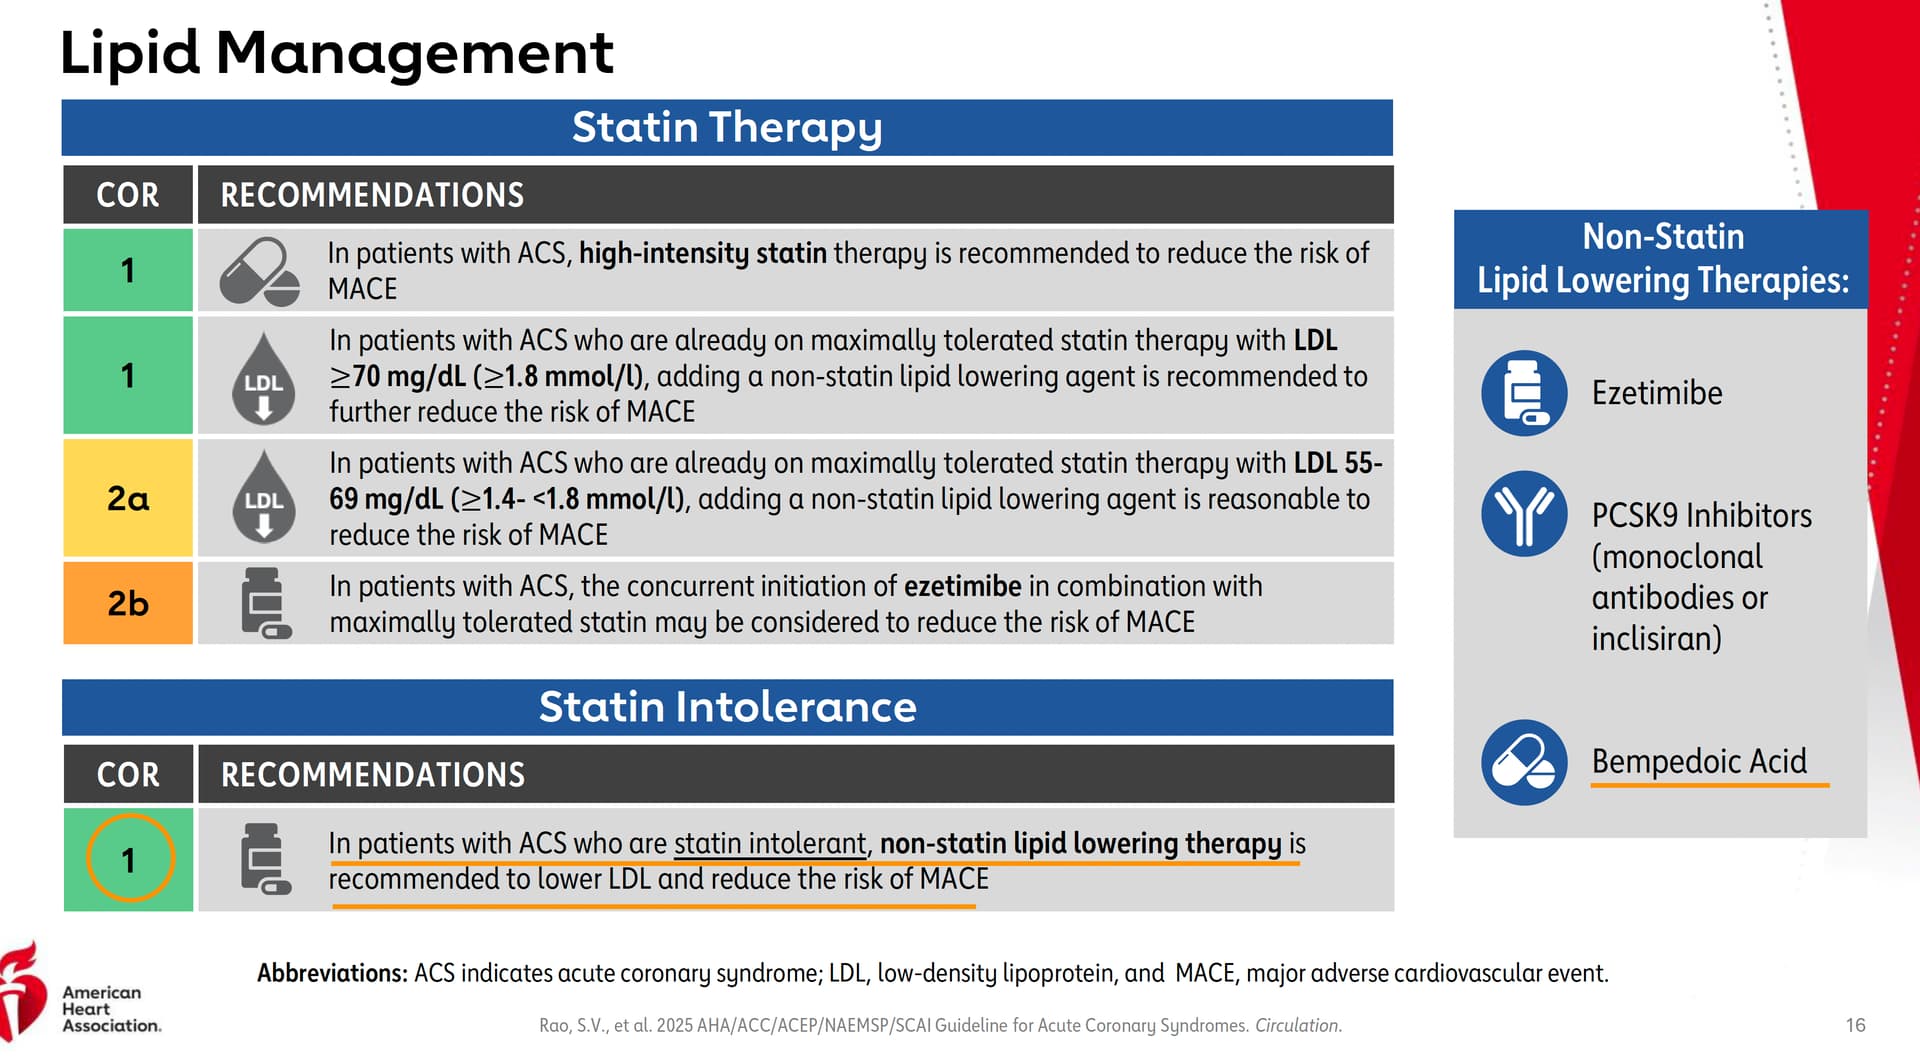
It has recommended Bempedoic Acid as part of the non-statin treatments.

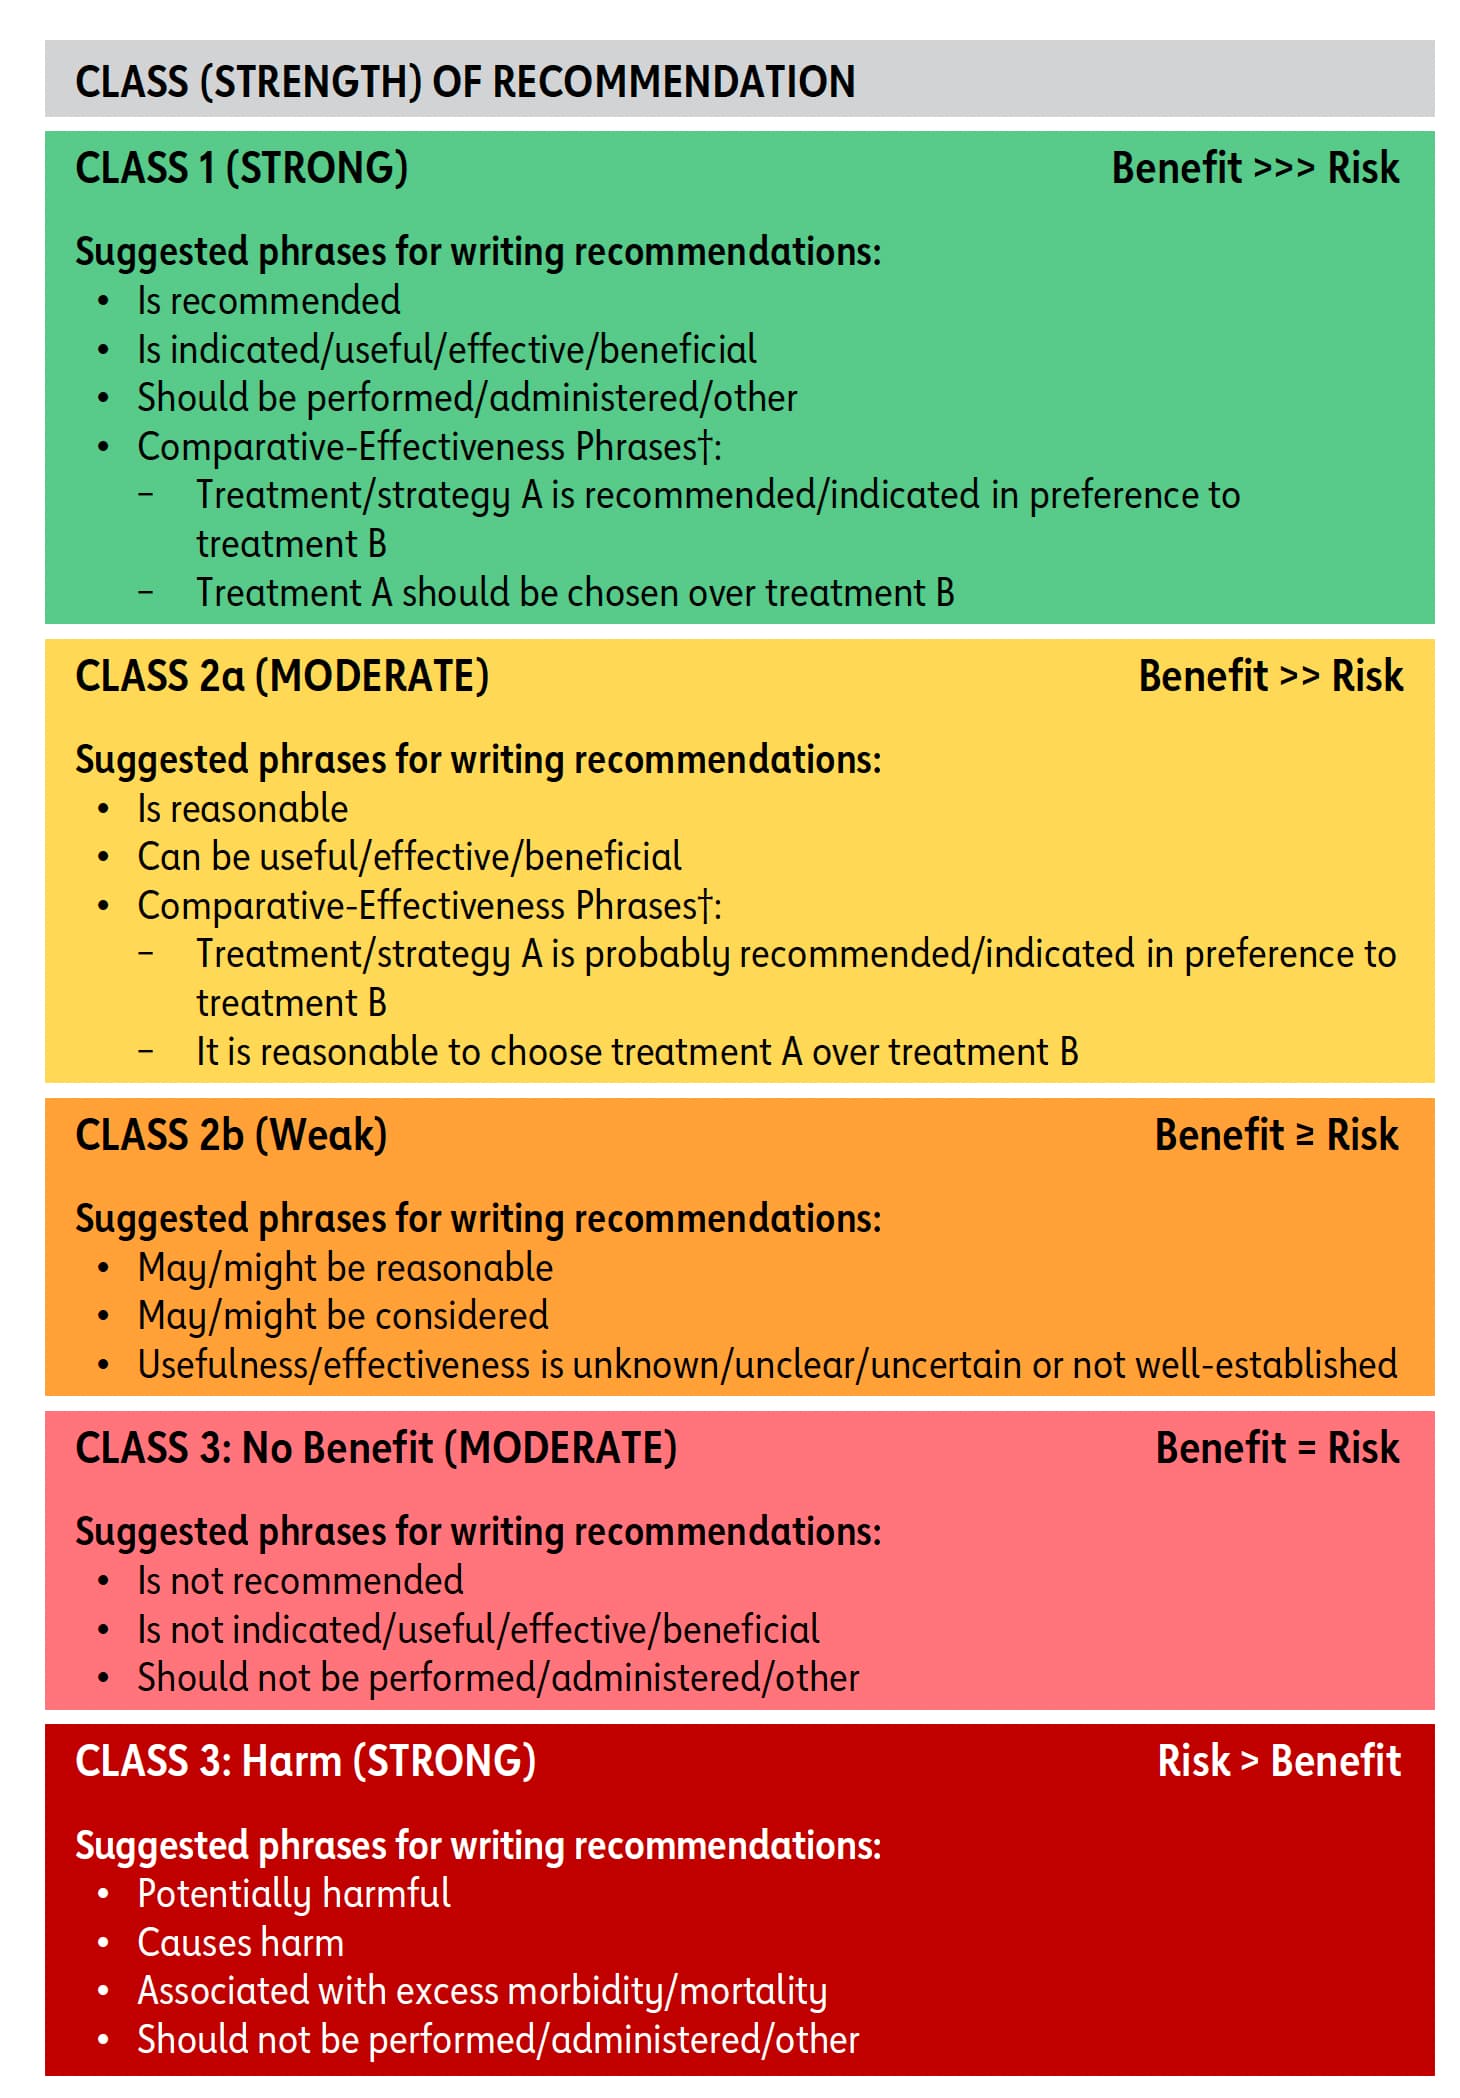
Class-I implies that Benefits far outweigh Risk

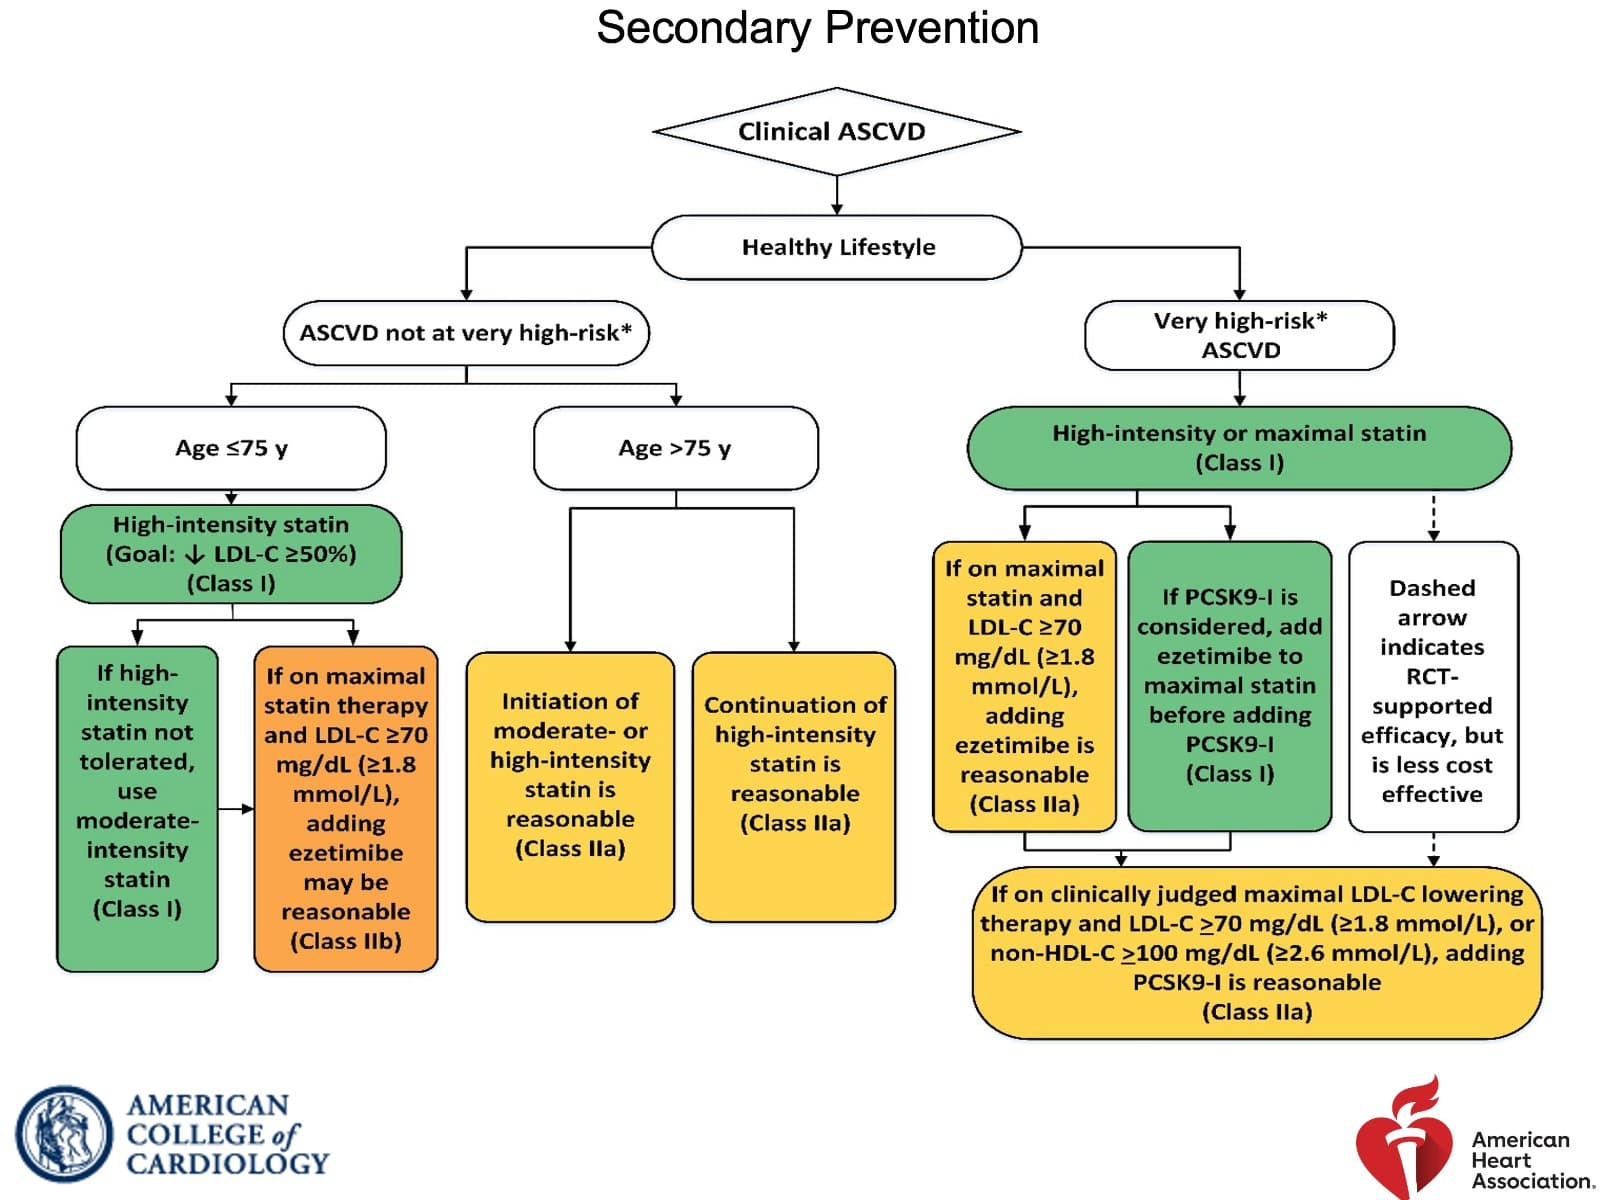
To put it in perspective, this is guideline from 2018. Back then there was no category for statin-intolerant or statin refusal (this seems more common now as people see negative reviews for statins online which is in stage-3 of Seige cycle). Also note how only PCSK9 is Class-I for already on maximally tolerated statin but needs further reduction category

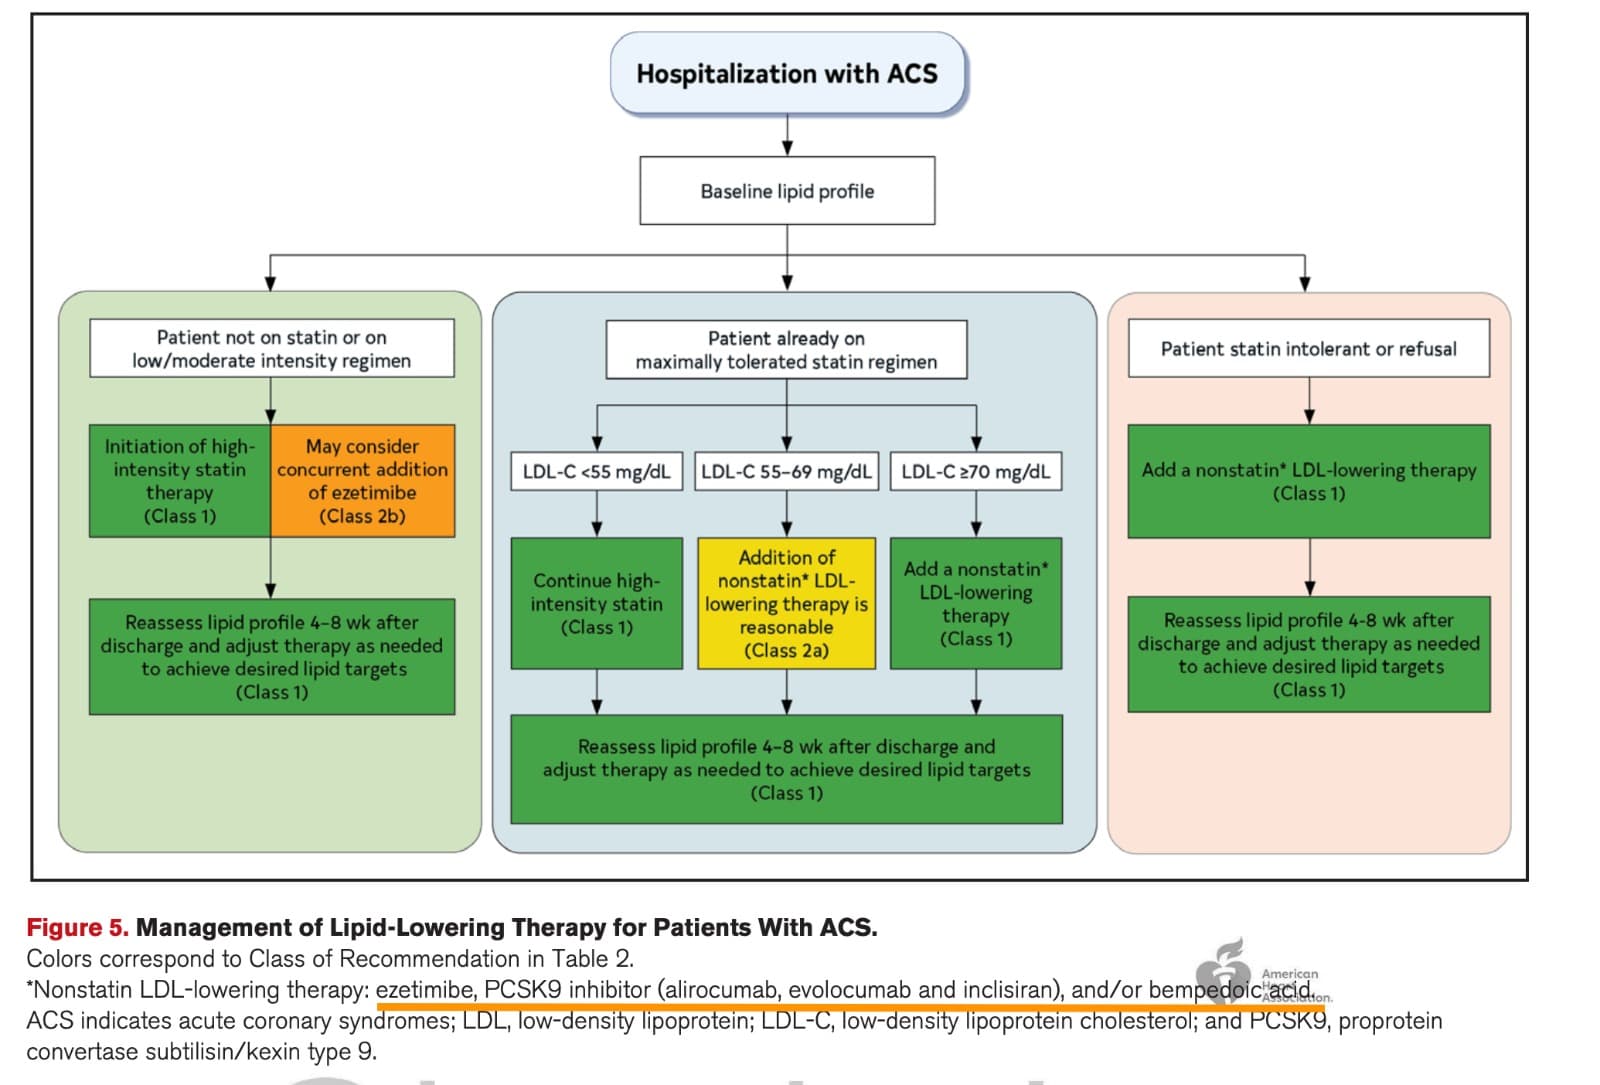
Guideline from 2025. The last box for statin intolerant or refusal is new and the recommendation is Class-I directly! Also note how the maximally tolerated has changed from just PCSK9 in green to whole Non-statin therapy as Class-I

PCSK9 is not covered by insurance, so there’s good chance for Nexlizet/Nexletol being preferred options here. Also notice the and/or in the footnote, which implies the Ezetimibe+BA combination can be recommended as well.

This has more potential than the label expansion from last year to accelerate sales, as it can become a pull product (doctors go by the AHA guidelines) than a push product (solely MR driven).

It feels almost like a crime to be bullish on anything in current market conditions, but working on fundamentals is essential to maintain sanity.

Disc: Invested in BlueJet and have recent buy transactions

123 Likes

This is very interesting outlook.
Just trying to understand if we have considered the cost of stage 1 in our calculations when we calculate the intermediate output .
25kg of TosMIC + 80 kg of stage 1 would give 50 kg of intermediate. While we are considering the cost of TosMIC, any idea what would be the cost of stage 1 intermediate?

1 Like

Inventories are unlikely to move in lockstep as Blue Jet is not manufacturing Bempedoic Acid, but an intermediate (TosMic).

I believe Daiichi Sankyo Europe is the manufacturer of Bempedoic Acid that is served to Esperion but there is considerable obscurity on this part, I haven’t been able to figure out the whole supply chain.

1 Like

Agree with you. @phreakv6 - since your posts has detailed fundamentals, request you to post in the company thread for better tracking. You can put the link to that post here.

7 Likes

Just technicals for a change. :slight_smile:

The market has turned quite sharply this week. The leaders of current phase are already showing themselves in the 52 wk highs. 13 stocks hit 52 wk high (above 1000 Cr mcap). The top 10 here have 3 from active positions which has helped the pf post a strong recovery this week.

Bluejet, Daily - Hit a fresh 52 wk high/ATH on Friday. Its a triangle breakout as well. I think may have discussed too much of its fundamentals in the previous 4 posts, so will skip here

Strong close on the weekly as well. Broke out of the channel post Q3 numbers and consolidated last 4 weeks and broke out this week.

Shaily, Weekly - Has been the another strong stock. Hit a fresh 52 wk high on Friday and closed at ATH. Strong buying from MSCI couple of weeks back made sure it didn’t capitulate with the rest of the market and now its hitting new highs with ease

Axiscades, Weekly - Another one which closed on Friday at fresh 52 wk closing high. Broke out of a flag pattern as well on the weekly

Even the ones that have fallen should rise if backed by strong fundamentals and earnings.

Ceinsys and Wockhardt have perhaps fallen more but both have strong weekly turn visible and should hopefully recover back to highs - ceinsys on the back of earnings which will hopefully be good for Q4 and Wockhardt on the back of WCK-5222 NDA filing when it happens. As an SME, Holmarc’s 25% fall from top is respectable and appears to have found bottom around 150.

Disc: Invested in names mentioned as disclosed earlier in this thread

93 Likes

As I assess the current market landscape, I want to document my observations and revisit them in 3-4 years to evaluate how events unfolded.

A key indicator guiding my analysis is Relative Strength, which reveals where capital is flowing. By applying this metric, we can identify which stocks and sectors are being accumulated and which are experiencing distribution.

If I screen for all stocks above 500cr market cap as of today (13th March, 2025), I get 1743 stocks. Below is the breakdown of destruction that has happened in them in the recent carnage:

Down from 52w High No. of Stocks
> 80% 4
80% - 70% 21
70% - 60% 78
60% - 50% 286
50% - 40% 448
40% - 30% 441
30% - 20% 263
20% - 15% 69
15% - 10% 46
10% - 0% 87
Total 1743

Previous cycle winners, now down at least 30% from their 52-week highs, are likely to include stocks from Infrastructure, Railways, Energy, Power/Electric, Defense, Cables, and New Age Technology Businesses. While many may not revisit their all-time highs (ATHs) for several years or until the next cycle, some could bounce back rapidly if they sustain their current earnings trajectory.

The Transformers and Defense segments appear interesting for a potential rebound. However, one would adopt a cautious approach and avoid bottom-fishing in these sectors, at least for now.
Instead, one should wait for below items in winners of the past cycle:

1. Base formation: Allow these stocks to establish a stable base after their significant decline (Stage 1).
2. Earnings growth: Observe earnings growth for 2-3 consecutive quarters.
3. Strong earnings guidance: Listen for positive earnings guidance during quarterly conference calls, indicating fundamental strength.

Only then would one consider buying these stocks as they break out towards possible Stage 2.

After this big carnage - we should be most interested in the stocks which have not fallen much, which is 0%-15% down from the 52 week high. We get about 133 stocks out of 1743 which is 7.6% of the short listed universe. Please find it here.
VP Post_13th March 2025.xlsx (1.0 MB)

Why have these 133 stocks fallen the least? My guess is that market has sensed good upcoming earnings growth or less deceleration of earnings growth in them. As markets have taught us in the past, there are very good odds that leaders of the next bull-run are possibly from these 133 stocks and their sectors.

Here should be a fun exercise for curious minds. Let’s find if the winners of the previous cycle (Infra, Railways, Power, Hotels, etc) fell least during last carnage.

June of 2022 and March of 2023 were the two lowest trough points with highest possible drawdown pain in last 5 years (barring few sharp dips of 2024 which were bought very fast and we got a v shape recovery). Let’s look at stocks that just broke out of long consolidation and were holding up quite well in June of 2022 and March of 2023 and check how they fared post the pain period ended.

One will be surprised to know that the biggest winner of past cycle, Apar Industries made a new ATH when market was hitting it lowest trough around 17th June 2022.

Period Stocks Holding Up
Jun-22 Lemon Tree
Jun-22 Chalet Hotels
Jun-22 Royal Orchid
Jun-22 Indian Hotels
Jun-22 ITC
Jun-22 Coromandel International
Jun-22 MB Agro
Jun-22 Honda India Power
Jun-22 Volatamp Transformers
Jun-22 Apar Industries
Jun-22 HBL Power
Jun-22 Jupiter Wagons
Mar-23 Chamanlal
Mar-23 Siemens
Mar-23 ABB India
Mar-23 Gujarat Pipavav
Mar-23 Foseco India
Mar-23 TD Power Systems
Mar-23 Power Mech Projects
Mar-23 KPIT Tech
Mar-23 Cummins India
Mar-23 TIIL Ltd
Mar-23 NCC Ltd.
Mar-23 Titagardh Wagons
Mar-23 Kalpatru Power
Mar-23 Cera Sanitaryware
Mar-23 HG Infra Engineering
Mar-23 Vardhman Special Steel
Mar-23 Finolex Cables

Ticker tape was screaming loud and clear Hotels, Power, Railways, and Fertilizer/Agro in June 2022 low.

Similarly there was super resilience by Power, Infra, Capital Goods during lows of March 2023.

Market has indeed rewarded handsomely if one had focused on Relative Strength and resilient stocks/sectors.

Let’s come back and look at the breakdown of our 133 stocks which are showing resiliency currently:

Resilient Sectors No. Of Stocks
Auto & Auto Ancillaries 3
Banks Private/NBFCs 20
Breweries & Dist 2
Casting/Metal 7
Cement 5
Chemicals 5
IT/Technology 3
Construction 16
Misc 11
Electric/Power 1
Engineering/Cap Goods 5
Fertilizer/Pesticides Agrochem 5
Food Processing 4
Hospitals 4
Hotels 9
Pharma 16
Plastic Products 3
Telecom 1
Textile 3
Trading 9
Airline 1
Total 133

There are few Trust companies categorized as “Construction” which have not fallen much like Energy Infra Trust, Indus infra Trust, NDR Invit Trust. So its safe to ignore the entire pack.

Two sectors that have shown great resiliency are Banks/NBFCs/Finance & Investment and Pharma.

I’d not be surprised if we have these two sectors taking the lead in the next run-up. Banks and NBFCs have gone through 3-4 years of time correction and have built a solid base. Their multiple has contracted with growth in earnings and book value.

Within Pharma we have had good resiliency shown by CDMO players. Many of them are benefitting from the ongoing China+1 theme with very strong earnings visibility while working with big innovators. CDMO is considered to be the mega trend for next few years. Some of the CDMO players are trading expensive for the perceived clear road ahead - so please be careful.

There are many stocks in other sectors too which have held up because of solid earnings visibility. Outside of Financials and Pharma - its still big pond for stock pickers. Market is indeed very smart at punishing and rewarding.

Let’s see if and when market makes a bottom first – which we shall know only in the hindsight.

182 Likes

Great idea. Here’s a dynamic tracker for the same
https://www.screener.in/screens/2577549/new-bull-market-leaders/

49 Likes

Contrarian Thoughts here. Can try this exercise for Indian Markets as well

PS: New to Investing.

8 Likes

After going through the video, I have one argument against it.
It does not cover the entire bull-run period; it just covers the recovery period. The stocks that have corrected the most have more upside.
It would have been interesting if the period covered the entire bull run from the point of recovery.

3 Likes

thank you very much for such an interesting analysis, new investors like me really find these type of content worth reading and studying

4 Likes

Interesting
I did some basic analysis from my phone
So find stocks with more than 40% drop during covid
Find stocks that fell less than 15% during covid

In those groups find stocks that did well in 6 months after
And in those groups find stocks that did worse in 6 months

In the stocks that did well, there is something like survival basis where we are only looking at good stocks

The ideal thing to do would be to look at where the risk would have been lowest, which is found in stocks that did the worse in the following 6 months

Here we find that those that held atleast 15pc had a better performance than those that did below 40pc


I really have very high respect for stockbee but I don’t see a pattern

I think in the end it’s individual stock fundamentals that matter. In good period, post recession, stocks that show higher profits or potential for higher profits rise, even if they fell

Post COVID was a “good” period purely because a lot of money was poured into the system creating a lot of liquidity which rose prices of all assets.

If you have a fundamentally growing company the best to do during a drawdown is to sit tight something a pure technician cannot afford to do

14 Likes

For a newbie like me, this contraian video, sounds much more logical, even without the proof.

My logic - When a stock has fallen more than 50%. if we filter them with some basic Fundamental like profit growth & D/E, Instititional buying, they will be the ones which will catchup fastest!

https://www.screener.in/screens/2584966/bigfallgoodfundas/

4 Likes

Good Logic, if it can give consistent earnings from here on and valuation have become cheaper it will bounce but not all it will be very selective and that is why I added Average ROE >13 as if company is not making money for its shareholder than forget that it will make money for us in other words you can say “cost of Equity” than its useless to touch those companies
https://www.screener.in/screens/2586391/stock-50-down-from-ath-but-roe-13/

1 Like

@Ravi_Somani

I don’t agree with both hypothesis…

  1. Stocks who dont fall much in bear market , emerged as new leaders and

  2. Stocks which fall too much, they come up faster than others while recovery.

Different Stocks fall to Different extent depend on their recent rally or stagnation and their fall may not coincide with general market fall, as in they may start falling late.
For example…In case of BSE, it was maintaining it’s strength from October till January when market was brutally falling…but it started falling late January and in February by 32% from ATH…After the change in weekly expiry for NSE contracts.

So conclusion is …those who fall in bear markets, they will come up in new bull market, ONLY IF , their earnings and sales growth keep on increasing faster than others, otherwise they will remain down for many years.

15 Likes